2961
31P MRSI of the human brain: do we need 7T to detect two Pi pools, UDPG signals and determine the NAD+/NADH ratio?1Radiology, Radboud University Nijmegen Medical centre, Nijmegen, Netherlands, 2Radboud University Nijmegen Medical centre, Nijmegen, Netherlands
Synopsis
All resonances in human brain 31P MR spectra detectable at 7T and higher can also be detected at 3T provided that 1H decoupling, 1H-31P NOE and a 31P receive-array are used. This includes a alkaline peak for extracellular Pi and peaks assigned to UDPG. A NAD+/NADH redox state similar to that reported at 7T was observed. A comparison of measured T1 values with those reported at different field strengths and NOEs measured at 3 and 7T indicates that CSA is not dominant in 31P relaxation and hence there is no sensitivity benefit from shorter T1s at higher fields.
Introduction
Noninvasive spatially resolved measurements of metabolites involved in bioenergetics and phospholipid metabolism in the human brain is possible by phosphorus MR spectroscopic imaging (31P MRSI), which is relevant to study neurological diseases [1, 2]. However, in vivo 31P MRSI is challenging due to low intrinsic SNR and signal overlap. Performing 31P MRSI at 7T or higher field strengths may partly solve these problems, but by applying 1H-31P decoupling, by exploiting the nuclear Overhauser effect (NOE) and using 31P phased-array receivers a similar spectral resolution and improved sensitivity is also possible on 3T MR systems, which are more widely available3. Peaks for an alkaline Pi and UDPG and the NAD+/NADH ratio have been determined at field strengths above 3T, suggesting that higher fields are required for this purpose. We investigated if this information can also be obtained at 3T. Moreover, it is often implicitly assumed that T1’s of 31P brain metabolites decline at higher field strength because of increased CSA relaxation, favoring a better SNR per unit time at higher fields. We also examined this assumption.Materials and Methods
Twelve volunteers were measured at 3T (Trio, Siemens, Germany) using a TxRx 31P/1H birdcage coil (RAPID, Germany) combined with an 8-channel 31P insert head-array[3]. Whole-brain 3D 31P MRSI was performed with a 400 hard pulse and Hamming weighted k-space sampling (FOV=260x260x260mm, matrix=10x10x10, nominal voxel 17.6 cm3, TR=2000ms, acquisition time=13:03 minutes). For 1H-decoupling a WALTZ4 train (256ms) was used and NOE pulses (γB1=35Hz) were applied ~1.5s prior to excitation. In a separate 31P-MRSI examination with decoupling and NOE, UDPG was detected (nominal voxel size ~80 cm3, Tr=1750ms, acquisition time 45min).T1 relaxation times were assessed by progressive saturation 31P-MRSI with a 900-flip and 6 Tr’s (500–18000ms).
After matrix interpolation (16x16x16) spectra were fitted in the time domain (Syngo.via) including prior knowledge of chemical shifts, 31P-31P couplings and relative peaks heights. Chemical shifts and linewidths of NAD+ and NADH were related to the αATP doublet. 1H-31P NOE was evaluated in 20 different voxels from the occipito-temporal-parietal (OTP) cortex. pH was calculated from the PCr-Pi chemical shift. T1 values were obtained by fitting the signal integrals as a function of Tr with a mono-exponential function.
Results
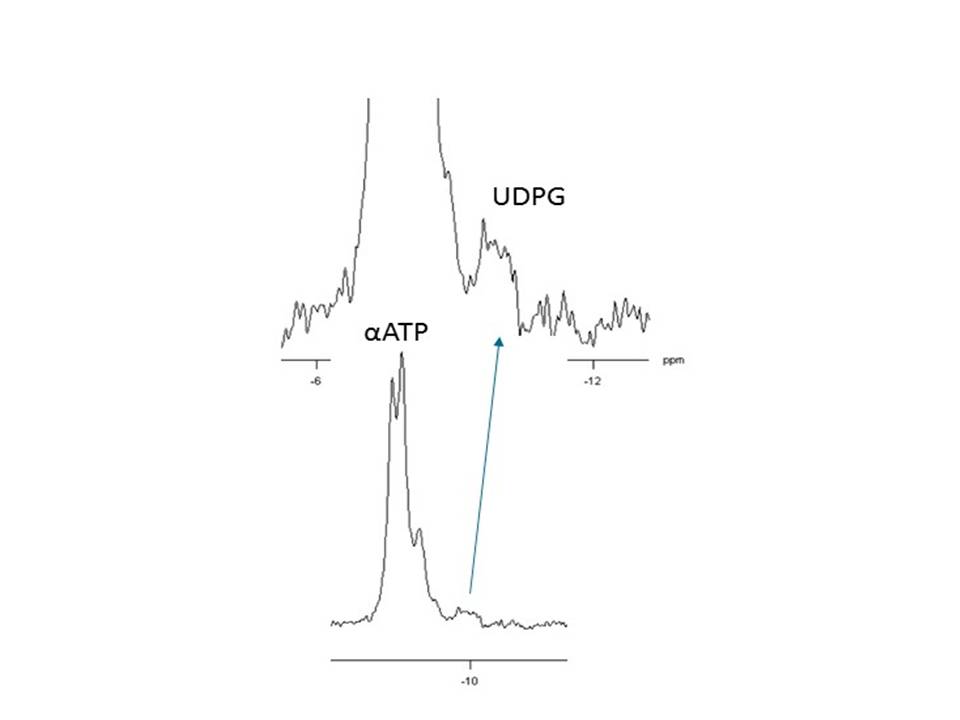
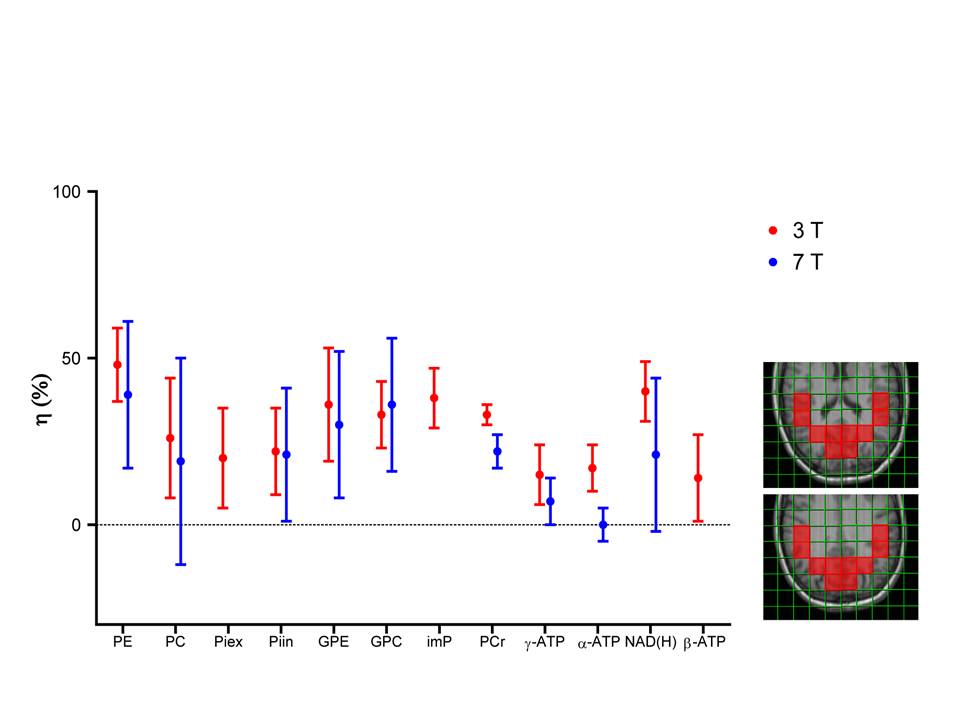
Applying 1H-31P decoupling and NOE results in 31P MRSI spectra of the brain in which mono- and diester signals are resolved. In addition, peaks are observed for NAD(H) and for an alkaline Pi peak. The pH calculated from this Piex peak varied between 7.3 and 7.5 for different voxels(Fig.1). Fitting the NAD+ and NADH resonances in spectra from the OTP region(Fig.2) resulted in an average cellular redox state NAD+/NADH of 5.7 ± 0.6 (n=4). In voxels of ~80 cm3 also signals assigned to UDPG were detected, however no clear doublets were observed with expected ~20Hz J-coupling as in αATP(Fig.3).1H-31P NOEs determined for the OTP region varied from ~15% (ATP) to 50% (phosphoethanolamine). NOE values obtained at 7T for the same region are very comparable(Fig 4).
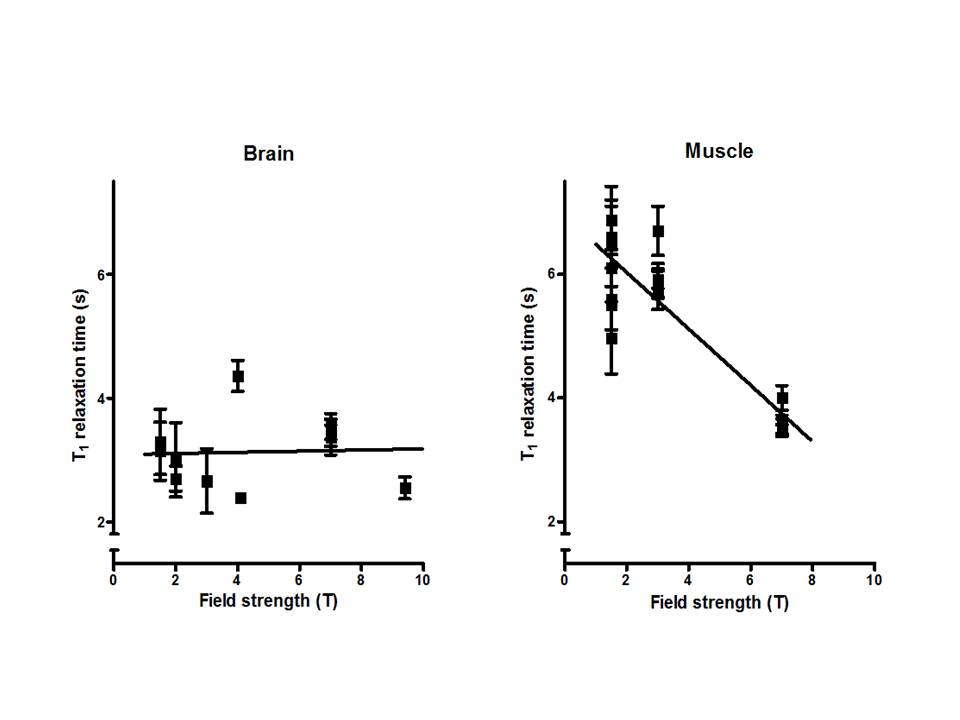
The T1 of 31P spins of the major metabolites at 3T were similar to those obtained at 2T[4]. The T1 of the alkaline Pi peak (3.82±1.4s) was significantly (p<0.05) longer than that of the cytosolic Pi (1.84±0.65s). A comparison of 31P T1 values of all major metabolites obtained at field strengths from 1.5T to 9.4T shows no T1 decrease (Fig.5 with PCr as example).
Discussion
We showed that all resonances in human brain 31P MR spectra detectable at 7T can also be resolved and detected at 3T provided that 1H decoupling, NOE and a 31P receive-array are used, in agreement with the assessment that linewidths in ppm only decrease slightly from 3 to 7T[5]. The alkaline Pi has been assigned to an extracellular compartment[6], which agrees with its longer T1, indicating no involvement in cellular exchange with ATP. The NAD+/NADH redox ratio that we calculated is similar to that obtained at 4T[7]. For resonances at the UDPG position we did not detect a typical roof-structured 20Hz J-coupled doublet as seen in UDPG solutions at 3T, which might indicate another compound or UDPG structure resonating at this position[8].An evaluation of the T1 values measured in this study with all T1 values reported for field strengths from 1.5 to 9.4T[4,9] indicates that T1’s do not decrease as a function of field strength. This also follows from the similarity in NOE’s between 3 and 7T as these depend on T1. Hence CSA does not dominate 31P relaxation in the brain and consequently there is no sensitivity benefit from shorter T1s at higher field.
Acknowledgements
No acknowledgement found.References
1. Rijpma A, van der Graaf M, Meulenbroek O, Olde Rikkert MGM, Heerschap A. Altered brain high‐energy phosphate metabolism in mild Alzheimer's disease:a 3‐dimensional 31P MR spectroscopic imaging study. NeuroImage Clin. 2018;18:254‐261.
2. Wenger KJ, Hattingen E, Franz K, Steinbach JP, Bähr O, Pilatus U. Intracellular pH measured pH measured by 31P-MR spectroscopy might predict site of progression in recurrent glioblastoma under antiangiogenic therapy .J Magn Reson Imaging. 2017 Oct;46(4):1200-1208.
3. van Uden MJ, Peeters TH, Rijpma A, Rodgers CT, Heerschap A, Scheenen TWJ An 8-channel receive array for improved 31P MRSI of the whole brain at 3T . Magn Reson Med 2019 Aug 82(2); 825-832
4.Merboldt et al. Localized P31 NMR-spectroscopy of the adult human brain in vivo using stimulated-echo (steam) sequences J Magn Res 1990;189: 343-361
5. Lu M, Chen W, Zhu XH. Field dependence study of in vivo brain 31P MRS up to 16.4 T. NMR Biomed. 2014;27:1135‐1141.
6. Ren J, Shang T, Sherry AD, Malloy CR. Unveiling a hidden 31P signal coresonating with extracellular inorganic phosphate by outer‐volume‐suppression and localized 31P MRS in the human brain at 7 T. Magn Reson Med. 2018;80:1289‐1297.
7.Lu M, Zhu X‐H, Chen W. In vivo 31 P MRS assessment of intracellular NAD metabolites and NAD+/NADH redox state in human brain at 4 T. NMR Biomed. 2016;29:1010‐1017.
8. Ren J., et al., Human brain 31P NMR spectra at 7T: UDP-glucose assignment revisited. In Proc Intern Soc Magn Reson Magn Med, Montreal 2019: 482.9. Luyten PR, et al Experimental approaches to image localized human 31P NMR spectroscopy. Magn Reson Med. 1989;11:1‐21; Ren J, et al 31 P‐MRS of healthy human brain: ATP synthesis, metabolite concentrations, pH, and T 1 relaxation times. NMR Biomed. 2015;28:1455‐1462. Lei H, et al In vivo 31P magnetic resonance spectroscopy of human brain at 7 T: an initial experience. Magn Reson Med. 2003;49:199‐205. Pohmann R, et al T1 values of phosphorus metabolites in the human visual cortex at 9.4 T. In: Proc Intern Soc Magn Reson Med. Paris; 2018:3394.
Figures
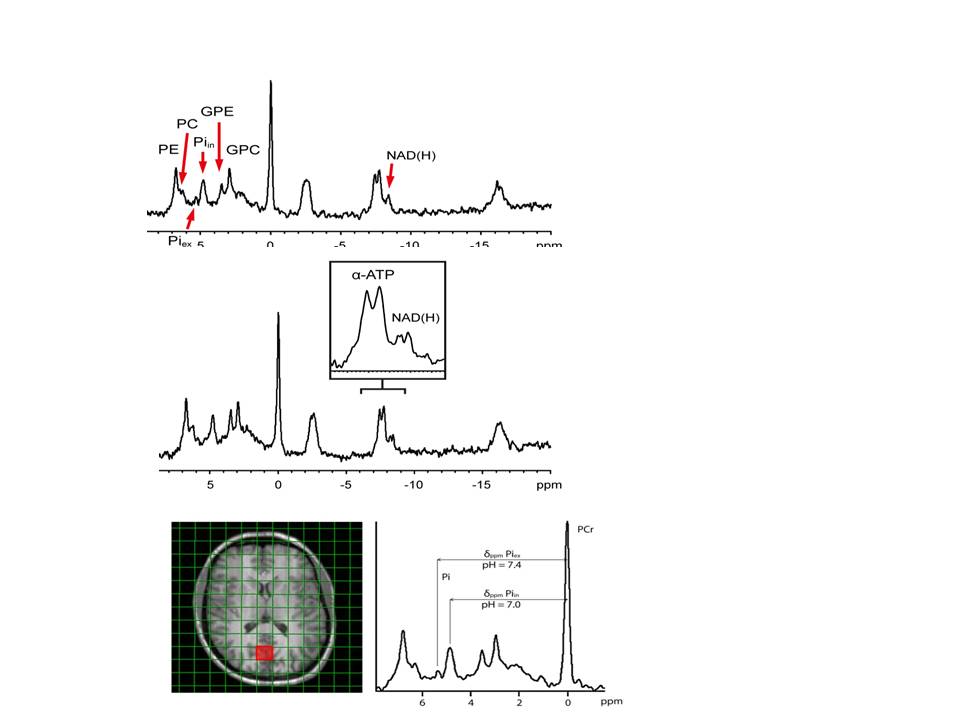
Figure 1. Human brain 31P MR spectra acquired with 3D MRSI with 1H irradiation for NOE (top) from voxel shown in MRI below. Zoom in of spectrum showing additional Pi peak and pH for both Pis (bottom). Phosphoethanolamine (PE), phosphocholine (PC), glycerophosphoethanolamine (GPE) and glycerophosphocholine (GPC). The individual resonances of α‐ATP and NAD(H) are also better resolved (insert).
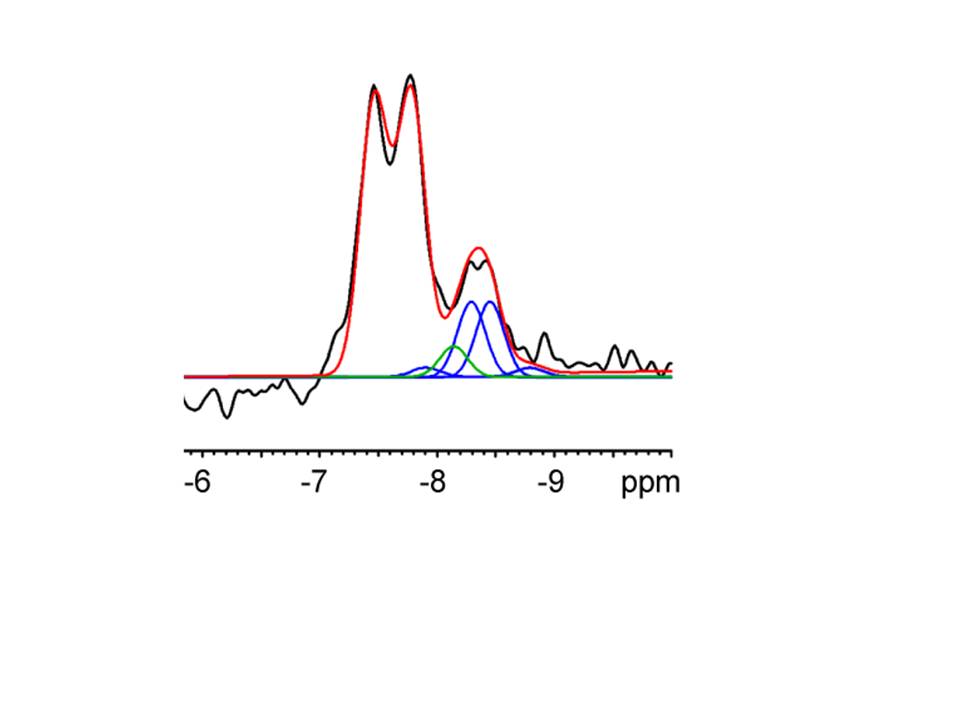
Figure 2. Example of the α‐ATP and NAD(H) region of an in vivo 31P MR spectrum obtained from a voxel in the occipital region of the human brain at 3 T. The spectrum is shown in black. The fitting result is shown in red. The resonances of α‐ATP, NAD+ (blue) and NADH (green) could be spectrally resolved when NOE‐enhancement and 1H‐decoupling were applied and prior knowledge of the NAD+ and NADH resonances was implemented in their fitting.