2959
Metabolic Biomarkers of TERT expression in glioblastoma1John Hopkins University, Baltimore, MD, United States, 2Radiology and Biomedical Imaging, University of California San Francisco, San Francisco, CA, United States, 3Neurological Surgery, University of California San Francisco, San Francisco, CA, United States
Synopsis
Expression of telomerase reverse transcriptase (TERT) is essential for tumor proliferation, including in primary glioblastomas. Inhibiting TERT expression is also a therapeutic strategy for glioblastomas. The goal of this study was to identify non-invasive magnetic resonance spectroscopy (MRS)-detectable metabolic biomarkers of TERT expression in glioblastoma cells. Our studies indicate that TERT expression is linked to redox, as indicated by higher 1H MRS-detectable reduced glutathione, and higher 13C MRS-detectable flux of glucose via the pentose phosphate pathway in TERT-expressing GBM cells. Hyperpolarized [U-13C, U-2H]glucose can monitor TERT expression in GBM cells, and may serve to noninvasively probe TERT expression in glioblastomas.
Introduction
Telomerase reverse transcriptase (TERT) enables most cancer cells, including high-grade primary glioblastomas (GBM) and low-grade oligodendrogliomas (LGOGs), to overcome senescence-associated constraints to their continued proliferation1, 2. TERT expression is, therefore, a biomarker of tumor proliferation. Inhibiting TERT expression is also a therapeutic strategy for gliomas3. Imaging TERT, therefore, has the potential to report on tumor burden and response to therapy. We have previously shown that TERT expression induces magnetic resonance spectroscopy (MRS)-detectable metabolic changes in LGOG cells4. Specifically, we showed that TERT expression increased 1H-MRS detectable levels of reduced glutathione (GSH) and NADPH4. Concomitantly, hyperpolarized [U-13C, U-2H]glucose flux through the pentose phosphate pathway (PPP) which produces NADPH and maintains GSH in the reduced state, was elevated in TERT-expressing LGOG cells4. The goal of this study was to examine whether TERT expression was associated with a similar 1H- and hyperpolarized 13C-MRS-detectable metabolic signature in GBM cells.Methods
Cell models: We examined U251 GBM cells in which TERT expression was reduced via CRISPR/Cas9-mediated known-down of the transcription factor GABPB1L as described previously3 (henceforth called U251TERT KD). An isogenic U251 CRISPR control clone (U251CONTROL) was also examined. TERT expression was assessed via quantitative RT-PCR for TERT mRNA as described previously3.1H-MRS: Metabolites were extracted from cells using dual-phase extraction5 (methanol:chloroform:water=1:1:1). 1H-MRS of aqueous fractions was obtained using a Bruker 500MHz spectrometer5.
13C MRS-based metabolic flux analysis: Cells were cultured in media wherein 50% of the glucose had been replaced with [2-13C]glucose for 1.5x doubling time prior to extraction. Thermally polarized 13C MRS was subsequently performed and proton-decoupled 13C MRS spectra acquired on an 11.7T Bruker spectrometer (30° flip angle, 3 s relaxation delay, 2048 acquisitions)5.
Hyperpolarized 13C MRS of live cells: Hyperpolarized [U-13C, U-2H]glucose was prepared as described previously6 and injected into live cells (~8 x 10⁷ cells) placed in a 10 mm NMR tube. Single transient 13C spectra were collected using a Bruker 600MHz spectrometer over a period of 300s using 13° pulses, 40k data points and a spectral width of 20 kHz. Integrals were quantified using Mnova and normalized to maximum hyperpolarized substrate signal and cell number.
Statistical analysis: Results are expressed as mean±SD and statistical significance assessed using an unpaired Student’s t-test (* = p<0.05, *** = p<0.005).
Results
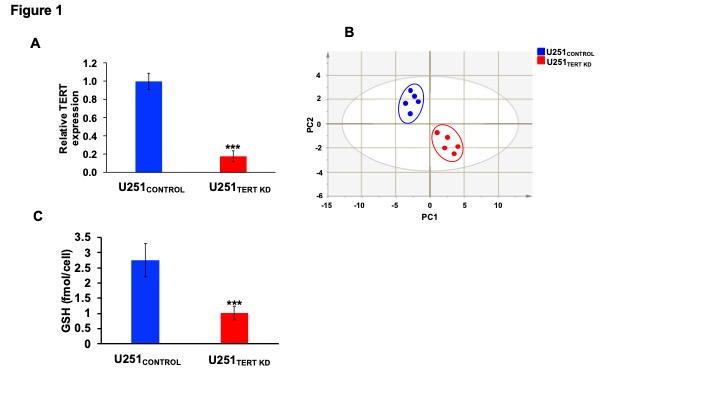
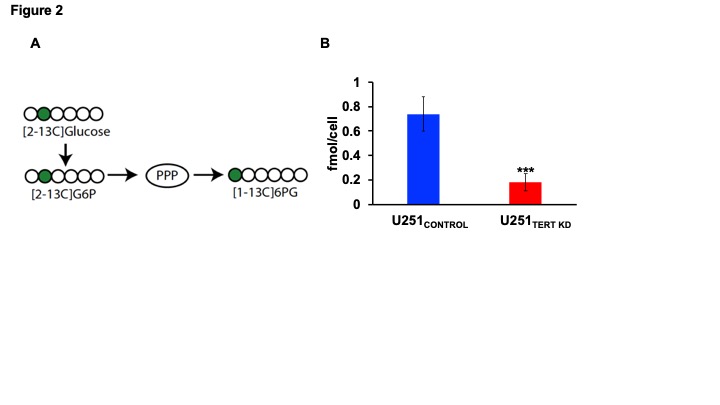
In order to identify metabolic biomarkers of TERT expression in GBM cells, we examined U251TERT KD and U251CONTROL cells (Fig.1A). Unbiased principal component analysis indicated that U251TERT KD and U251CONTROL cells displayed different metabolic profiles (Fig.1B). Specifically, consistent with previous studies in LGOG cells4, TERT-expressing U251CONTROL cells showed elevated GSH levels relative to U251TERT KD cells (Fig.1C).Since glucose flux through the pentose phosphate pathway (PPP) is essential for synthesis of NADPH, which, in turn, maintains GSH in the reduced state7, we probed [2-13C]-glucose metabolism to [1-13C]-6-phosphogluconate (6-PG) via the PPP. [1-13C]-6-PG production was higher in U251CONTROL cells relative to U251TERT KD (Fig.2A-2B).
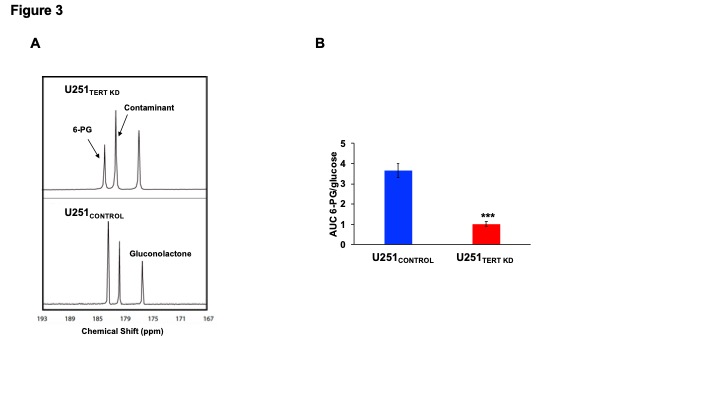
To determine whether hyperpolarized 13C imaging can non-invasively probe these metabolic alterations, we injected cell suspensions with hyperpolarized [U-13C, U-2H]glucose. We detected higher flux of hyperpolarized [U-13C, U-2H]glucose to 6-PG in U251CONTROL cells relative to U251TERT KD (Fig. 3A-3B), consistent with our thermally-polarized 13C MRS results.
Conclusions
This study shows that TERT expression is associated with elevated GSH and concomitantly elevated glucose flux through the pentose phosphate pathway in GBM cells. These results are consistent with our data in LGOG cells4, and importantly they identify hyperpolarized [U-13C, U-2H]glucose metabolism as a non-invasive probe of TERT expression in GBM cells.Acknowledgements
This work was supported by the following grants: NIH R01CA172845, NIH R01CA197254, UCSF Brain Tumor Loglio Collective, NICO, NIH P41EB013598 and NIH P50CA97257.References
1. Hanahan D, Weinberg RA. Cell 144, 646-74 (2011).
2. Bell RJ, et al. Mol Cancer Res 14, 315-23 (2016).
3. Mancini A, et al. Cancer Cell 34, 513-28 e8 (2018).
4. Viswanath P, et al. ISMRM 2019 Annual Meeting, Montreal, Canada, (2019).
5. Viswanath P, et al.Cancer Res 78, 2290–304 (2018).
6. Rodrigues TB, et al. Nat Med 20, 93-7 (2014).
7. Stincone A, et al. Biol Rev Camb Philos Soc 90, 927-63 (2015).
Figures