2958
Detection of 2-Hydroxyglutarate using JPRESS Magnetic Resonance Spectroscopy1National Institute of Mental Health, Bethesda, MD, United States
Synopsis
A J-resolved PRESS (JPRESS) technique is proposed for detecting 2-hydroxyglutarate (2HG) in IDH mutant glioma patients at 3T. Spin density simulations and phantom experiments show that the spectral overlap between 2HG and glutamate at ~2.3 ppm is substantially reduced using the one-dimensional cross-sections at J = 0 and J = 7.5 Hz. These two cross-sections can be combined to quantify the 2HG concentration.
INTRUDUCTION
A noninvasive and accurate modality capable of characterizing IDH mutant glioma can help clinical practice in the treatment of patients with this cancer. Different 1H-MRS methods have been explored in the previous 1H-MRS studies of 2-hydroxyglutarate (2HG) such as long TE, two-setp difference editing, and 2-dimensional (2D) techniques. Quantification of 2HG is challenging due to severe spectral overlap among the resonance lines of the target 2HG and other metabolites which include glutamate (Glu), glutamine (Gln), gamma-aminobutyric acid (GABA), and N-acetylaspartylglutamate (NAAG). Of them, the overlap with Glu is particularly detrimental to accurate measurement of 2HG at 3T because the intensity of Glu resonance signal can be much higher than that of 2HG. In this abstract, we use numerical simulations and phantom experiments to demonstrate that the overlap between 2HG and Glu can be substantially reduced by one-dimensional JPRESS spectroscopy.METHODS
The one-dimensional JPRESS method is compared here with the long TE method (1). JPRESS is essentially a 2D acquisition method, with the cross-section at J = 0 Hz also known as TE-averaged spectroscopy (2). Recently it was suggested that the two cross-sections at J = 0 and J = 7.5 Hz can be fitted together for improving spectral quantification (3). Here, we demonstrate that 2HG and Glu can be well differentiated in both J = 0 and J = 7.5 Hz cross-sections. Our simulations used RF pulses and pulse sequence timing parameters from the actual experiment (4). Phantom data were acquired on a GE 3T scanner using both long TE (TE = 97 ms) PRESS and JPRESS methods. The phantom contains three chemical compounds: [2HG] = 5 mM, [Glu] = 2.5 mM, and [NAA] = 2.5mM. The echo time of JPRESS started at 35 ms, with echo spacing = 6 ms and echo number = 32. The number of excitations was 256 for both long TE and JPRESS data acquisitions. The voxel size was 2.5 cm3.RESULTS and DISCUSSION
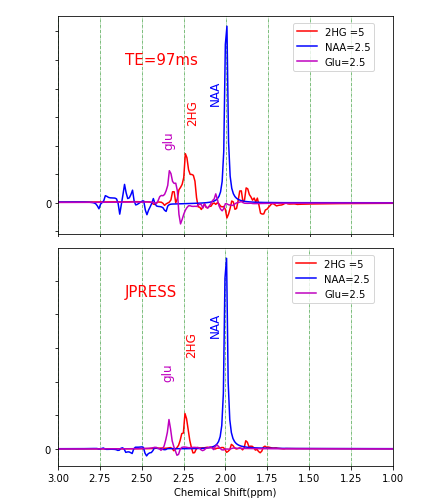
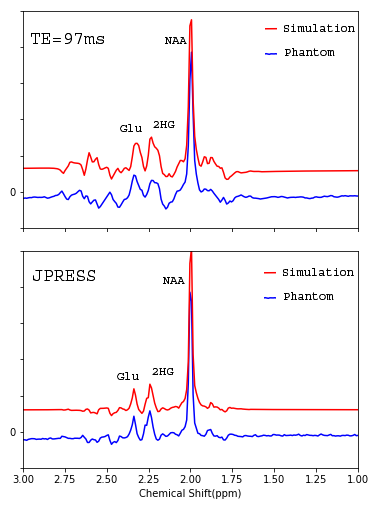
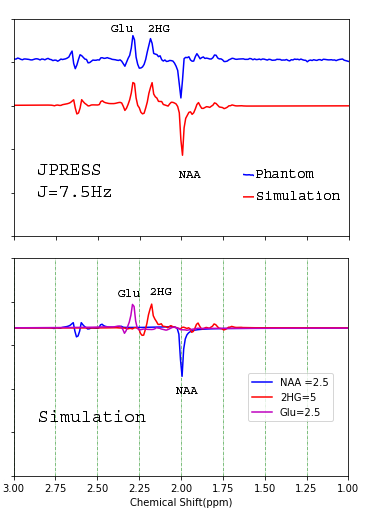
Fig. 1 shows the simulated spectra of individual component NAA (blue), 2HG (red), and Glu(purple) for the long TE (97ms) (upper panel) and one-dimensional JPRESS (J = 0 Hz) methods (lower panel). The concentrations of 2HG, NAA, Glu were set to 5 mM, 2.5 mM, and 2.5 mM, respectively. In the long TE spectra, partial overlap between 2HG and Glu around 2.3 ppm is still significant. Because of the negative signal from Glu this overlap leads to 2HG signal reduction. For comparison, overlap between 2HG and Glu is substantially reduced in the J = 0 Hz cross-section of JPRESS. Fig. 2 shows the phantom results of the long TE (TE= 97ms) (upper panel) and JPRESS (J =0 Hz) methods (lower panel). The simulated and experimental spectra are displayed in blue and red lines, respectively. The intensities of the target 2HG signal at ~2.3ppm are comparable for TE = 97 ms and the one-dimensional JPRESS at J = 0 Hz with the signals of 2HG and Glu clearly separated in the latter. It is noticed that the cancelation of the 2HG signal by overlapping with the negative portion of the Glu signal becomes more severe when the Glu concentration is higher. Fig. 3 shows the JPRESS section at J = 7.5 Hz. The upper panel is the phantom spectrum (blue line) along with the simulated spectrum (red line). The simulated individual spectra of NAA, 2HG, and Glu are in the lower panel, showing that the 2HG peak is clearly resolved as well with its amplitude similar to that in the J = 0 Hz cross-section (the two cross-sections used the same scaling). Therefore, 2HG concentration can be better quantified by fitting the two cross-sections simultaneously.CONCLUSION
Our simulation and phantom experiments have shown that JPRESS is a promising method for 2HG detection in patients with IDH mutant gliomas. Using the one-dimensional JPRESS technique2HG is well differentiated from Glu. In vivo application of this new approach to detecting 2HG is currently in progress.Acknowledgements
No acknowledgement found.References
1.Choi C, Ganji SK, DeBerardinis RJ, Hatanpaa KJ, Rakheja D, Kovacs Z, et al. 2-hydroxyglutarate detection by magnetic resonance spectroscopy in IDH-mutated patients with gliomas. Nat Med. 2012;18:624–629.
2. Hurd R, Sailasuta N, Srinivasan R, Vigneron DB, Pelletier D, Nelson SJ. Measurement of brain glutamate using TE-averaged PRESS at 3T, Magn. Reson. Med 2004;51:435-440.
3. Zhang Y, Shen J. Simultaneous quantification of glutamate and glutamine by J-modulated spectroscopy at 3 Tesla, Magn. Reson. Med 2016;76:725-732.
4. Zhang Y, An L, Shen J. Fast computation of full density matrix of multispin systems for spatially localized magnetic resonance spectroscopy. Med Phys 2017;44:4169-4178.
Figures