2957
A metabolomics approach for phenotyping IDH mutant gliomas using 1 and 2D NMR spectroscopy
Thomas Leather Leather1, Marie Phalen2, Khaja Sayed3, Nitika Rathi3, Michael Jenkinson4, Kumar Das4, and Harish Leather Poptani1
1University of Liverpool, Liverpool, United Kingdom, 2NMR Centre, University of Liverpool, Liverpool, United Kingdom, 3Neuropathology, Walton Centre NHS Foundation Trust, Liverpool, United Kingdom, 4Walton Centre NHS Foundation Trust, Liverpool, United Kingdom
1University of Liverpool, Liverpool, United Kingdom, 2NMR Centre, University of Liverpool, Liverpool, United Kingdom, 3Neuropathology, Walton Centre NHS Foundation Trust, Liverpool, United Kingdom, 4Walton Centre NHS Foundation Trust, Liverpool, United Kingdom
Synopsis
The world health organisation has recognised mutations in the IDH1/2 gene as integral in diagnosis and prognostication of gliomas. The mutation facilitates production of the oncometabolite 2-hydroxygluarate (2-HG). The direct mechanisms behind the production and accumulation of 2-HG are well known, however we are yet to understand its effect on prognosis. Although the focus of in vivo studies has been on detection of the 2-HG peak, it is often impeded by spectral overcrowding. Here we used an NMR metabolomics approach to assess metabolome-wide alterations in the presence of the mutation to seek additionally detectable changes in metabolites in these tumours.
Introduction
Gliomas account for 80% of all malignant intracranial tumours, and in 2016 the WHO issued a list of mutations that are deterministic of both diagnosis and prognosis1. Mutations in the IDH1/2 gene confer a gain-of-function neomorphic enzymatic activity, facilitating the intracellular production and accumulation of the oncometabolite 2-HG8–11. Although the presence of the metabolite has been suggested to contribute towards malignant progression, the mechanisms by which this process occurs are widely debated. Furthermore, the means by which the build-up of 2-HG contributes to enhanced prognosis whilst at the same time driving malignant progression remain to be elucidated12. In addition to understanding the pathophysiology of IDH mutation in glioma, non-invasive detection of 2-HG by MRS has been suggested as a putative biomarker, however the 2-HG peaks are overlapped by a number of metabolites found in abundance in the brain, often making it difficult to resolve the spectra4–7,13. Here we have used a multi-dimensional metabolomics approach to assess for metabolome-wide alterations in order to further understand the pathophysiology of the mutation, and examine alternative metabolic biomarkers, that could characterise IDH.Methods
Tumour samples from 22 patients were collected during surgical resection and snap frozen in liquid nitrogen. Metabolites were extracted using a solution of 50% acetonitrile and 50% H2O and sonication, followed by centrifugation. 1D 1H-NMR spectra were acquired using a CPMG pulse sequence and 2D spectra were acquired using a 1H-13C HSQC sequence on a Bruker 700MHz spectrometer. 1D spectra were individually fitted to a custom library in Chenomx NMR suite, and spectral fittings were manually checked and adjusted. 2D spectra were aligned and peaks identified in CCPN NMR software14. Metabolomic analysis was carried out using metaboanalyst software. Spectra were normalised to the sum of the total integral of the spectrum (combining all peaks) and scaled using the pareto method15. The group consisted of IDH1/2 mutation and wild type tumours. Wilcoxon rank test was carried out to identify metabolites that were significantly altered between IDH1/2 mutation and wild type tumours.Results
A significant difference in the concentrations of 5 metabolites including 2-HG (p<0.0005), myo-inositol (p<0.0005), choline (p<0.005), alanine (p<0.005) and 3-hydroxybutyrate (p<0.05) using 1D NMR was observed in IDH mutant tumours. A scatter plot of the calculated p values can be seen in figure 1. In addition, the 2D analysis highlighted a total of 24 metabolites that were significantly altered between IDH Mut and WT gliomas, including myo-inositol (p<0.0005), choline(p<0.0005), alanine(p<0.0005) and 2-HG (p<0.005) (figure 2) that were significantly different in the 1D analysis as well.Discussion
In agreement with the previous findings, 2-HG was significantly elevated in the IDH Mut groups16,17. In addition, we also observed significant differences in the concentrations of myo-inositol, choline, alanine and 3-hydroxybutyrate from 1D NMR. These alterations suggest downstream effects of IDH mutation on the metabolome. Moreover, our 2D findings complement the 1D results and provide additional metabolic alterations that have been observed in the presence of the mutation, whereby 22 metabolites were found to be significantly altered. To our knowledge this is the first reported case of using quantitative 2D NMR metabolomics to address the issue of a metabolome-wide phenotype in the presence of an IDH mutation. Utilising heteronuclear 2D NMR allows us to unequivocally identify the coupled metabolites, which is generally a problem in the over-crowded 1D spectrum. Both metabolomics approaches have highlighted an increase in myo-inositol concentration in the IDH Mut tumours when compared to the WT (p<0.0005) (figures 3 and 4). myo-inositol is involved in osmoregulation and has been shown to reverse the effects of hypoxia by increased oxygen load18,19. This may be considered as coherent with the prognostic advantage conferred by the presence of IDH mutation, as it is known that hypoxia is a hallmark of cancer and reversal of the hypoxic phenotype can impede tumour growth20. Further investigation is warranted to determine the mechanisms by which mutations in the IDH1/2 gene facilitates the a increase in myo-inositol. In addition to the decrease in myo-inositol, we also observed a significant decrease in alanine (p<0.005). This observation is coherent with the implementation of the mutant IDH1/2 enzyme in the production of 2-HG. 2-HG is product of reduction of alpha-ketoglutarate which enters the tricarboxylic acid cycle via a reversible conversion from glutamate21. The production of alpha-ketoglutarate from glutamate also produces alanine. Depletion of alpha-ketoglutarate may disrupt glutamate homeostasis within the cytoplasm, and therefor impact on the production of alanine.Acknowledgements
No acknowledgement found.References
1. Louis, D. N. et al. The 2016 World Health Organization Classification of Tumors of the Central Nervous System: a summary. Acta Neuropathol. 131, 803–820 (2016). 2. Waitkus, M. S., Diplas, B. H. & Yan, H. Isocitrate dehydrogenase mutations in gliomas. Neuro. Oncol. 18, 16–26 (2016). 3. Losman, J. A. & Kaelin, W. G. What a difference a hydroxyl makes: Mutant IDH, (R)-2-hydroxyglutarate, and cancer. Genes Dev. 27, 836–852 (2013). 4. Berrington, A. et al. Improved localisation for 2-hydroxyglutarate detection at 3T using long-TE semi-LASER. Tomogr. a J. imaging Res. 2, 94–105 (2016). 5. Choi, C. et al. 2-hydroxyglutarate detection by magnetic resonance spectroscopy in IDH-mutated patients with gliomas. Nat. Med. 18, 624–9 (2012). 6. Andronesi, O. C. et al. Detection of 2-Hydroxyglutarate in IDH-Mutated Glioma Patients by In Vivo Spectral-Editing and 2D Correlation Magnetic Resonance Spectroscopy. Sci. Transl. Med. 4, 116ra4-116ra4 (2012). 7. Emir, U. E. et al. Noninvasive quantification of 2-hydroxyglutarate in human gliomas with IDH1 and IDH2 mutations. Cancer Res. 76, 43–49 (2016). 8. Suzuki, H. et al. Mutational landscape and clonal architecture in grade II and III gliomas. Nat. Genet. 47, 458–468 (2015). 9. Yan, H. et al. Mutations in Gliomas. N. Engl. J. Med. 360, 765–773 (2009). 10. Reitman, Z. J. & Yan, H. Isocitrate dehydrogenase 1 and 2 mutations in cancer: Alterations at a crossroads of cellular metabolism. J. Natl. Cancer Inst. 102, 932–941 (2010). 11. Thon, N. et al. IDH1 mutations in grade II astrocytomas are associated with unfavorable progression-free survival and prolonged postrecurrence survival. Cancer 118, 452–460 (2012). 12. Leather, T., Jenkinson, M. D., Das, K. & Poptani, H. Magnetic resonance spectroscopy for detection of 2-hydroxyglutarate as a biomarker for IDH mutation in gliomas. Metabolites 7, (2017). 13. Kim, H., Kim, S., Lee, H. H. & Heo, H. In-Vivo Proton Magnetic Resonance Spectroscopy of 2-Hydroxyglutarate in Isocitrate Dehydrogenase-Mutated Gliomas: A Technical Review for Neuroradiologists. Korean J. Radiol. 17, 620–32 (2016). 14. Chignola, F. et al. The CCPN metabolomics project: A fast protocol for metabolite identification by 2D-NMR. Bioinformatics 27, 885–886 (2011). 15. van den Berg, R. A., Hoefsloot, H. C. J., Westerhuis, J. A., Smilde, A. K. & van der Werf, M. J. Centering, scaling, and transformations: Improving the biological information content of metabolomics data. BMC Genomics 7, 1–15 (2006). 16. Pandey, R., Caflisch, L., Lodi, A., Brenner, A. J. & Tiziani, S. Metabolomic signature of brain cancer. Mol. Carcinog. 56, 2355–2371 (2017). 17. Mörén, L. et al. Metabolomic screening of tumor tissue and serum in glioma patients reveals diagnostic and prognostic information. Metabolites 5, 502–520 (2015). 18. Derbal-Wolfrom, L. et al. Increasing the oxygen load by treatment with myo-inositol trispyrophosphate reduces growth of colon cancer and modulates the intestine homeobox gene Cdx2. Oncogene 32, 4313–4318 (2013). 19. Shamsuddin, A. M. & Yang, G. Y. Inositol hexaphosphate inhibits growth and induces differentiation of pc-3 human prostate cancer cells. Carcinogenesis 16, 1975–1979 (1995). 20. Brahimi-Horn, M. C., Chiche, J. & Pouysségur, J. Hypoxia and cancer. J. Mol. Med. 85, 1301–1307 (2007). 21. Altman, B. J., Stine, Z. E. & Dang, C. V. From Krebs to clinic: Glutamine metabolism to cancer therapy. Nat. Rev. Cancer 16, 619–634 (2016).Figures
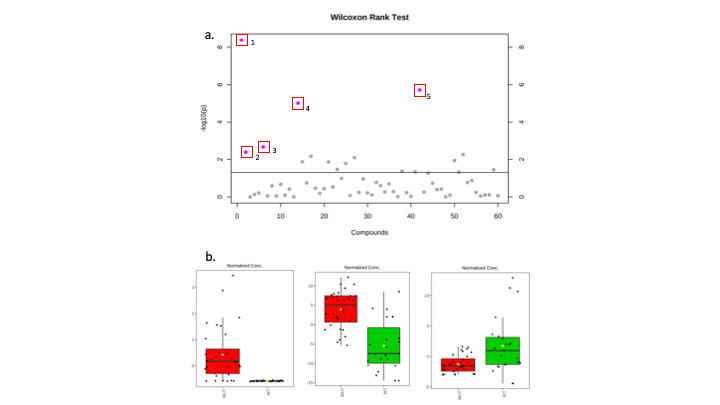
Fig 1. (a) Scatter plot displaying the results of the
Wilcoxon rank test from 1D NMR analysis. 5 Metabolites found to be
significantly altered between IDH Mut and WT. 1) 2-HG. 2) 3-Hydroxybutyrate. 3)
Alanine. 4) Choline. 5) myo-inositol. (b) Box plots to show the
differences in concentration of 2-HG, myo-inositol and alanine when comparing
IDH Mut and WT glioma samples.
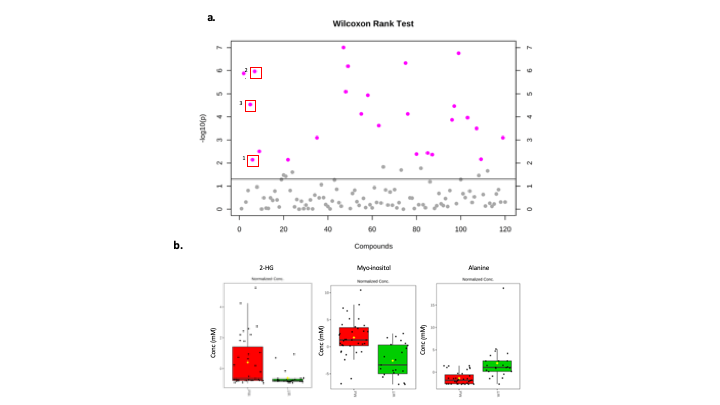
Fig 2. (a) Scatter plot to display the -log10(p) values
from the Wilcoxon rank test from metabolite concentrations calculated from 2D
NMR. A total of 22 metabolites were found to be significantly altered between
IDH Mut and WT. (b) Box plots to show the change in concentration of 2-HG, Myo-inositol and Alanine. These results
from the 2D analysis complement the results generated from the 1D metabolomics.
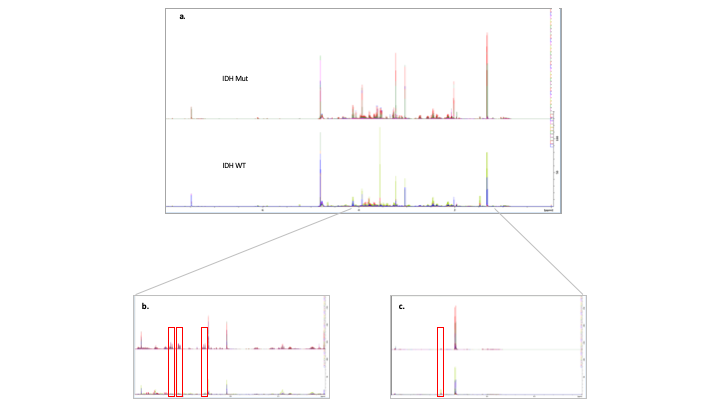
Fig 3. (a) All 1H 1D
spectra from all samples grouped into IDH WT and Mut and overlaid. The spectra
displayed in the top row represent the IDH WT gliomas and the bottom row
represent the Mut gliomas. (b) A close up of a spectrum (2-4 ppm) Mut on
top, WT below. Myo-inositol peaks have been highlighted by red boxes. A clear increases
in peak intensity in the Mut. (c) Close up (0.5-2 ppm) spectrum. Alanine
peak highlighted in red box. A clear decrease in alanine in Mut tumours.
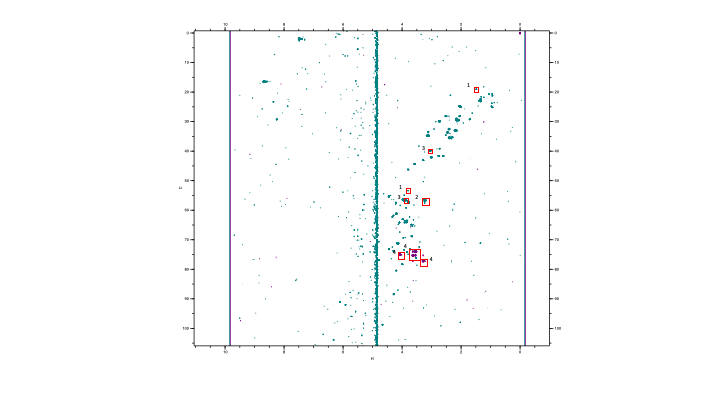
Fig
4. 1H – 13C HSQC spectrum of and IDH Mut glioma
sample (green) with an in-house acquired myo-inositol standard at 3.5 ppm 1H
75 ppm 13C (purple). Concentrations were calculated from contour
intensity levels relative to TSP. (1) Alanine (2) Choline (3) Creatine (4)
Myo-inositol.