2955
Metabolic Characterization of Pre-Surgical Lower Grade Glioma Using Spectroscopic Imaging Optimized for 2-HG Detection
Marisa Lafontaine1, Adam Autry1, Llewellyn Jalbert1, Elizabeth Phillips1, Susan Chang2, and Yan Li1
1Radiology and Biomedical Imaging, UCSF, San Francisco, CA, United States, 2Neurological Surgery, UCSF, San Francisco, CA, United States
1Radiology and Biomedical Imaging, UCSF, San Francisco, CA, United States, 2Neurological Surgery, UCSF, San Francisco, CA, United States
Synopsis
2-HG optimized MR spectroscopic imaging showed 2HG was detected in 37 out of 40 IDH1+ patients. Although it was not significantly different between IDH+ and IDH- gliomas, significant correlation was found with progression free survival in newly-diagnosed grade II and grade III gliomas.
Introduction
Lower grade gliomas (LGG) constitute a family of brain tumors that are classified according to a malignancy as either Grade II or Grade III, and display heterogenous clinical outcomes based on their molecular and histopathological properties. Mutations in isocitrate dehydrogenase (IDH1/2) genes is both a predictive and prognostic biomarker in this population, which can be non-invasively evaluated through the measurement of 2-hydroxyglutarate (2HG) production1. Spectroscopic techniques developed for 2HG detection2 utilize the optimal echo time to seperate its resonance from that of surrounding metabolites. In this study, we sought to characterize metabolic features in presurical LGG and to evaluate the relationship between 2HG and other metabolites to pathological parameters derived from the image-guided tissue samples removed during patient surgery.Methods
A total of 47 patients were recruited prior to surgical resection for suspected or previously diagnosed glioma (Figure 1). PRESS 3D MRSI (TE 97ms, TR= 1.5s, matrix=18x18x16, and flyback in S/I with a total acquisition time of 8:12 minutes) was added to the standard pre-surgical brain tumor protocol acquired at a 3T GE scanner. During surgery, one to four image guided biopsy targets were acquired and the location of the biopsy sample recorded using the Brainlab surgical navigation package. A single pathologist graded each of the tissue samples for proliferative index, IDH mutation and a few other relevant parameters. MRSI data were reconstructed using in-house software and quantified with LCModel for the 3D data. Metabolite levels were expressed with relative to total creatine (Cr). Analysis was preformed on the data quantified by LCModel with Cramer-Rao lower bounds (CRLB) lower than 10% for choline, Cr and NAA; 20% for glutamate, glutamine, myo-inositol (ml), glycine and GABA; and 25% for 2HG. To correlate metabolic parameters with tissue hisopathological assays the spectra were reconstructed and quantified at the center of the biopsy samples (Figure 2). Regions of interest included the T2 hyperintense lesion (T2L) and normal appearing white matter (NAWM). Progression free survival (PFS) status was recorded and collected. Rate of 2HG detection using MRSI was calculated within the patients. Wilcoxon ranksum tests were used to compare the differences in metabolic parameters between patient subgroups. Cox proportional hazards models were used to evaluate the influence of metabolic parameters on PFS. Wilcoxon signed rank tests were used to compare the difference between the T2L and the NAWM. Pearson correlations with a Bonferoni correction were run on the biopsy sample data between pathology and metabolites as well as Kendall-Tau rank correlations.Results & Discussion
The patient population was predominantly IDH1+ as measured by histopathology with 40 IDH+ and 7 IDH- (Figure 1). Levels of 2HG were quantifiable in 37 out of the 40 IDH1+ patients while 3 out of the 7 IDH1- patients also showed quantifiable data. Detection rate is 92.5%. Interestingly, only the ratios GABA/Cr in the T2L were significantly different between the IDH1+ and IDH1- patients (p=0.0006).Figure 3 illustrates the metabolite ratios in the IDH+ newly diagnosed LGG. The T2L lesions had significantly higher (2HG+GABA)/Cr (p=0.001), lower glutamate/Cr (p<0.001) and higher glutamine/Cr (p<0.001). Within the T2L, the grade II patients displayed significantly different ml/choline (p=0.021; II vs. III: 3.073±0.603 vs 2.534±0.510) andml+glycine/choline (p=0.011, 3.496±0.713 vs 2.895±0.610) compared to grade III. Significantly difference was found on ml/total choline (p=0.022) between grade II astrocytoma ands oligodendroglioma in the newly diagnosed grade II population, which was also seen in the total patient population (p=0.037). The median PFS was 1041 days in the newly diagnosed LGG with 19 patients censored. ml+Glycine (mIG)/Cr (p=0.040, HR=6.039) and 2HG/Cr (p=0.026, HR=4.593) were significant indicators of PFS. The volume of the T2L was correlated with PFS in all subjects (p=0.034) but was not a significant predictor in newly-daignosed low grader glioma.112 biopsy samples were analyzed from 41 patients. In our Kendall-Tau rank correlations of the spectra at the location of the biopsy 2HG was significantly associated with ml (mean Tau 0.6, SD of Tau 0.06 and Bonferoni corrected p-value of 0.01). Total choline were significantly correlated with 2HG using both Pearson (mean Tau 0.8, SD of Tau 0.09 and Bonferoni corrected p-value <0.0001) and Kendall-Tau rank correlation analyses (mean Tau 0.65, SD of Tau 0.07 and Bonferoni corrected p-value 0.003). However, no significances for the metabolites with the pathology parameters were found.Conclusion
The non-invasive detection of IDH mutation can contribute valuable information to LGG patient care. Quantification of 2-HG specific MRSI from pre-surgical patients analyzed with LCModel demonstrate that 2HG could be detected. Since we only included 2HG with CRLB<25% in the analysis, the significant difference between the T2L and NAWM on (2HG+GABA)/Cr could tell the appearances of 2HG within the lesions in IDH+ gliomas. Consistent with previous finding, metabolic reprogramming (decreased glu and increased glutamine) were observed in IDH+ gliomas. The in vivo metabolic correlation between 2HG and choline was also consistent with our previous finding on ex vivo HRMAS from the image-guided tissues. The significance of 2HG/Cr with PFS highlights suggests that it can an important clinical marker for a better patient prognosis.Acknowledgements
No acknowledgement found.References
1. Elkhaled, A, Jalbert, L et al. Science translational medicine 4.116 (2012): 116ra5-116ra5.
2. Choi, Changho, et al. NMR in Biomedicine26.10 (2013): 1242-1250.
Figures
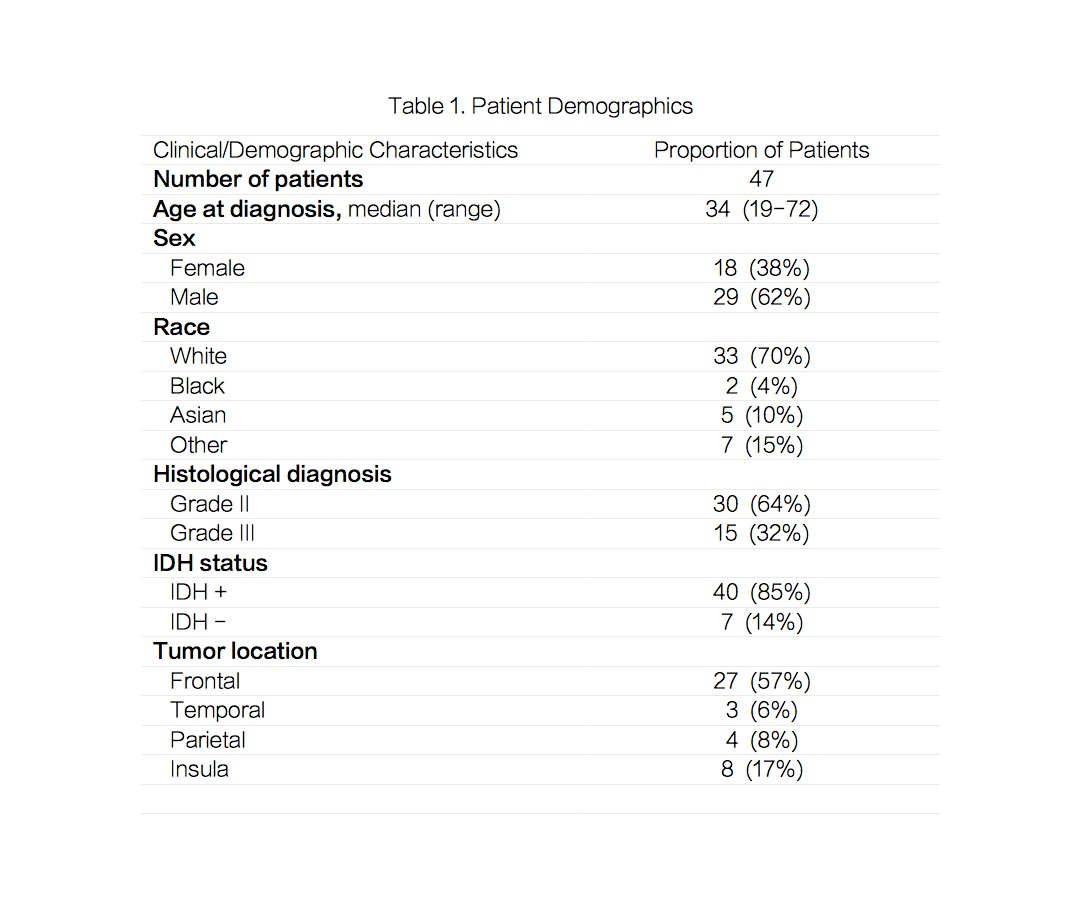
Patient Population Summary Table
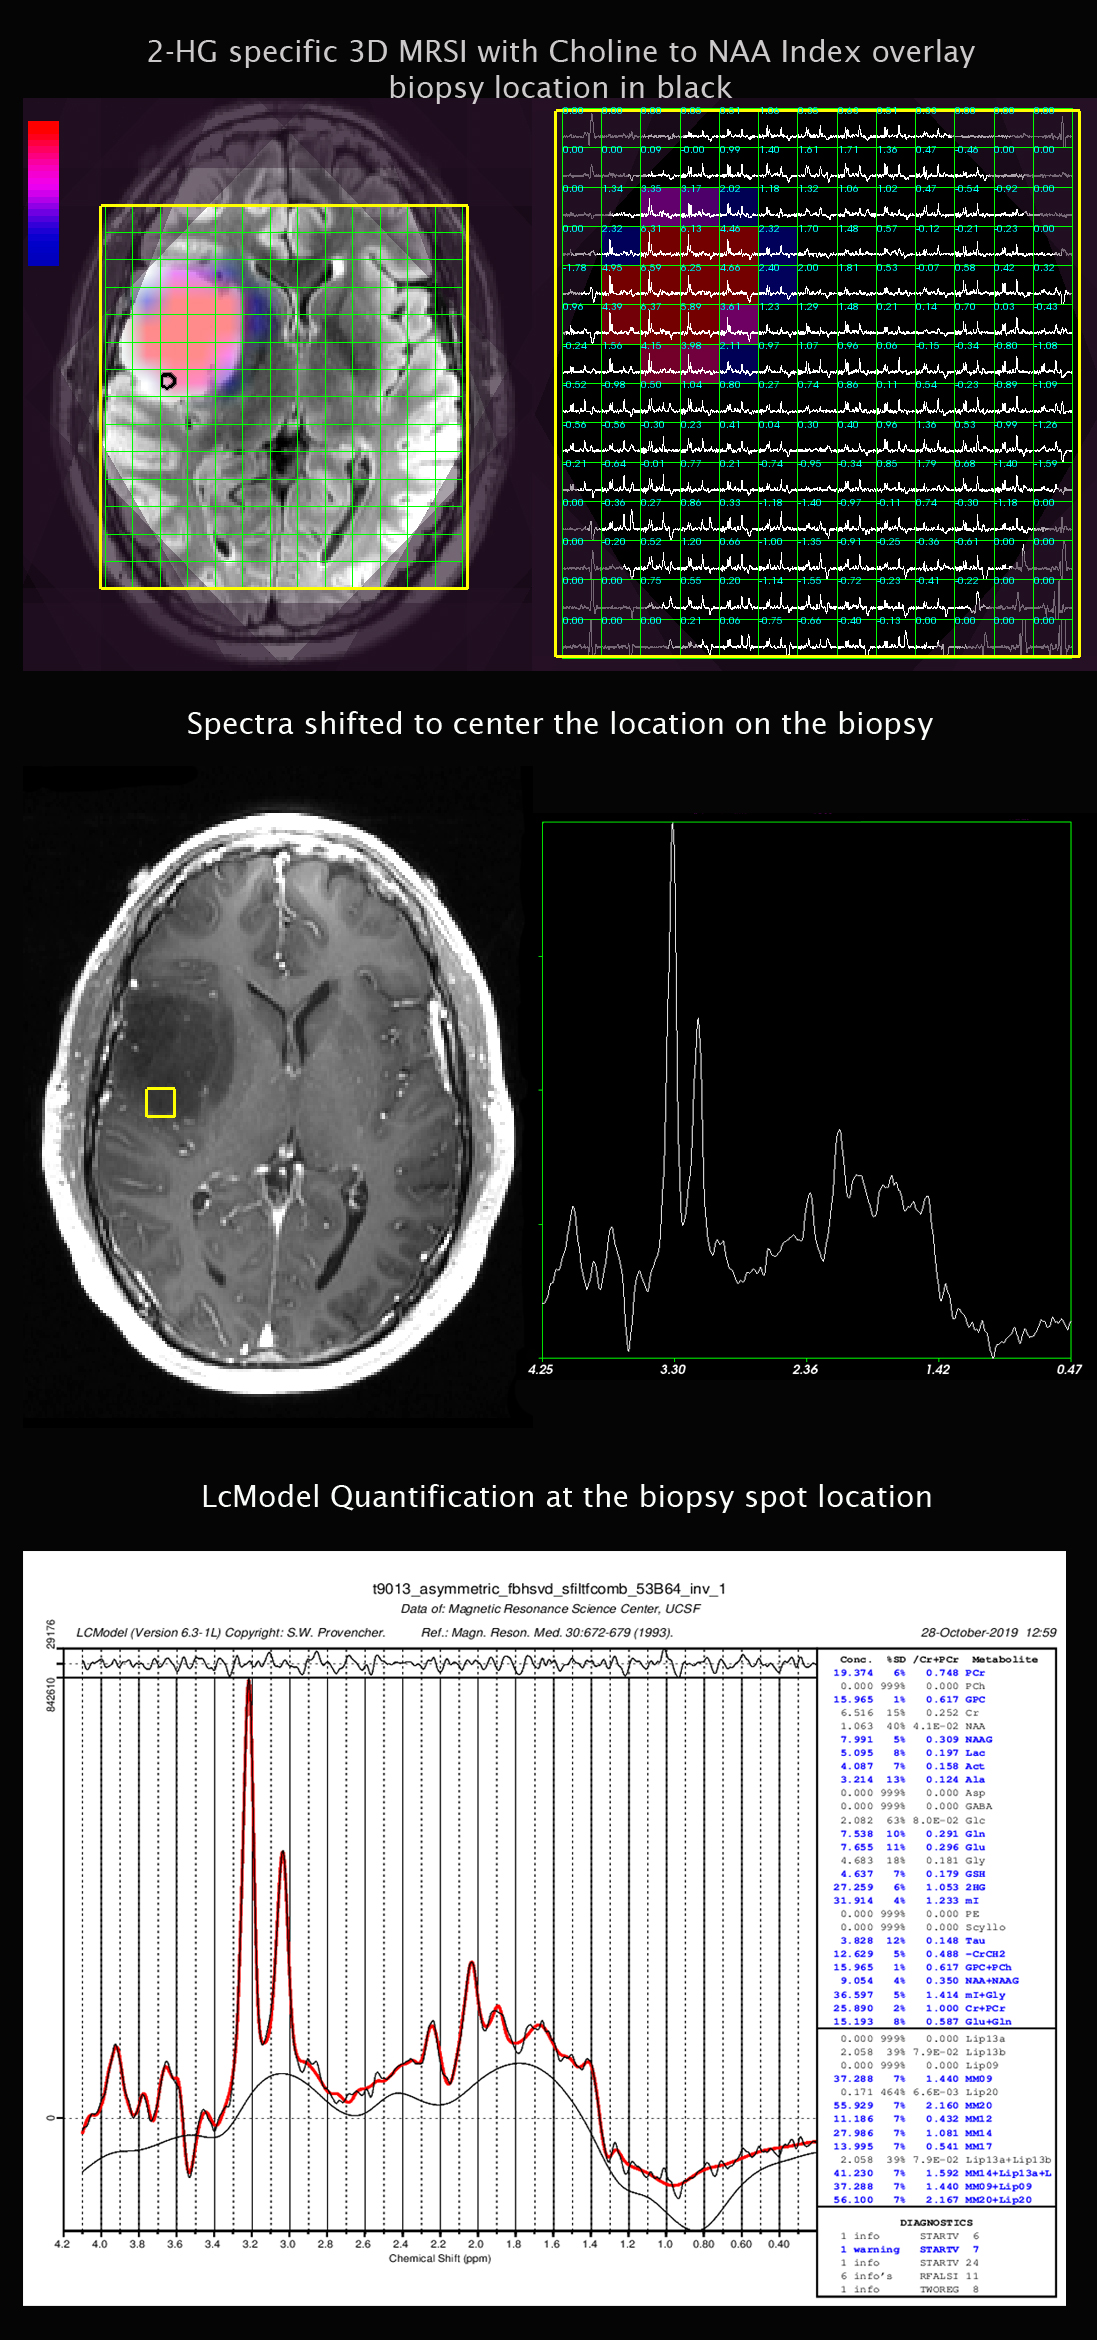
MRSI example and LCmodel biopsy detail
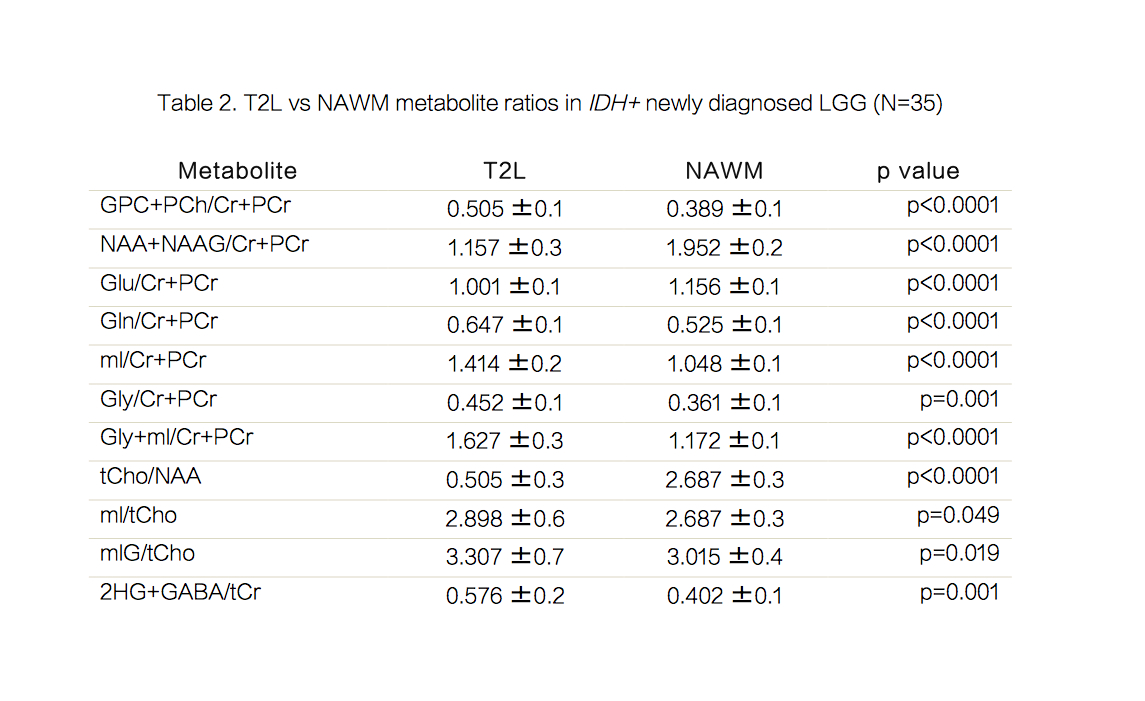
Table
of metabolite ratios in IDH+ newly
diagnosed LGG