2954
Lactate detection in breast cancer using optimised multiple quantum coherence MR spectroscopy and effective phased-array signal combination1Institute of Medical Sciences, School of Medicine, University of Aberdeen, Aberdeen, United Kingdom, 2Breast Unit, Aberdeen Royal Infirmary, Aberdeen, United Kingdom, 3Department of Clinical Radiology, Aberdeen Royal Infirmary, Aberdeen, United Kingdom, 4Department of Radiology, Royal Marsden Hospital, London, United Kingdom
Synopsis
Lactate, as a central metabolite in aerobic glycolysis, is associated with cancer aggressiveness and disease progression. The non-invasive detection of lactate in breast cancer requires the minimal contamination signal from high amplitude lipid signal and maximal amplitude lactate signal, demanding the optimisation of coherent pathway encoding gradients and sequence timing in multiple quantum coherence (MQC) MRS. Furthermore, phased-array coils allows additional signal gain through appropriate combination algorithms. Adaptively optimised combination (AOC) coupled with the optimal MQC gradient at 50 ms mT m-1 provided more than 40% improvement of lactate SNR with complete lipid suppression.
Introduction
Aerobic glycolysis, a central metabolic feature of tumour, leads to elevated lactate production, setting lactate as a key marker in breast cancer1. The non-invasive measurement of lactate in breast tumours using magnetic resonance spectroscopy (MRS) is challenging due to the dominant co-resonance lipid signal. Multiple quantum coherence (MQC), although suppresses lipid signals effectively, loses 50% of the target signal2. Hence accurate measurement of lactate depends on optimal acquisition configuration to maximise signal to noise ratio (SNR) with minimal lipid contamination and additional SNR boost using phased-array coils. We therefore set out to systematically examine the role of MQC gradients and sequence timing on SNR and residual contamination signal, with subsequent signal combination algorithms3-6 evaluated.Methods
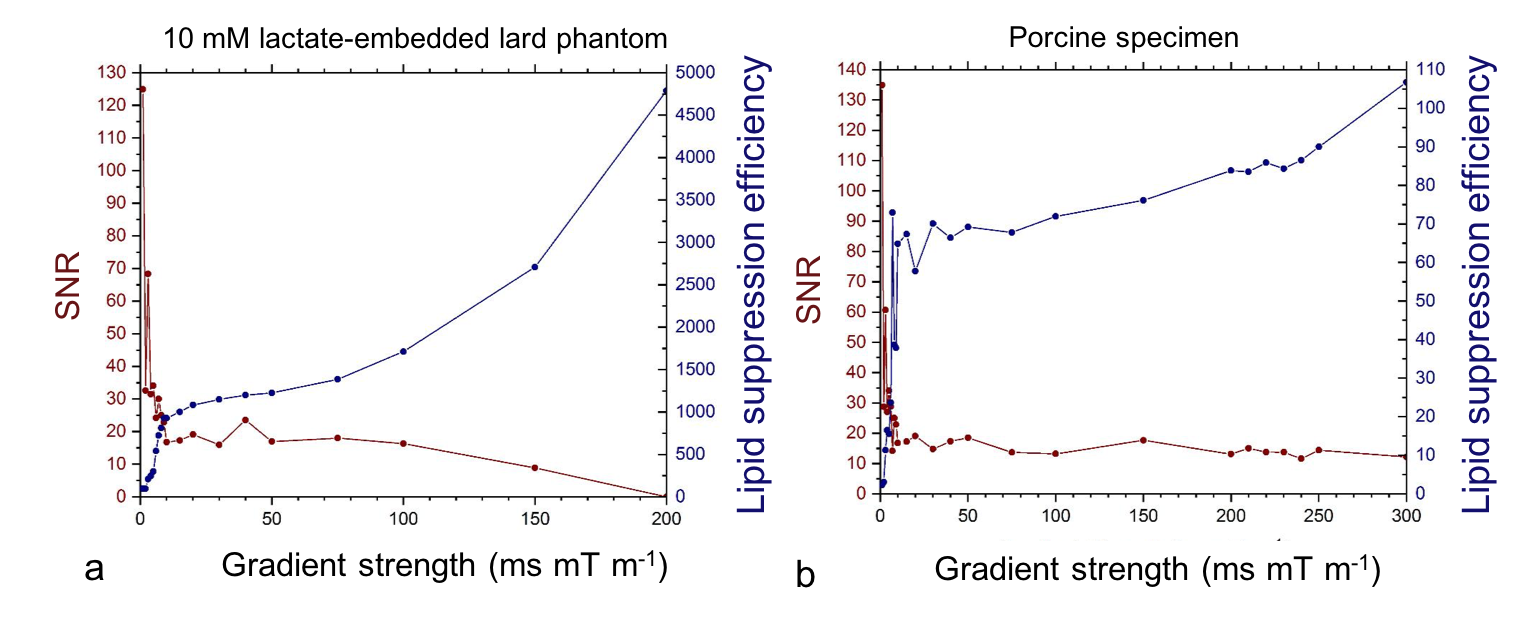
We conducted MQC optimisation in phantoms and evaluated phased-array combination algorithms on lactate spectra acquired from ex vivo breast tumours and patients.Phantoms and Patients: MQC acquisition was optimised using a 10 mM lactate-embedded lard phantom and a porcine specimen in order to select the optimal MQC gradient. MQC gradients were systematically varied from 1 - 300 ms mT m-1 (area of the first encoding gradient). Subsequently, TR optimisation was conducted using 10 mM and 25 mM lactate phantoms, a 10 mM lactate-embedded lard phantom, and a porcine specimen. The lactate spectra was acquired using MQC sequence with the optimised encoding gradient and varying TR of 1000 ms, 1250 ms, 1500ms, 1750 ms, 2000 ms and 2250 ms. The optimisation experiments were repeated five times. Sixteen breast tumours specimens (invasive carcinoma, 9 grade II and 7 grade III) freshly excised from patients (mean age, 59 years; age range, 39-78 years), and two female patients (age 49 and 58 years) with invasive carcinoma, grade III were enrolled in the study. The study was approved by the NHS Research Ethics Committee, and written informed consent was obtained from each patient prior to the study.
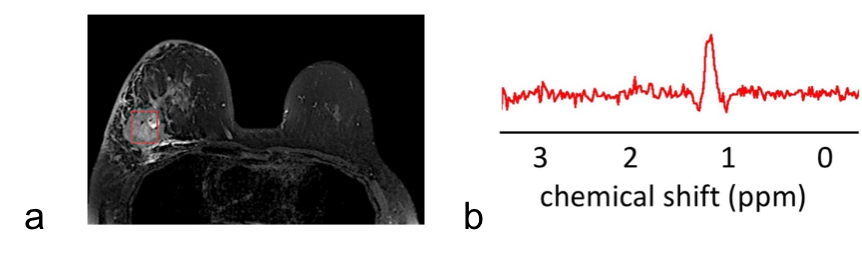
Data Acquisition: Single voxel MRS data were acquired on a 3 T MRI scanner (Achieva TX, Philips Healthcare, Best, Netherlands) using a 32-phased array coil for phantoms and ex vivo specimens and a 16-phased array breast coil for patients. Lactate spectra were acquired using single voxel MQC PRESS sequence2 with repetition time (TR) of 1250 ms, echo time (TE) of 144 ms, spectral editing frequency at 4.1 ppm, 1024 data points. A reference spectrum without water suppression was acquired using single voxel PRESS sequence with TR/TE of 1250/144 ms. For the phantom study, an isotropic voxel of 3 cm was positioned to contain 50% lactate and 50% lard in lard phantom, and 50% muscle and 50% adipose tissue in porcine specimen. The patient study was conducted with the optimised MQC sequenceand lactate and reference spectra were collected from a single voxel snug-fit to the tumour.
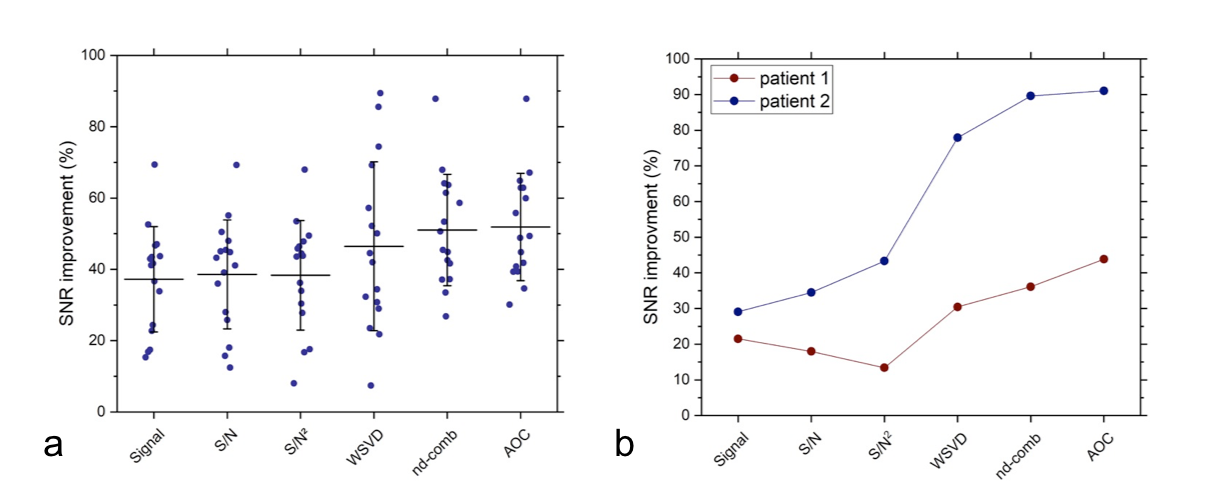
Data Processing: All the algorithms were developed in MATLAB (MathWorks, Natick, MA, USA). Lipid suppression efficiency and lactate SNR were evaluated to determine the optimal gradient configuration. Lactate SNR per unit time (SNR/√TR) was evaluated to determine the optimal TR. Lipid suppression efficiency was quantified as the ratio of the area under the spectral peak within the range of [1.0, 1.6] ppm in the reference spectrum against lactate spectrum. SNR was calculated as the lactate spectral peak height divided by the standard deviation of the real part of the spectrum within the range of [-1, -2] ppm7. Time domain data from the optimised MQC sequence were combined using the algorithms of adaptively optimised combination (AOC)3, noise decorrelated combination (nd-comb)4, whitened singular value decomposition (WSVD)5, S/N2, S/N, Signal, and Equal Weighting6. The amplitude and phase shift were determined from the dominant peak (either water at 4.7 ppm or lipid at 1.3 ppm) in the reference spectrum. The SNR improvement of lactate peak was used to evaluate the combination algorithms and was defined as percentage increase of SNR referenced to the SNR derived from Equal Weighting.
Results
In the lard phantom and porcine specimen, the lipid suppression efficiency reached superior level at MQC gradients greater than 10 ms mT m-1 (Figure 1). The optimal MQC gradient at 50 ms mT m-1 provided maximal retention of lactate SNR with complete suppression of lipid signals in both the lard phantom and porcine specimen (Figure 1). There were no significant differences in SNR per unit time in phantoms at different TR with highest SNR per unit time shown at TR of 1250 and 1500 ms (Table 1). In porcine specimen, significantly higher SNR per unit time was found at TR lower than 2000 ms. AOC yielded the highest SNR improvement with a gain of 49 ± 18% in excised tumours (Table 2, Figure 2a). In the two patients, AOC improved the SNR by 44% and 91% respectively following by nd-comb and WSVD (Table 2, Figure. 2b, Figure 3).Discussion
MQC MRS showed superior suppression of lipid contamination signal with the optimal gradient identified at 50 ms mT m-1 and optimal TR of 1250 or 1500 ms, to preserve maximal lactate signal. AOC algorithm provided more than 40% SNR improvement in specimens and patients on the optimised MQC configuration.Conclusion
An optimised MQC MRS coupled with AOC significantly improves lactate measurement in patients with breast cancer.Acknowledgements
The authors would like to thank Dr Matthew Clemence (Philips Healthcare Clinical Science, UK) for clinical scientist support, Ms Bolanle Brikinns, Ms Louisa Pirie, Ms Linda Lett, and Ms Kate Shaw for patient recruitment support, Ms Dawn Younie for logistic support, Mr Roger Bourne and Ms Mairi Fuller for providing access to the patients as well as Mrs Beverly MacLennan, Mrs Nichola Crouch, Mr Mike Hendry, and Ms Laura Reid for radiographer support.References
1. Aboagye EO, Bhujwalla ZM, He Q, research JGR, 1998. Evaluation of Lactate as a 1H Nuclear Magnetic Resonance Spectroscopy Index for Noninvasive Prediction and Early Detection of Tumor Response to Radiation therapy in EMT6 tumours. Radiat Res. 1998;150(1):38.
2. He QH, Shungu DC, Vanzijl PCM, Bhujwalla ZM, Glickson JD. Single-Scan in Vivo Lactate Editing with Complete Lipid and Water Suppression by Selective Multiple-Quantum-Coherence Transfer (Sel-MQC) with Application to Tumors. Journal of Magnetic Resonance, Series B. 1995;106(3):203-211.
3. Fang L, Wu M, Ke H, Kumar A, Yang S. Adaptively optimized combination (AOC) of magnetic resonance spectroscopy data from phased array coils. Magn Reson Med. 2015;75(6):2235-2244.
4. Martini N, Santarelli MF, Giovannetti G, et al. Noise correlations and SNR in phased-array MRS. NMR Biomed. 2010;23(1):66-73.
5. Rodgers CT, Robson MD. Receive array magnetic resonance spectroscopy: Whitened singular value decomposition (WSVD) gives optimal Bayesian solution. Magn Reson Med. 2010;63(4):881-891.
6. Hall EL, Stephenson MC, Price D, Morris PG. Methodology for improved detection of low concentration metabolites in MRS: Optimised combination of signals from multi-element coil arrays. NeuroImage. 2014;86:35-42.
7. Pradhan S, Bonekamp S, Gillen JS, et al. Comparison of single voxel brain MRS AT 3T and 7T using 32-channel head coils. Magnetic Resonance Imaging. 2015;33(8):1013-1018.
Figures