2953
Metabolic Differences in Blood Plasma of Type 2 Diabetic and Non-diabetic Prostate Cancer Patients using NMR Spectroscopy
Virendra Kumar1, Pradeep Kumar1, Rajeev Kumar2, Sanjay Sharma3, Sanjay Thulkar4, Siddhartha Dattagupta5, S Senthil Kumaran1, Rama Jayasundar1, and N R Jagannathan6
1Department of NMR, All India Institute of Medical Sciences, New Delhi, India, 2Department of Urology, All India Institute of Medical Sciences, New Delhi, India, 3Department of Radio-diagnosis, RPC, All India Institute of Medical Sciences, New Delhi, India, 4Department of Radio-diagnosis, IRCH, All India Institute of Medical Sciences, New Delhi, India, 5Department of Pathology, All India Institute of Medical Sciences, New Delhi, India, 6Present address: Department of Radiology, Chettinad Academy of Research and Education, Kelambakkam, Tamil Nadu, India
1Department of NMR, All India Institute of Medical Sciences, New Delhi, India, 2Department of Urology, All India Institute of Medical Sciences, New Delhi, India, 3Department of Radio-diagnosis, RPC, All India Institute of Medical Sciences, New Delhi, India, 4Department of Radio-diagnosis, IRCH, All India Institute of Medical Sciences, New Delhi, India, 5Department of Pathology, All India Institute of Medical Sciences, New Delhi, India, 6Present address: Department of Radiology, Chettinad Academy of Research and Education, Kelambakkam, Tamil Nadu, India
Synopsis
The present study evaluates the metabolic profile of blood plasma for distinguishing prostate cancer (PCa) patients with type 2 diabetes mellitus (T2DM), PCa and healthy controls using 1H-NMR spectroscopy. Our data showed significant lower concentration of glycine, glycerophosphocholine, choline and higher concentration of glucose in PCa patients with T2DM as compared to PCa patients and healthy control. Results provided an insight into the alterations in the metabolic pathways in T2DM-PCa and indicated that NMR spectroscopy may help in determining metabolic changes associated with PCa patients with T2DM and may help in diagnosis.
Introduction
Type 2 diabetic prostate cancer (T2DM-PCa) is a complex disease. Its incidence and mortality rates are increasing rapidly with the growing age population1. Insulin resistance and hyper-insulinemia have been associated with an increased risk of malignancy in various organs including prostate2. The influence of diabetes on risk and prognosis of PCa is complex because of testosterone fluctuations often observed among PCa patients with diabetes, and these fluctuations also influence development of tumors3-4. Thus, the present study was designed to investigate the metabolic profile of blood plasma to distinguish between patients with PCa and T2DM-PCa from healthy controls using proton (1H) nuclear magnetic resonance (NMR) spectroscopy and for determining novel potential biomarker/s of T2DM-PCa.Methods
Blood samples were collected from PCa patients [n, 40; mean age, 67.3±8.1 years; mean PSA, 34.88 (4.11-100) ng/mL], T2DM-PCa [n, 16; mean age, 64.3± 5.1 years; mean PSA, 30.62 (4.39-149.73) ng/mL] and healthy controls [n, 30; mean age, 28.3 ± 3.5 years], in morning pre-prandial after overnight fasting. An informed consent was taken and study was approved by the institute ethics committee. Proton NMR spectroscopy of the blood plasma samples was carried out at 700 MHz (Agilent, U.S.A.) using one dimensional (1D) CPMG sequence with pre-saturation. The parameters for 1D experiment: spectral width, 12 ppm; data points, 32 K; number of scans, 64; spin echo delay, 5 ms and a relaxation delay of 70s. The data was processed using the Vnmrj 2.3 A. For comparison between the two groups, unpaired Mann-Whitney U test was carried out using SPSS software. A p-value <0.05 was considered as significant. Both univariate (receiver operating characteristics (ROC) curve analysis) and multivariate analyses (orthogonal partial least squares–discriminant analyses OPLS-DA, variable importance to projection (VIP) score) were carried out using MetaboAnalyst4.0.Results
Figure 1 shows the representative aliphatic region of 1D 1H-NMR spectrum of blood plasma sample of a patient with T2DM-PCa (Age, 67 years; PSA, 76ng/mL; GS , 4+4) (A), PCa patient (age, 65; PSA, 100ng/mL, GS, 4+4) (B) and compared HC (age, 38 years) (C). The metabolic profile analysis showed higher concentration of malonate, choline (Cho), GPC, glycine (Gly), glucose (Glc), and lower concentration of tyrosine (Tyr), histidine (His), phenylalanine (Phe), isoleucine (IIe) in patients with PCa as compared to HC and VIP score >1.0 are given in Table 1. Further, data also showed significantly lower concentration of Gly, GPC, Cho and higher concentration of Glc in T2DM-PCa patients compared to PCa patients. Additionally our results also showed higher concentration of malonate, Cho, GPC, Glc and lower concentration of IIe, Gly, His, Phe and Tyr in PCa patients with T2DM compared to HC. The OPLS-DA score plot shown in Figure 2 depicts clear discrimination between patients with PCa vs T2MD-PCa (A), T2DM-PCa vs HC (B) and PCa vs HC (C). Figure 3 shows the summary of altered metabolism pathway analysis and VIP score plot.Discussion
A significant higher concentration of Gly in PCa may show correlation between Gly consumption and cancer cell proliferation, suggesting that Gly uptake and catabolism was able to promote tumorigenesis and malignancy compared to T2DM-PCa. Furthermore significantly lower concentration of Gly in T2DM-PCa patients5 may reflect increased gluconeogenesis. Further, lower concentration of branch amino acid (IIe) and aromatic amino acids such as Tyr, His and Phe seen in PCa may indicate utilization of increased energy demand and protein turnover5. Higher concentration of Cho and GPC are associated with an increased risk of tumor in PCa patients compared to T2DM-PCaturnover6. Higher concentration of Glc in T2DM-PCa has shown to be positively correlated with diseases prognosis and possibly as a result of metabolic disorder such as insulin resistance and diabetes 7. The following seven unique significantly altered metabolic pathways such as glycerophosphocholine metabolism, glycine, serine and threonine metabolism, glycolysis or gluconeogenesis, phenylalanine metabolism, histidine metabolism, tyrosine metabolism, valine, leucine and isoleucine degradation and synthesis that discriminate and identified from T2DM-PCa patients and PCa compare with HC. The altered metabolites related to T2DM-PCa are mostly involved in phospholipids, amino acids and carbohydrate metabolism.Conclusion
This study demonstrated that NMR based metabolomics may be useful for distinguishing PCa patient with T2DM and non T2DM patients. Also, the metabolic profiling may offer the opportunity to understand the biochemical mechanism of pathogenesis and help to identify potential biomarker/s of complex diseases like T2DM-PCa.Acknowledgements
NRJ thanks SERB, Government of India funding under J.C. Bose Fellowship. PK acknowledges the CSIR fellowship.References
- Taitt HE. Am J Mens Health. 2018;12(6):1807-1823.
- Fall K, Garmo H, Gudbjörnsdottir S et al. Cancer Epidemiol Biomarkers Prev. 2013; 22(6):1102-9.
- Barone BB, Yeh HC, Snyder CF et al. JAMA. 2008; 17;300(23):2754-64.
- N, Ahmadi H, Salem S et al. Prostate. 2009; 1;69(16):1744-50.
- Bi X, Henry CJ. Nutr Diabetes. 201; 13;7(3):e249.
- Giskeødegård GF, Hansen AF, Bertilsson H et al. Br J Cancer. 2015; 22;113(12):1712-9.
- Wulaningsih W, Holmberg L, Garmo H et al. PLoS One. 2013;8(1):e54944.
Figures
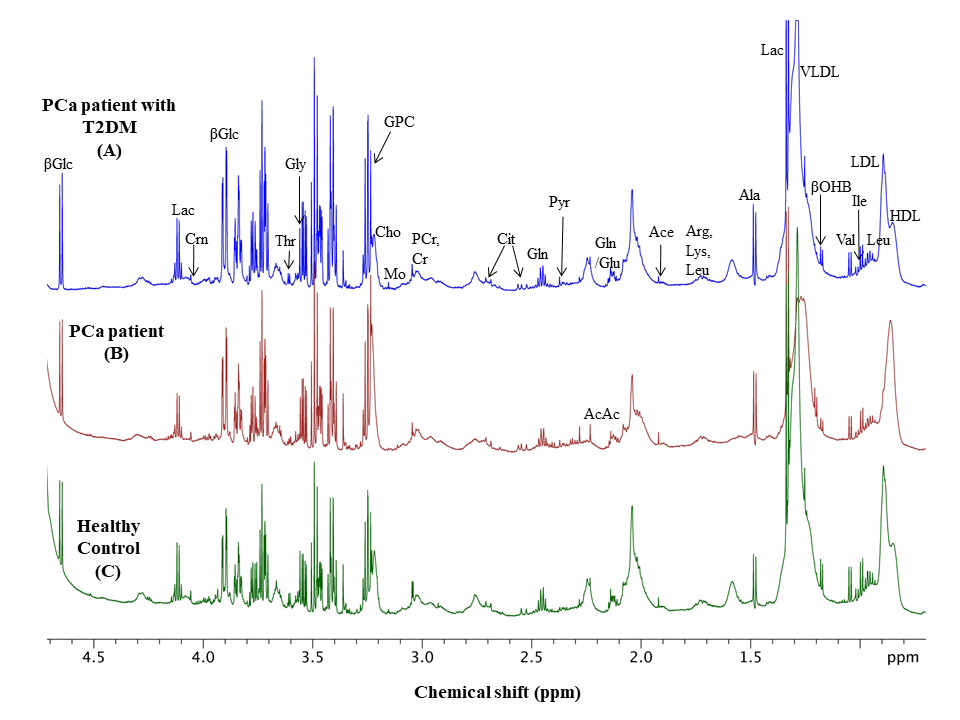
Representative one
dimensional (1D) aliphatic region of 1H NMR
(700MHz) spectrum of blood plasma of (A)
a PCa patient with T2DM (Age,
67 years; PSA, 76 ng/mL; GS, 4+4), (B) a PCa patient (age, 65; PSA, 100 ng/mL,
GS, 4+4) and (C)
Healthy control (age, 38 years).
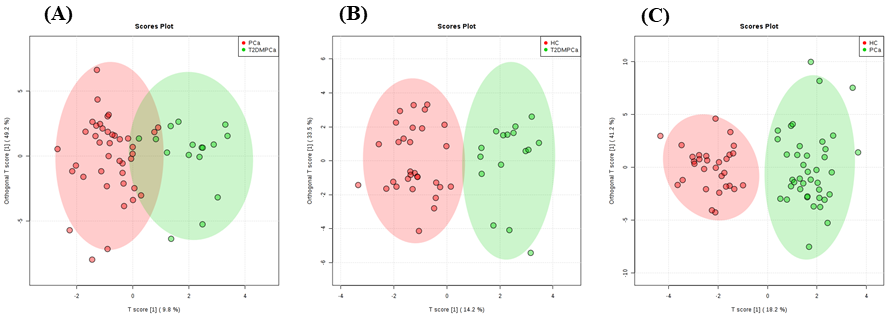
The
OPLS-DA score plot showing clear discrimination between patients with (A) PCa vs T2DM-PCa, (B)
T2DM-PCa vs HC and (C) PCa vs HC.
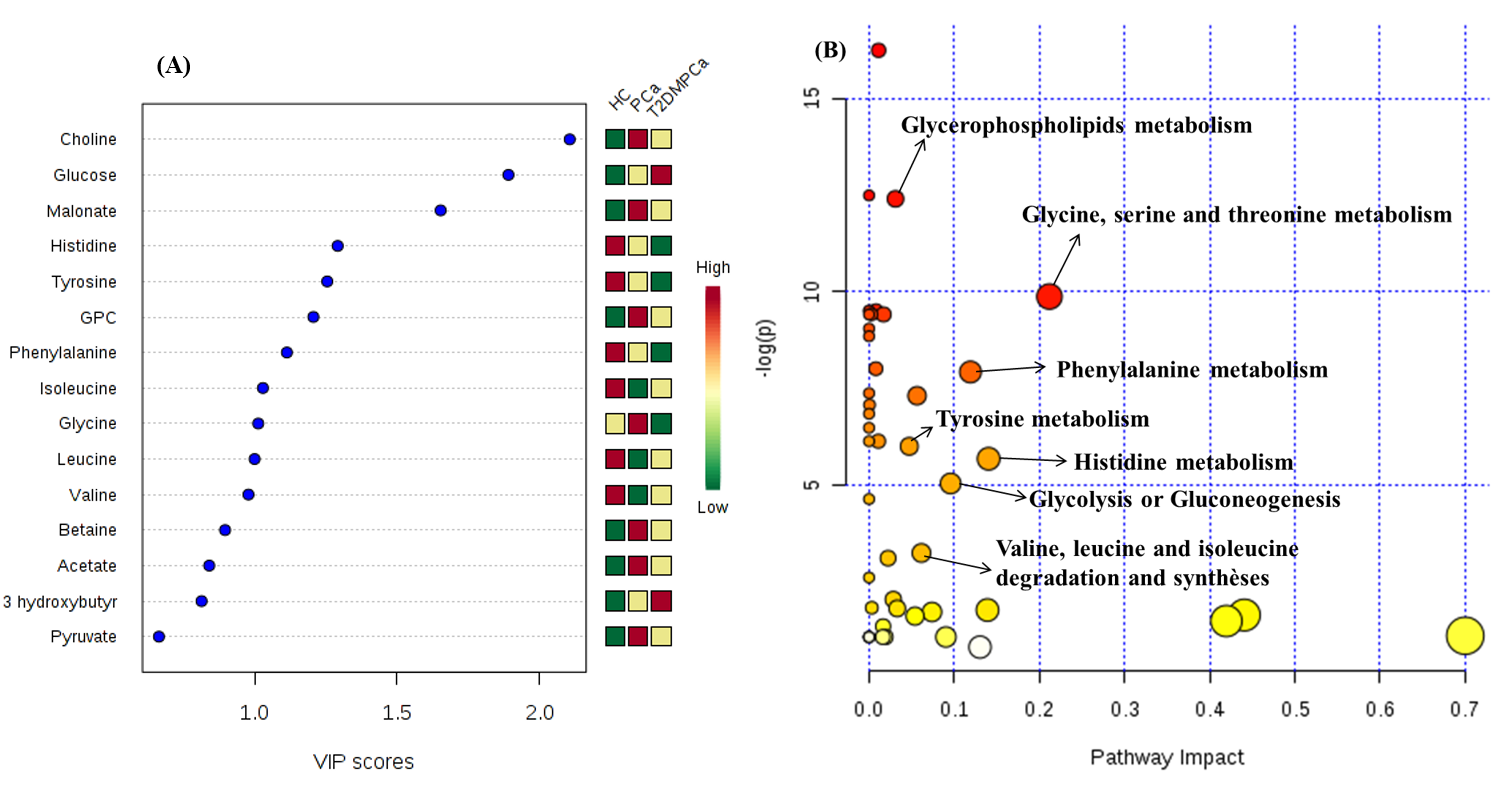
(A) The concentration importance of 15
metabolites based on multivariate ROC curve analysis, Variable Importance in
Projection (VIP) score plot indicating most discriminating metabolites in blood plasma samples of T2DM-PCa and PCa patients
from HC, (B) Summary of alteration
metabolism pathways analysis.
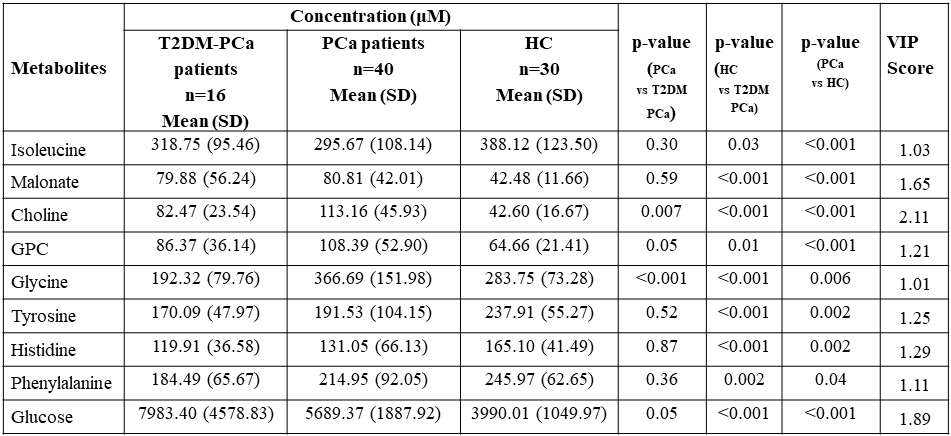
Comparison of
concentration (μM) of metabolites in
blood plasma of PCa patients with T2DM and PCa compared to HC. Statistically
significant (p<0.05) metabolites involved in the discrimination between two
groups calculated according to Mann-Whitney U test and VIP score values were
obtained in MetaboAnalyst4.0.