2952
Identification of Potential Biomarkers for Human Esophageal Cancer: NMR-based metabolomics of paired tissue-serum samples1Radiology Department, Second Affiliated Hospital of Shantou University Medical College, Shantou City, China
Synopsis
This was a parallel investigation of esophageal tumor tissues and adjacent normal mucosal tissues alongside patient-matched serum samples by nuclear magnetic resonance (NMR)-based metabolomics, to investigate how serum metabolic phenotypes were linked to the changes in the biochemical landscape of esophageal tumors. These associations provide evidence of distinct metabolic signatures and pathway disturbances between tumor tissues and serum of esophageal cancer patients, and changes in serum metabolic signature could reflect reprogramming of the aforementioned metabolic pathways in EC tissues.
Introduction
Esophageal cancer (EC) is one of the most common cancers, ranking as the sixth common malignancy and the fourth leading cause of cancer death in China1. Identifying cancer-related biomarkers of EC is essential for its early diagnosis and therapeutic intervention, which in turn will significantly increase patient`s survival. Global proton nuclear magnetic resonance (1H NMR)-based metabolomics opens up new possibilities for screening new, efficient and high-throughput cancer screening biomarkers2-3. Biomarker assays characterized by NMR spectroscopy-based metabolomics for EC detection have been developed for serum4, urine5-6 and tissue7, proving the potential utility of NMR-based metabolomics fingerprint as predictors for early diagnosis of EC. Currently, however, little is known about the systemic mechanistic link between esophageal tissues and serum samples of EC patients, due to the invasiveness of tissue sampling and sensitivity of serum metabolome to factors such as genetic composition, food, and environment. Therefore, the aim of this study was to profile parallel metabolites of EC tissues and adjacent noncancerous tissues alongside serum samples from the same patients, to investigate how serum metabolomic phenotypes correlate with tumor tissue, as well as to trace specific disturbed metabolic pathways in esophageal tissues and serum. Such information would be vital to bridge the gap between the systemic metabolic characteristics of tissues and the corresponding serum samples, and will help advance the utility of serum-based metabolites as relevant indicators of EC tissue microenvironment.Methods
Twenty-six EC patients with a scheduled esophageal resection participated in this study and provided esophageal cancer tissue (ECT) and distal noncancerous tissues (DNT, ~5 cm away from the tumor), together with the corresponding pre-operative serum samples. Tissue samples were extracted with methanol/chloroform solution and the resulting supernatant was dried under vacuum for a minimum of 18 h. The lyophilized power of tissue and serum samples were extracted with PBS/D20 buffer and a stock solution of TSP/D20 was added to each supernatant prior to analysis by 1H NMR spectroscopy. 1H-NMR spectra of esophageal tissues were detected by using a standard (1D) CarrPurcell-Meiboom-Gill (CPMG) pulse sequence with the following acquisition parameters: number of dummy scans, DS = 4; recycle delay, RD = 70 ms; 90°pulse width = 10 μs; number of scans, NS = 64; number of points, TD = 65,536; spectral width, SW = 8,012 Hz; acquisition time, AQ = 4.09 s. Serum 1H-NMR spectra were also recorded by using a 1D CPMG pulse sequence with the following acquisition parameters: number of dummy scans, DS = 4; recycle delay, RD = 1.5s; 90°pulse width = 10 μs; number of scans, NS = 64; number of points, TD = 16384; spectral width, SW = 5555 Hz; acquisition time, AQ = 1.47 s. Water suppression was achieved by irradiation of the water peak during RD and tm. All spectra were preprocessed and then bucketed with the equal width of 0.002ppm. The region of δ 4.4~ 5.6 was discarded to eliminate the imperfect water suppression. Each bucket was normalized to the total integral of the spectrum prior to OPLS-DA using the SIMCA-P+ program (version 14.1).Results
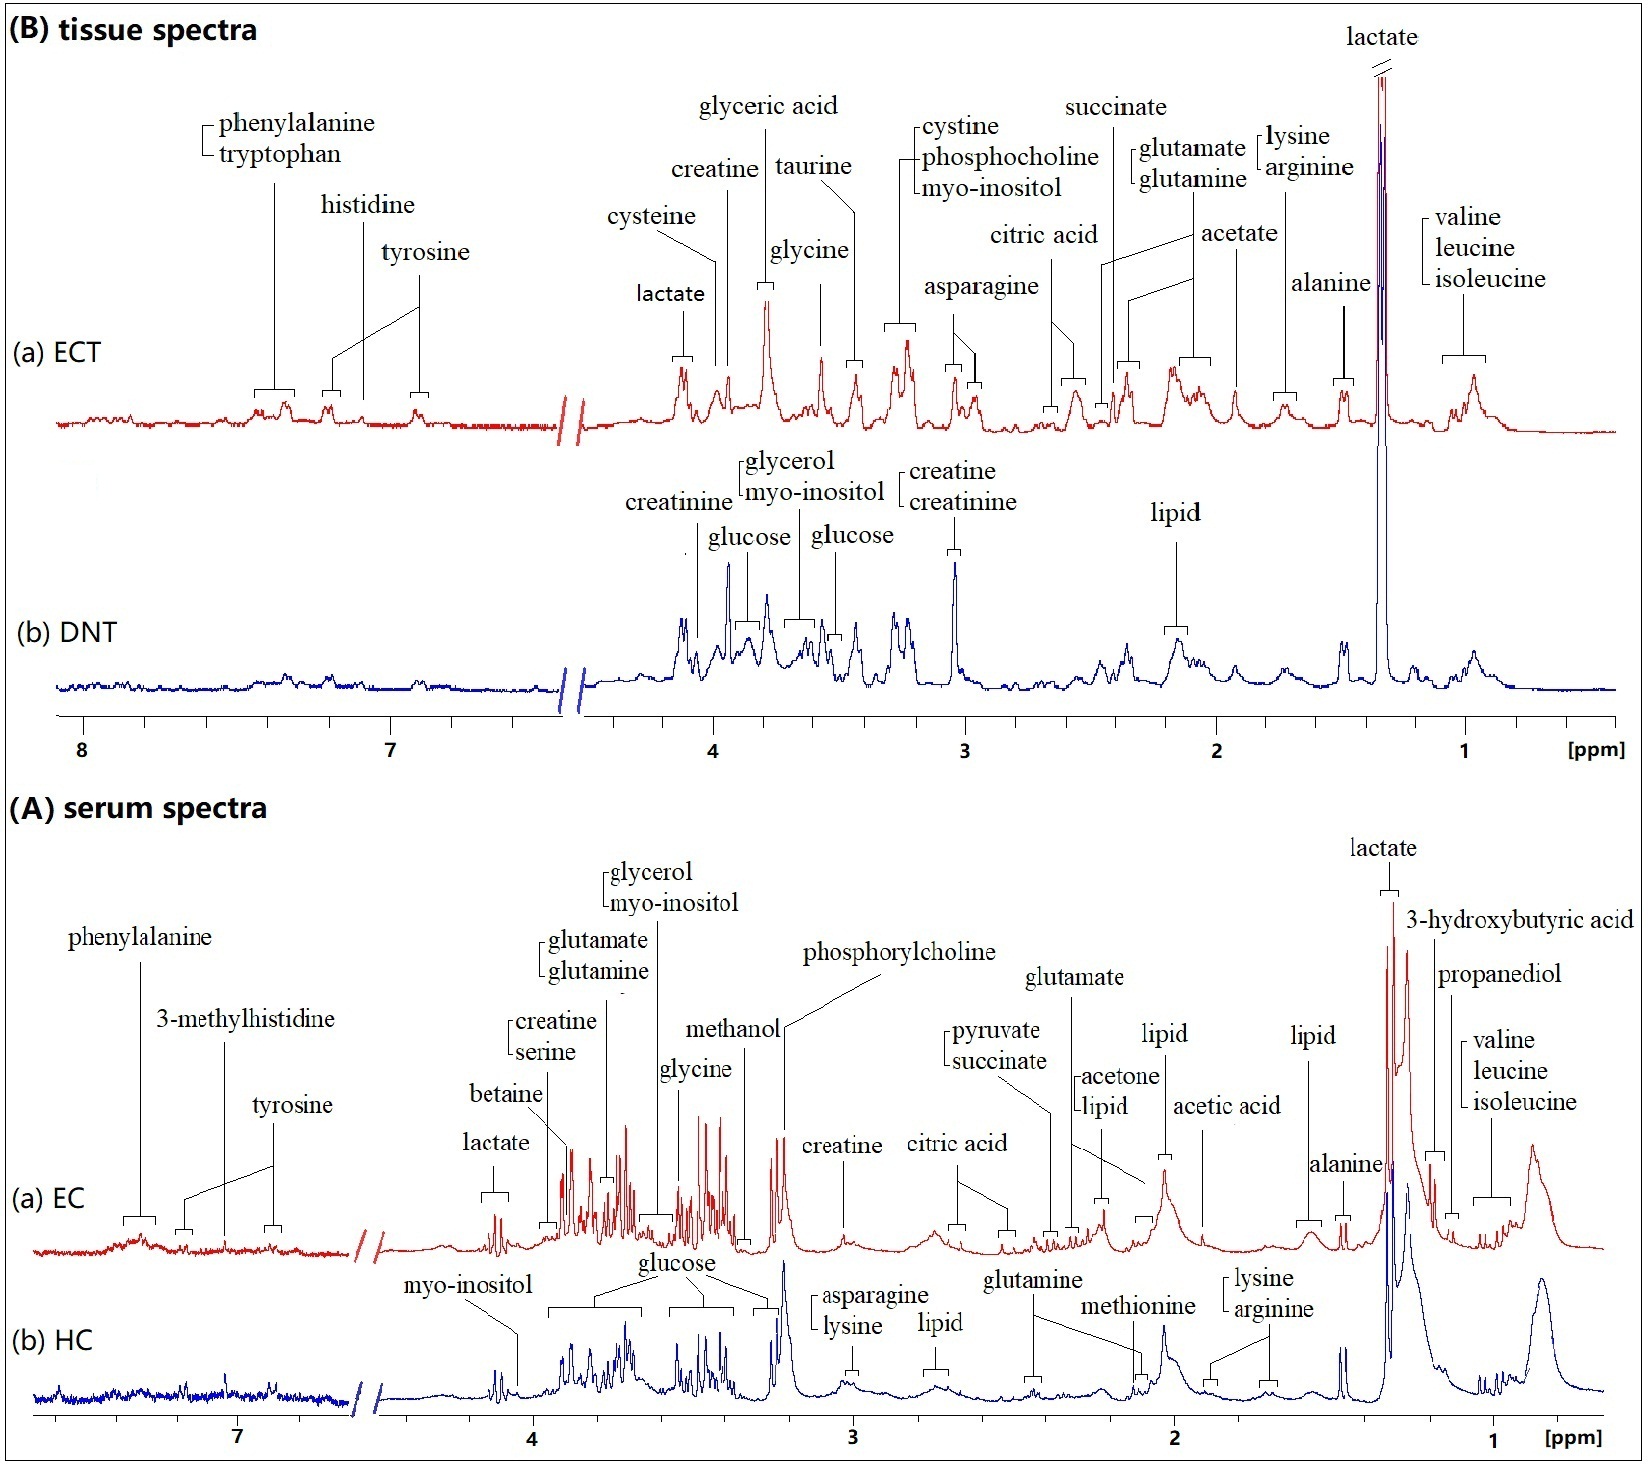
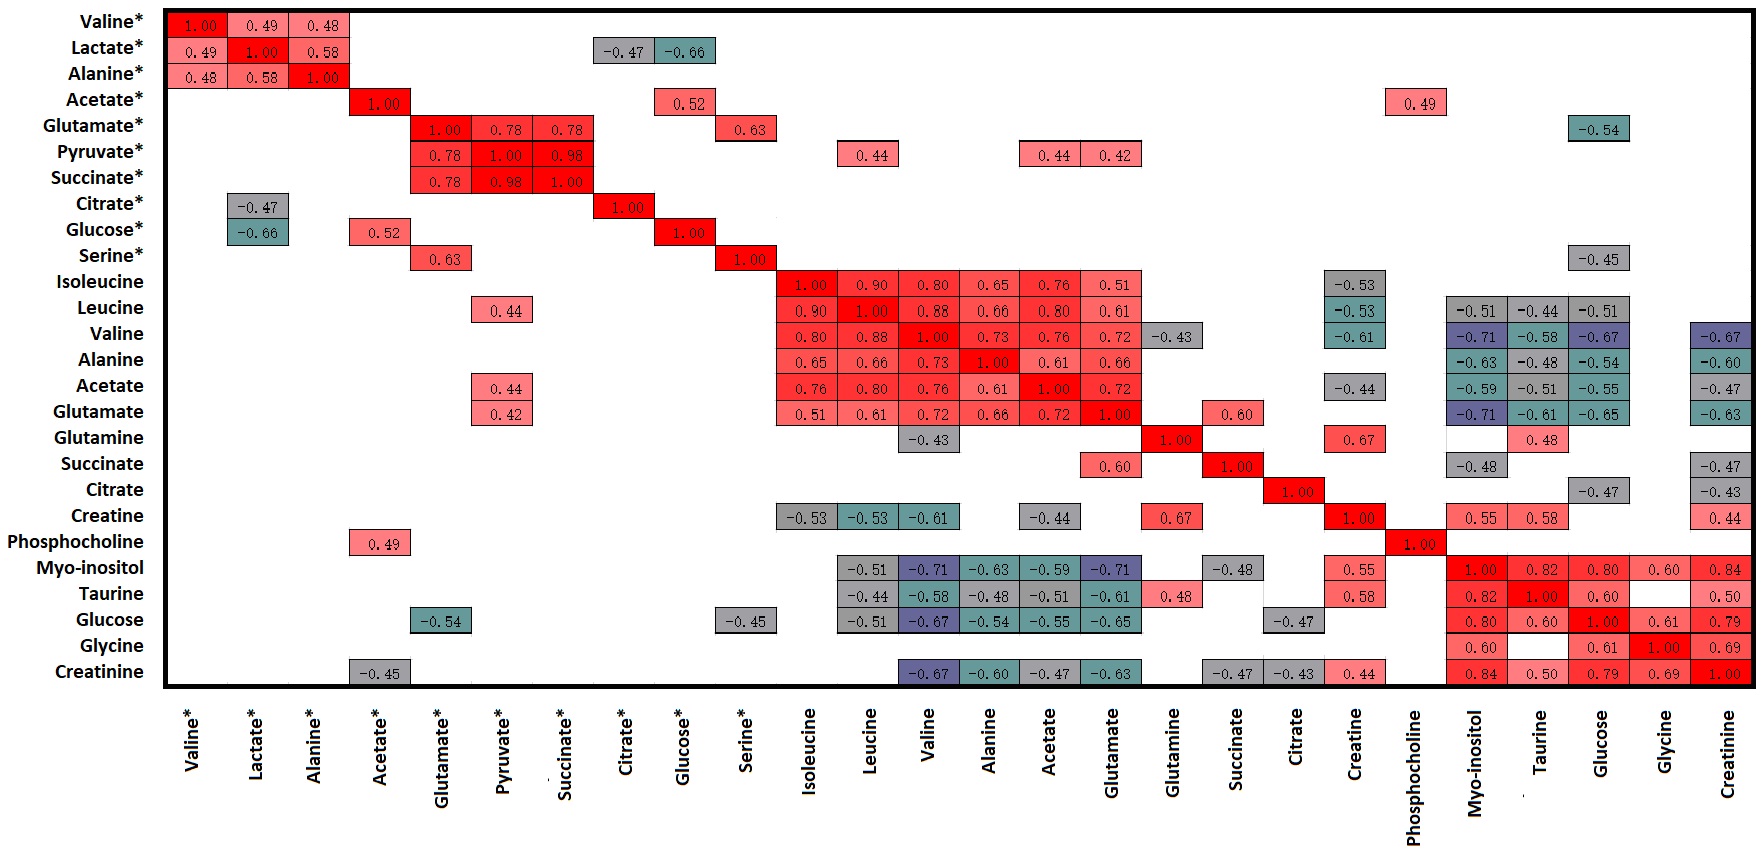
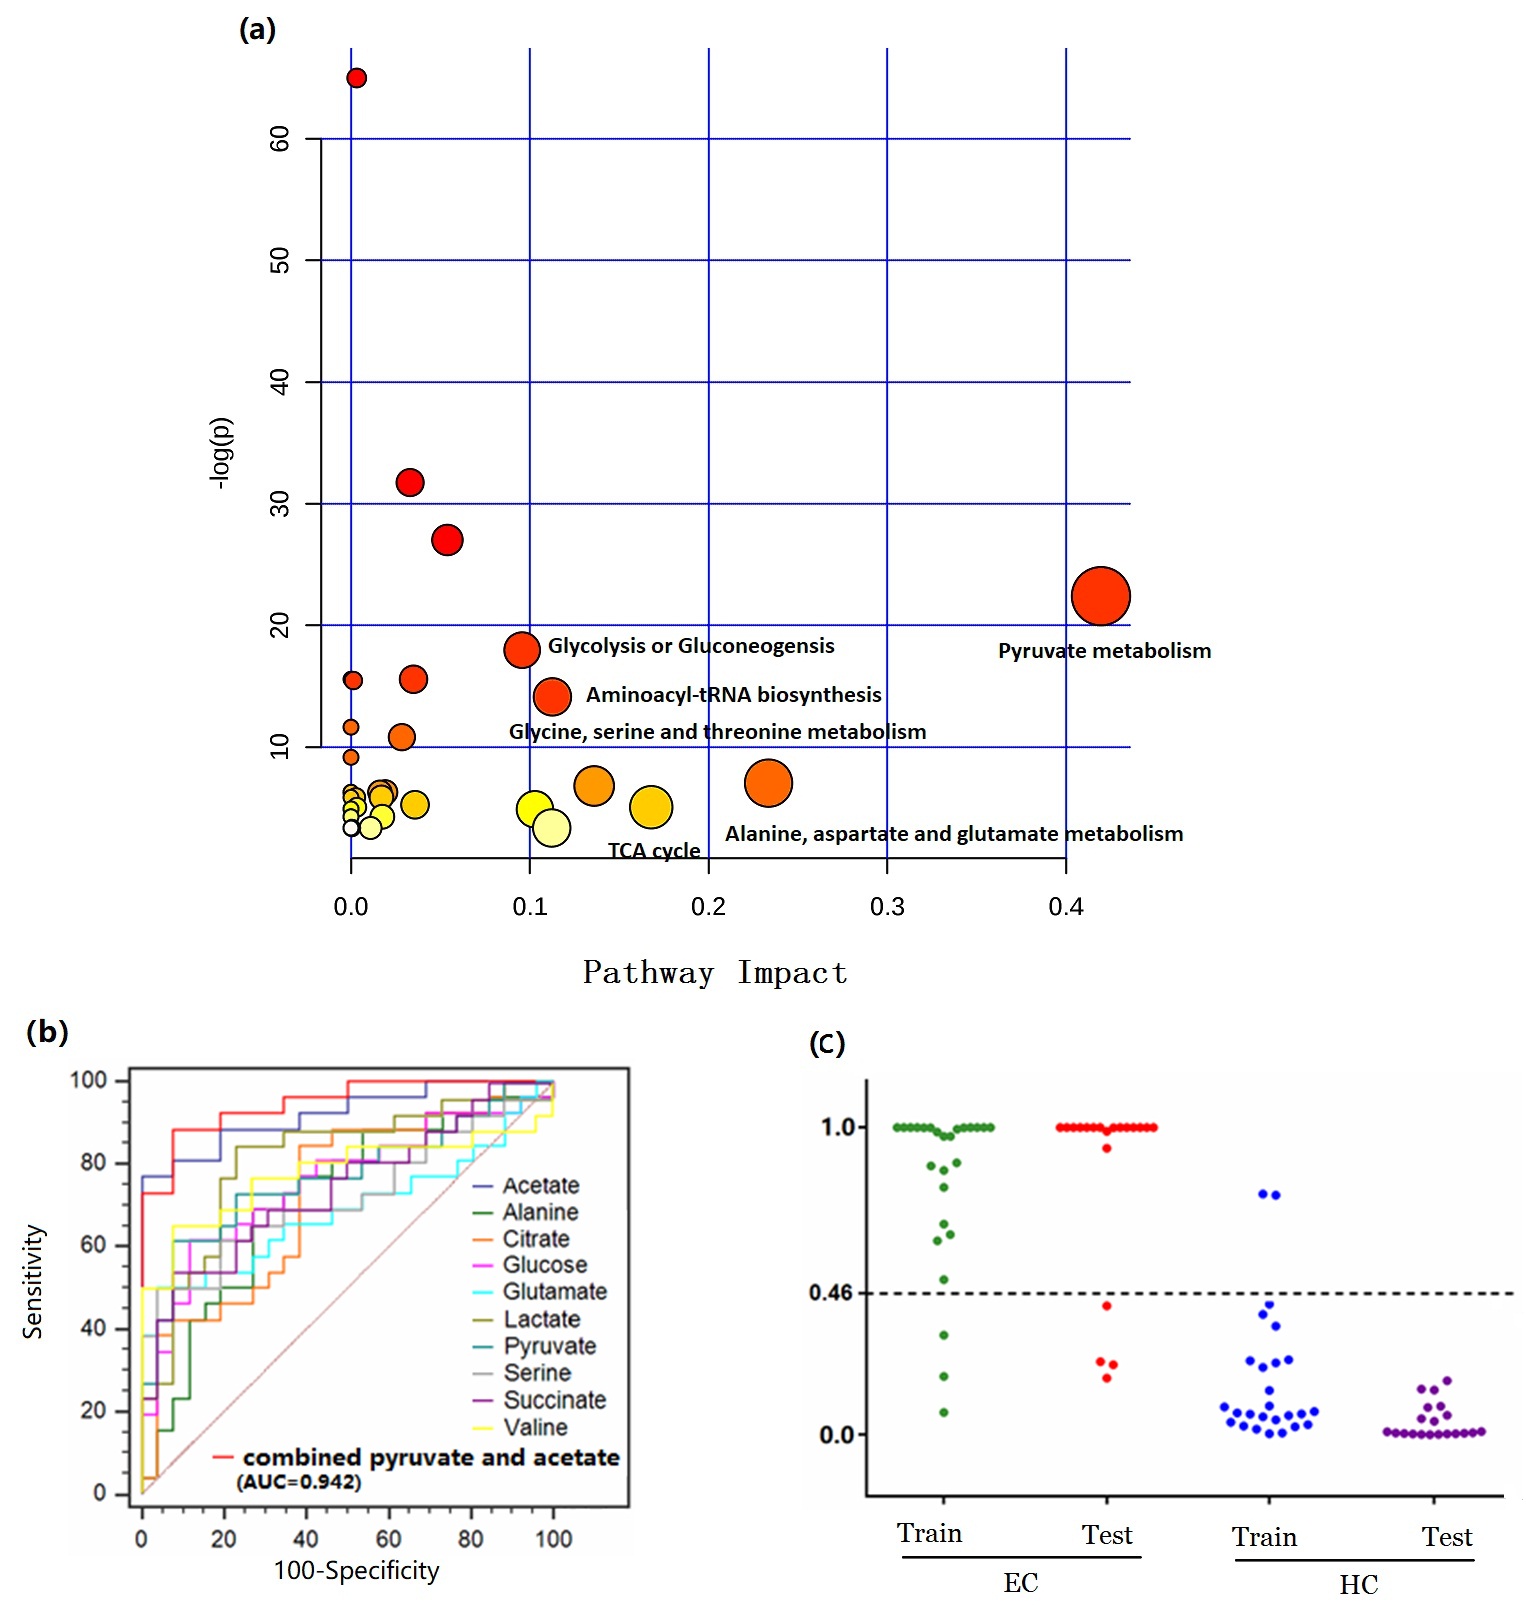
Representative 1D 1H NMR spectra of serum obtained from HCs and EC, and patient-matched esophageal tissue extracts obtained from ECT and DNT, are shown in Figure 1(A, B). Our parallel study of EC patients based on 1H NMR metabolomics provided evidence of differences in metabolites and disordered metabolic pathways between esophageal tissues and serum within the same individual, and a few overlapping discriminatory metabolites across both matrices were identified, including valine, alanine, glucose, acetate, citrate, succinate, and glutamate. Correlation analysis revealed that acetate, glutamate, serine and pyruvate in serum of EC were correlated with leucine, acetate, glutamate, phosphocholine and glucose in tissues, implying enhanced biosynthesis required for rapid cell proliferation (Figure 2). The metabolic pathway analysis revealed that pyruvate metabolism was the most important (Figure 3(a)), with pathway impact value of larger than 0.4 (p<0.05). Therefore, acetate and pyruvate were selected as the best serum biomarkers, given that they were the major metabolites involved in pyruvate metabolism, and their changes in serum were related to changes of tissue metabolites in EC patients. Compared to other serum metabolites, the combination of acetate and pyruvate demonstrated the highest diagnostic performance for diagnosing EC, with an area under the receiver operating characteristic curve of 0.942 in the training set (Figure 3(b)), and a good predictive ability in the validation set with a diagnostic accuracy of 90% (Figure 3(c)).Discussion and Conclusion
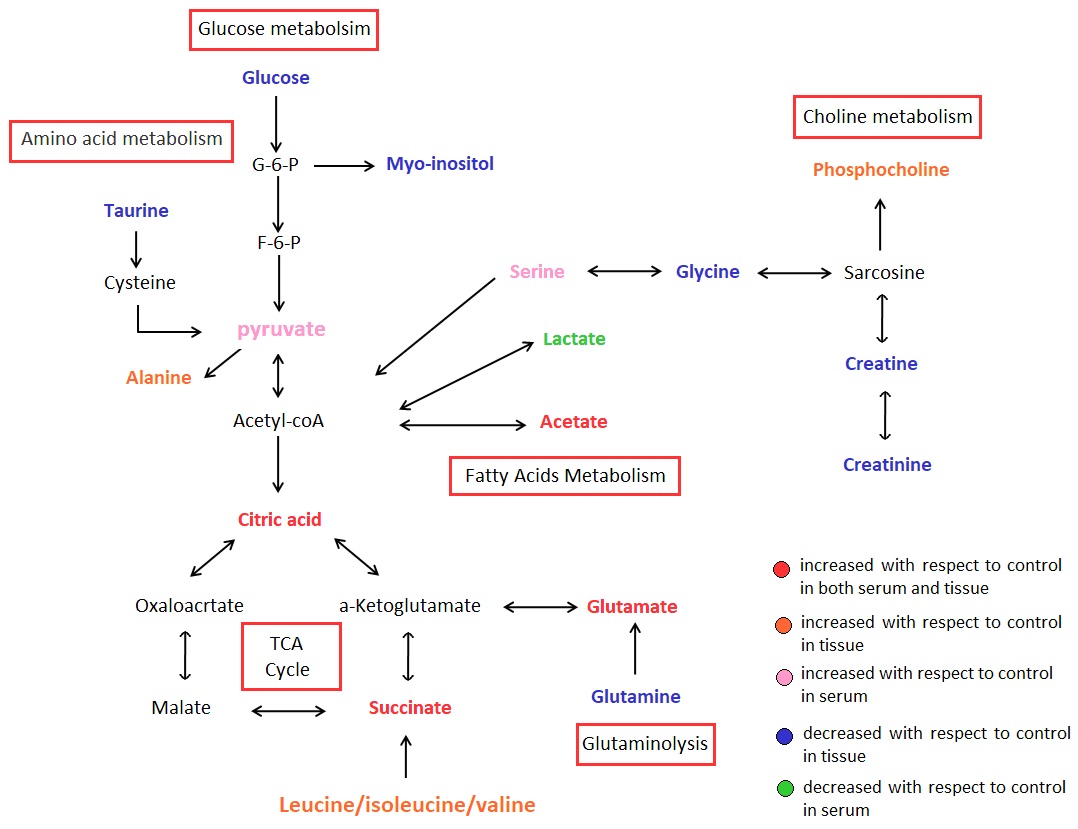
Overall, these associations between tumor tissues and serum of EC patients provide evidence of distinct metabolic signatures and pathway disturbances potentially revealing linkages but not limited to TCA, glutaminolysis, SCFA metabolism and lipometabolism required for tumor growth (Figure 4), and changes in serum metabolic signature could reflect reprogramming of the aforementioned metabolic pathways in EC tissues. Further investigation is needed to validate these initial findings using larger samples and to establish the mechanism underlying progression of EC.Acknowledgements
This study was supported by grants from National Natural Science Foundation of China (81471729, 81101102), the Science and Technology, Planning Project of Guangdong Province (2016A020216025), the Research Award Fund for Outstanding Young Teachers in Higher Education Institutions, Guangdong Province (YQ2015245), and the National Natural Science Foundation of Guangdong Province (S2011010004973).References
1. He YT et al. Zhonghua Zhong Liu Za Zhi 2017;39(4):315-20.
2. Yan Lin et al. Int J Cancer, 2019,145:1679-1689
3. Yan Lin et al. Oncotarget, 2016, 7(20):29454-29464
4. Gu, J et al. Carcinogenesis,2017, 38, 162-167.
5. Davis, V W, et al. World journal of surgical oncolog, 2012, 10, 271.
6. Jia-Hao Liang et al. World Journal of Gastroenterology, 2019, 25(25):3218-3230.
7. Wang L, et al. Molecular Cancer 2013;12(1):25.
Figures