2951
High-grade gliomas: Metabolic and structural assessment using high resolution 3D-MRSI at 7T
Gilbert Hangel1,2, Cornelius Cadrien1,2, Philipp Lazen1, Alexandra Lipka1, Philipp Moser1, Eva Hečková1, Lukas Hingerl1, Stanislav Motyka1, Stephan Gruber1, Bernhard Strasser3, Georg Widhalm2, Barbara Kiesel2, Mario Mischkulnig2, Julia Furtner4, Thomas Rötzer5, Karl Rössler2, Siegfried Trattnig1,6, and Wolfgang Bogner1
1High Field MR Centre, Department of Biomedical Imaging and Image-guided Therapy, Medical University of Vienna, Vienna, Austria, 2Department of Neurosurgery, Medical University of Vienna, Vienna, Austria, 3Athinoula A. Martinos Center for Biomedical Imaging, Department of Radiology, Massachusetts General Hospital, Harvard Medical School, Boston, MA, United States, 4Division of Neuroradiology and Musculoskeletal Radiology, Department of Biomedical Imaging and Image-guided Therapy, Medical University of Vienna, Vienna, Austria, 5Clinical Institute of Neurology, Medical University of Vienna, Vienna, Austria, 6Christian Doppler Laboratory for Clinical Molecular MR Imaging, Vienna, Austria
1High Field MR Centre, Department of Biomedical Imaging and Image-guided Therapy, Medical University of Vienna, Vienna, Austria, 2Department of Neurosurgery, Medical University of Vienna, Vienna, Austria, 3Athinoula A. Martinos Center for Biomedical Imaging, Department of Radiology, Massachusetts General Hospital, Harvard Medical School, Boston, MA, United States, 4Division of Neuroradiology and Musculoskeletal Radiology, Department of Biomedical Imaging and Image-guided Therapy, Medical University of Vienna, Vienna, Austria, 5Clinical Institute of Neurology, Medical University of Vienna, Vienna, Austria, 6Christian Doppler Laboratory for Clinical Molecular MR Imaging, Vienna, Austria
Synopsis
We applied high resolution 3D-MRSI covering the whole brain at 7T to 16 high-grade glioma measurements and evaluated our findings in regards of quantifiable metabolites and their structure in the glioma compared to histology and clinical imaging. Our findings include 14 apparently quantifiable metabolites that resolve glioma structure. Especially the pattern of Glycine to myo-Inositol could be indicative of glioma type and proliferation beyond morphological visibility, making 3D-MRSI an interesting lead for preoperative biomarkers with spatial resolution. Other less-researched metabolites such as Serine and Cysteine could lead to new investigations of glioma metabolism.
Purpose
Recent research into the biochemistry of brain tumours produced new and more detailed findings, from the connection of 2-hydroxygluarate to IDH mutations1 to a differentiated behaviour of myo-Inositol (Ins) and Glycine (Gly), which are difficult-to-separate with MRS, in regards to patient survival2. Clinical MRS is limited in quantifiable metabolites and coverage, while other methods like mass spectroscopy, immunohistochemical and molecular-pathological protocols are limited to post-operative samples. Recently we showed the first results of high resolution MRSI in gliomas at 7T for single slices3 but have now improved the MRSI acquisition using concentric ring trajectories to a full 3D sequence4 covering the brain. This work presents our results for the first 16 high-grade glioma measurements, demonstrating new possibilities to measure more compounds of interest like Gly in greater spatial detail.Methods
After clinical routine MRI, out of 41 patients with brain tumours that were measured with a 3D-MRSI protocol at a Siemens Magnetom 7T with a 32-channel coil (Nova Medical), 16 patients with histologically verified high-grade gliomas (9 male, 7 female, age 52±16, histopathological diagnosis in Fig.1) were evaluated. Written informed consent and approval of the institutional review board were obtained. The MRSI parameters were: 64×64×39 matrix, 220×220×133 mm³ FOV, acquisition delay of 1.3 ms, TR 450 ms, WET water suppression, 39° flip angle, 1116 readout points and 2778 Hz readout bandwidth. Postprocessing included a Hamming filter and L2-regularisation5 to remove lipid artefacts. The resulting spectra were quantified using LCModel with a basis set including NAA, NAAG, Cr, PCr, GPC, PCh, Ins, scyllo-Ins, GABA, GSH, Glutamate, Glutamine, Gly, Taurine, Aspartate, Citrate, Cystathionine, Cysteine, Serine, Tryptophan, 2HG and a macromolecular basis6 in a range from 0.2-1.2 ppm and 1.8-4.2 ppm. The results were evaluated based on the resulting spectra and metabolite maps compared to morphological imaging and histopathology (IDH, TERT, MGMT, 1p19q, ATRX, p53, EGFR).Results
The resulting metabolic maps were usable in 15 patients and considered good quality in 10; unsuccessful measurements were caused by metal artefacts and glioma locations deeper than the cerebrum. NAA, tCho, tCr, Glu, Gln, Ins, Gly, GSH and GABA could be apparently quantified in all remaining cases, while NAAG, Tau, Ser, Cys, Ctn were apparently quantifiable in the majority of cases (Fig.1). As shown with example spectra (Fig.2), great spectral differences could be found between tumour regions, suspected infiltration and healthy tissue. An example of the potential metabolites of interest and the representation of structural differences is given in Fig.3. The MRSI sequence was clearly able to resolve the possible heterogeneities of high-grade gliomas such as edemas. The maps of tCho, Gln and Gly were found to be most consistent as markers for activity in visible tumours and beyond, with Gly potentially showing proliferation (Fig.4). The apparent success in fitting of Ser, Cys, Tau and Ctn in the gliomas broadens the possible metabolic profile for structural assessment (Fig.5). Based on the qualitative metabolite trends (Fig.1) the following observations were made: Reduced NAA and increases in tCho and Gln were found in all cases. Gly appears also to be increased in all cases, with less Ins in grade IV glioblastomas. tCr decreased in most cases, while Tau and Ctn appeared increased when successfully quantified. The grade IV glioblastomas also showed tendencies of Glu increases and GSH reduction. GABA generally displayed changes in both directions. Enhancement on the 2HG maps was not consistent with IDH-histopathology, but IDH-mutated gliomas showed trends of reduced Cr, Glu, GABA and Cys (but were also most of the “lower grades” of this study). No findings for other histopathological markers occurred.Discussion
Previous publications about MRSI of glioma at 7T3,7 are limited in scope and in spatial and metabolic coverage. This work adds more data, coverage of the brain and attempts to widen the metabolic frame. This is especially relevant as research in other fields uncovers more information about tumour metabolism that is very hard to evaluate preoperatively and with any spatial resolution. Increases in Gly and reduction of Ins in high-grade gliomas are known8 and could be a lead to investigate better image-based detection of proliferation. The increase of Gln in tumours can add another strong marker to tCho that could be part of a multiparametric tissue evaluation. While the plausibility and meaning of fitting Tau, Ser, Cys, Ctn, GABA and such can be legitimately questioned, there are also points that support their investigation: Ser, already measured in gliomas at 7T9, in connection with Cys and Gly, appears linked to proliferation10 and increases in higher grades5; GABA appears to decrease with progression5 with GABA oxidation playing a role in proliferation that is affected by IDH-status11. Regarding limitations, a more detailed analysis of the datasets, including regional evaluation, more subjects and a comparison to low-grade gliomas is necessary. Quantified metabolites could be misfits of artefacts or other compounds. Verification of metabolic alterations is required, e.g. by mass spectroscopy of biopsy samples and comparison to tumour infiltration obtained by intraoperative 5-aminolevulinic acid fluorescence. This approach has so far not been successful to reliably determine 2HG levels and therefore IDH status.Acknowledgements
This study was supported by the Austrian Science Fund (FWF): KLI-646 and P 30701.References
[1] Choi et al. Nature Medicine 2012, doi: 10.1038/nm.2682[2] Mörén et al. Metabolites 2015, doi: 10.3390/metabo5030502
[3] Hangel et al. Neuroimage 2019, doi: 10.1016/j.neuroimage.2019.02.023
[4] Hingerl al. MRM 2017, doi: 10.1002/mrm.26987 and Hingerl al. Investigative Radiology 2019, in press
[5] Bilgic et al. JMRI 2013, 10.1002/jmri.24365
[6] Považan et al. Neuroimage 2015, doi: 10.1016/j.neuroimage.2015
[7] Li et al. JMRI 2015, doi: 10.1002/jmri.24672
[8] Valeria et al. IJO 2010, doi: 10.3892/ijo_00000500
[9] Choi et al. MRM 2009, doi: 10.1002/mrm.22079
[10] Mattaini et al. JCB 2016, doi: 10.1083/jcb.201604085
[11] Hujber et al. Journal of Experimental and Clinical Cancer Research 2018, doi: 10.1186/s13046-018-0946-5
Figures
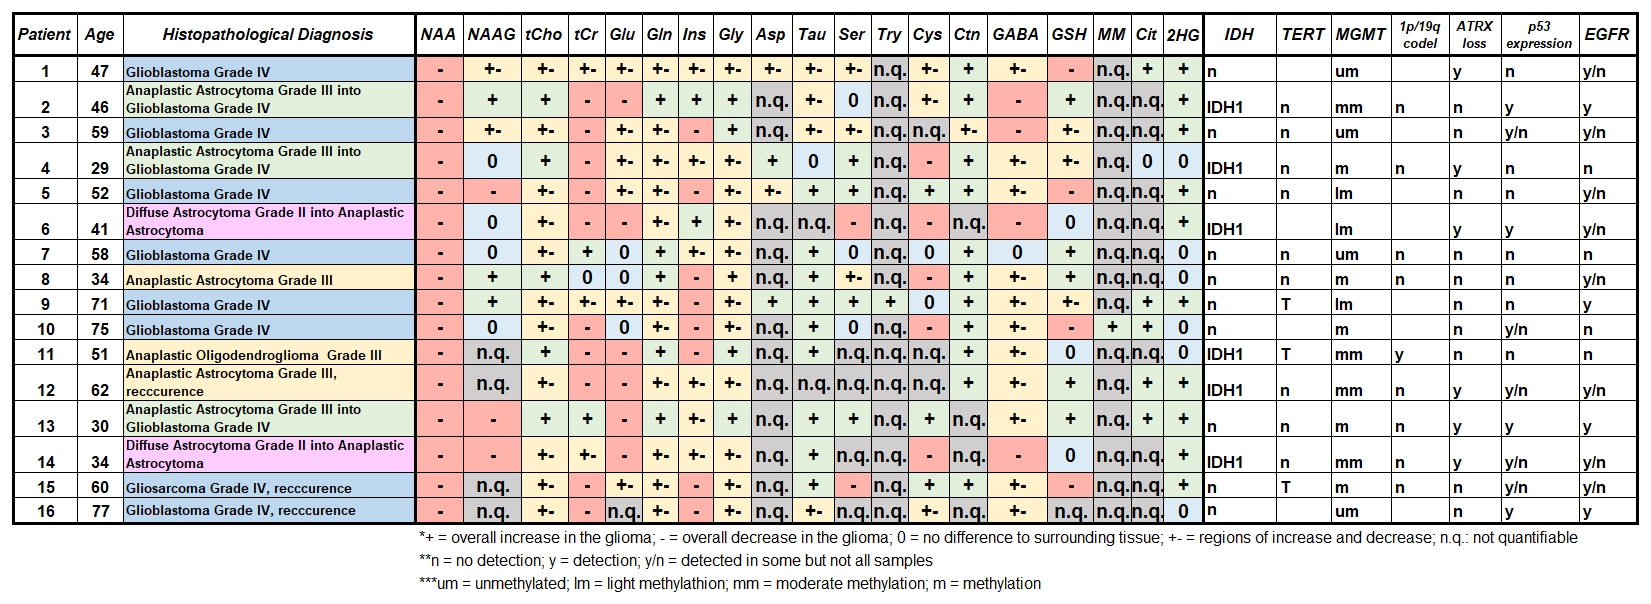
Figure 1: Overview
table of patients including histopathological diagnosis, immunochemical and
molecular-pathological markers and an overview of metabolites quantification
performance and trends. 0 indicates no detectable differences, + at least one
clearly increased region, - one clearly decreased region, and +- at least one
decreasing and one increasing region, with n.q. indicating that no
quantification over the large parts of the filed of view was possible.
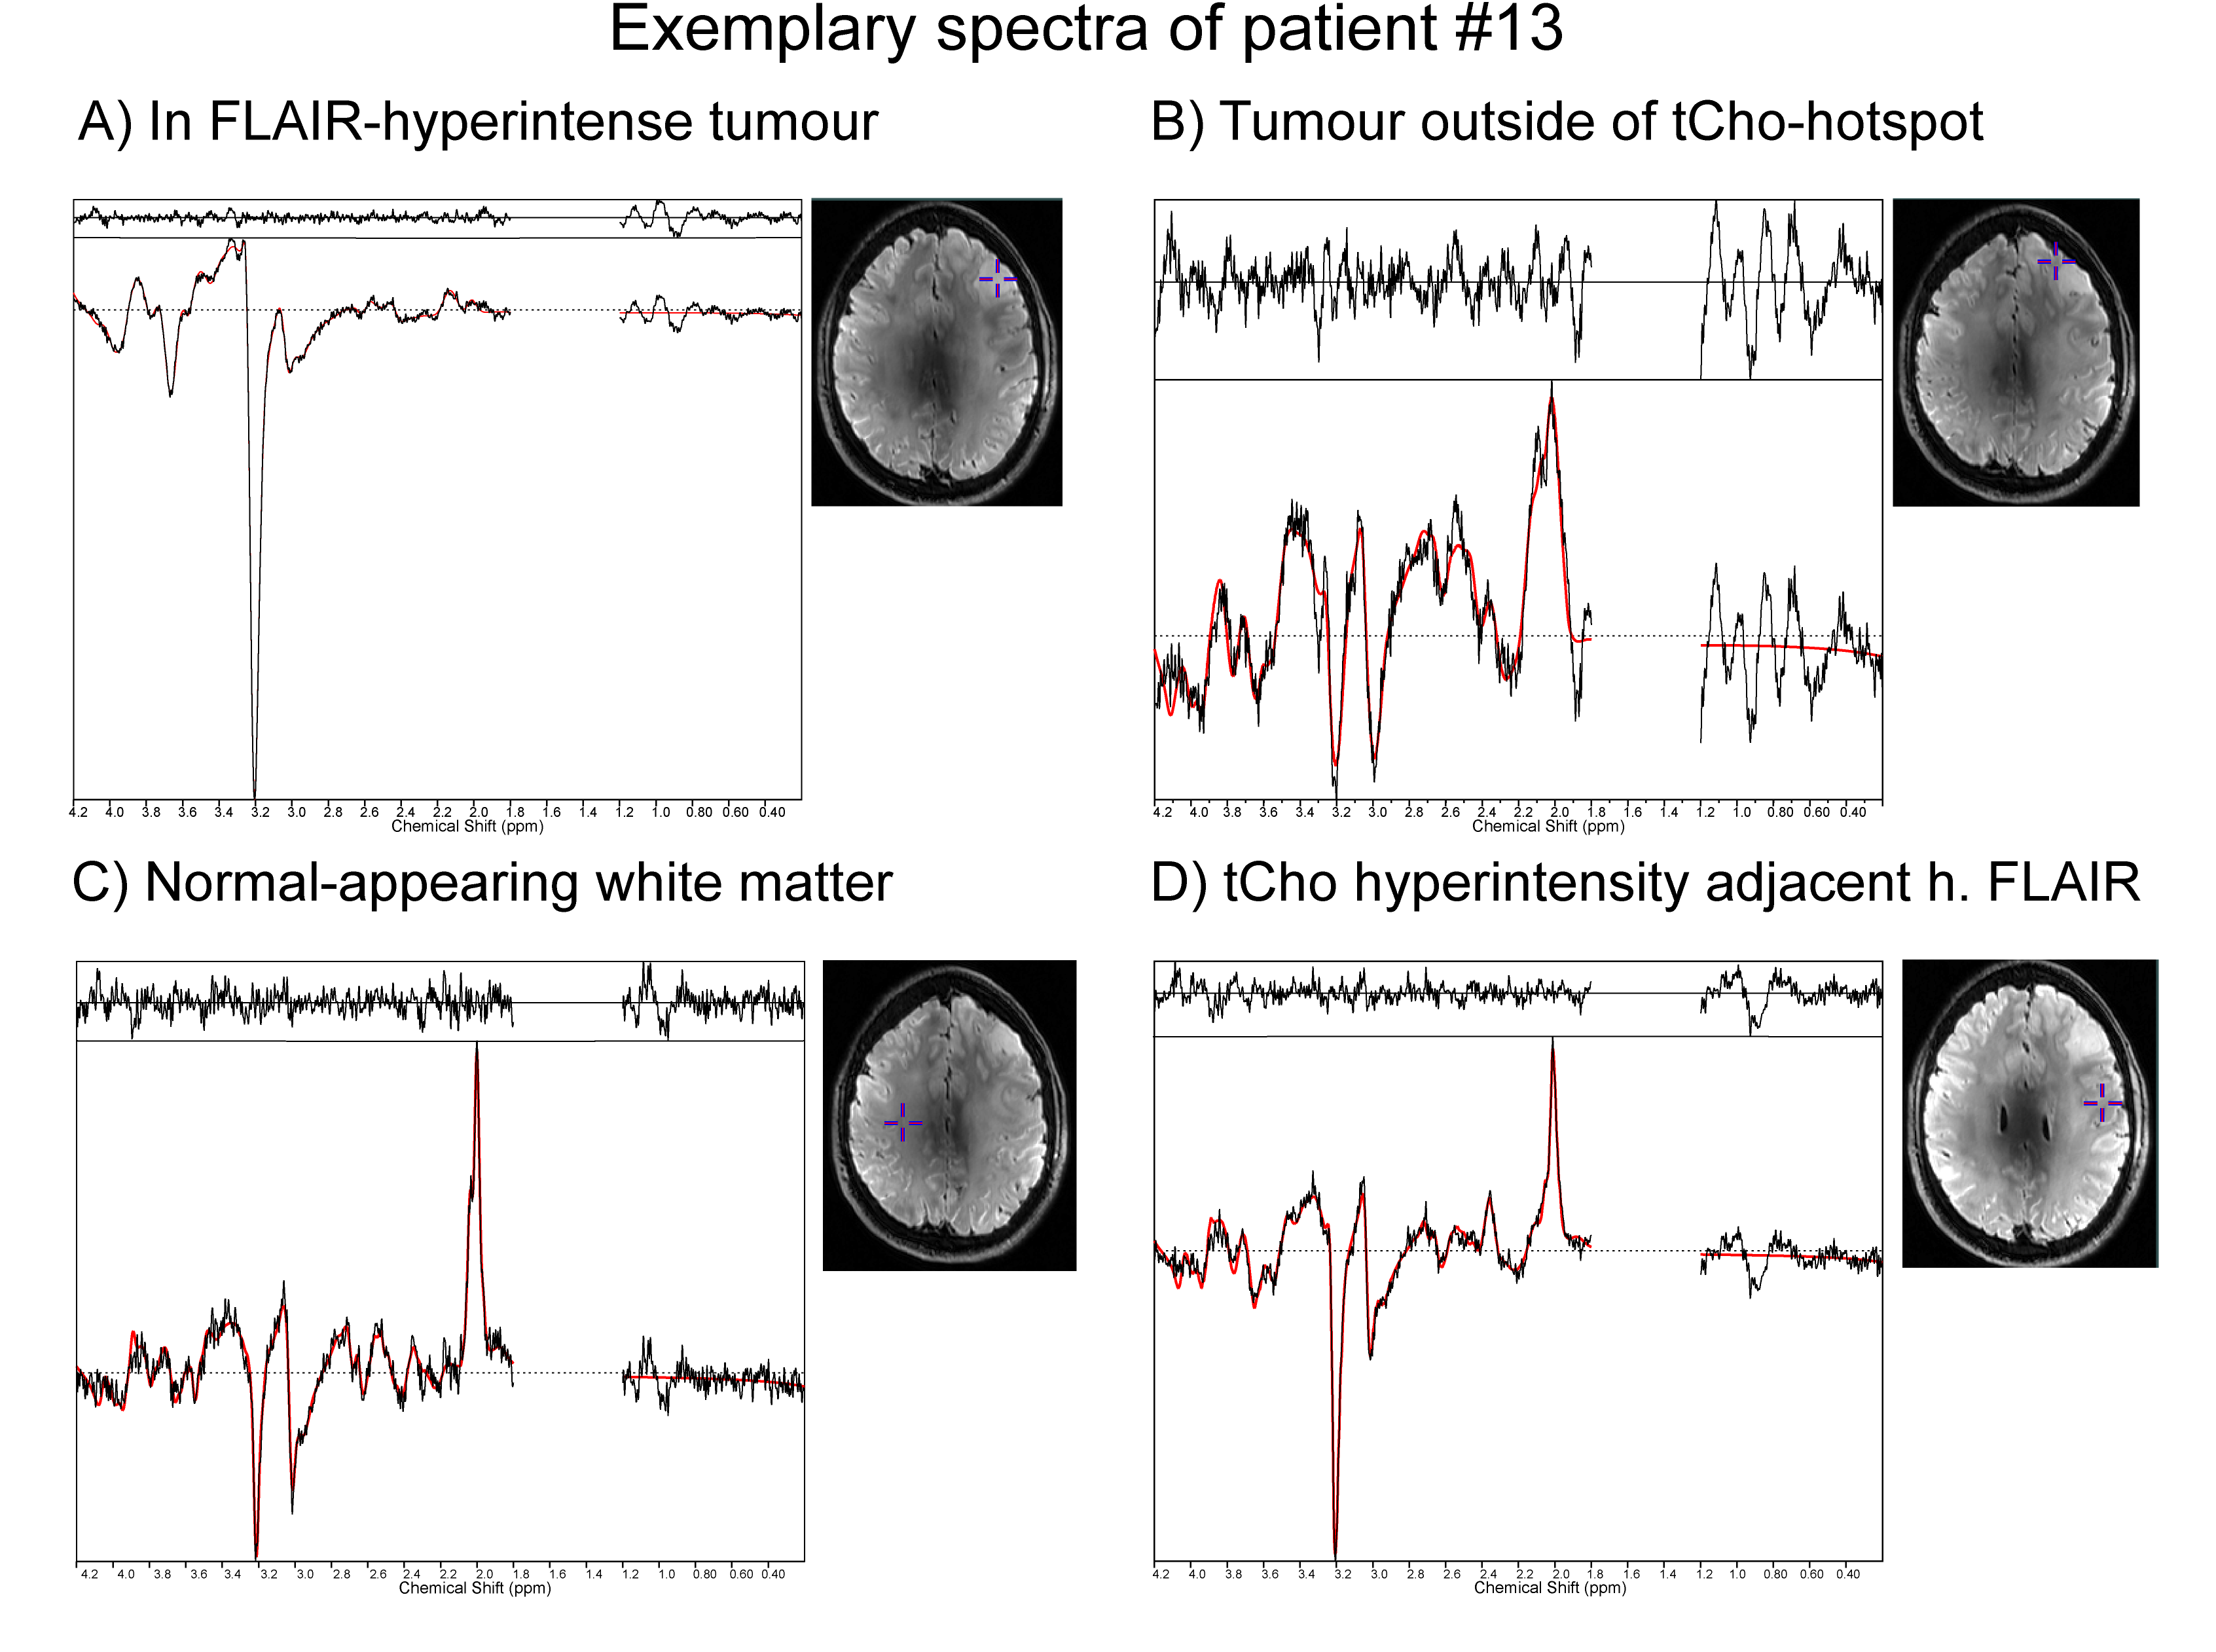
Figure 2: Example spectra in patient #13 (anaplastic astrocytoma grade
III progressing into glioblastoma grade IV) for four different regions: A –
FLAIR-hyperintense and clearly visible tumour with strong tCho signal; B –
Region of Gln increase outside of the strongest FLAIR-hyperintensity; C – normal-appearing
white matter; D – tCho-hyperintense region adjacent to the
FLAIR-hyperintensity.
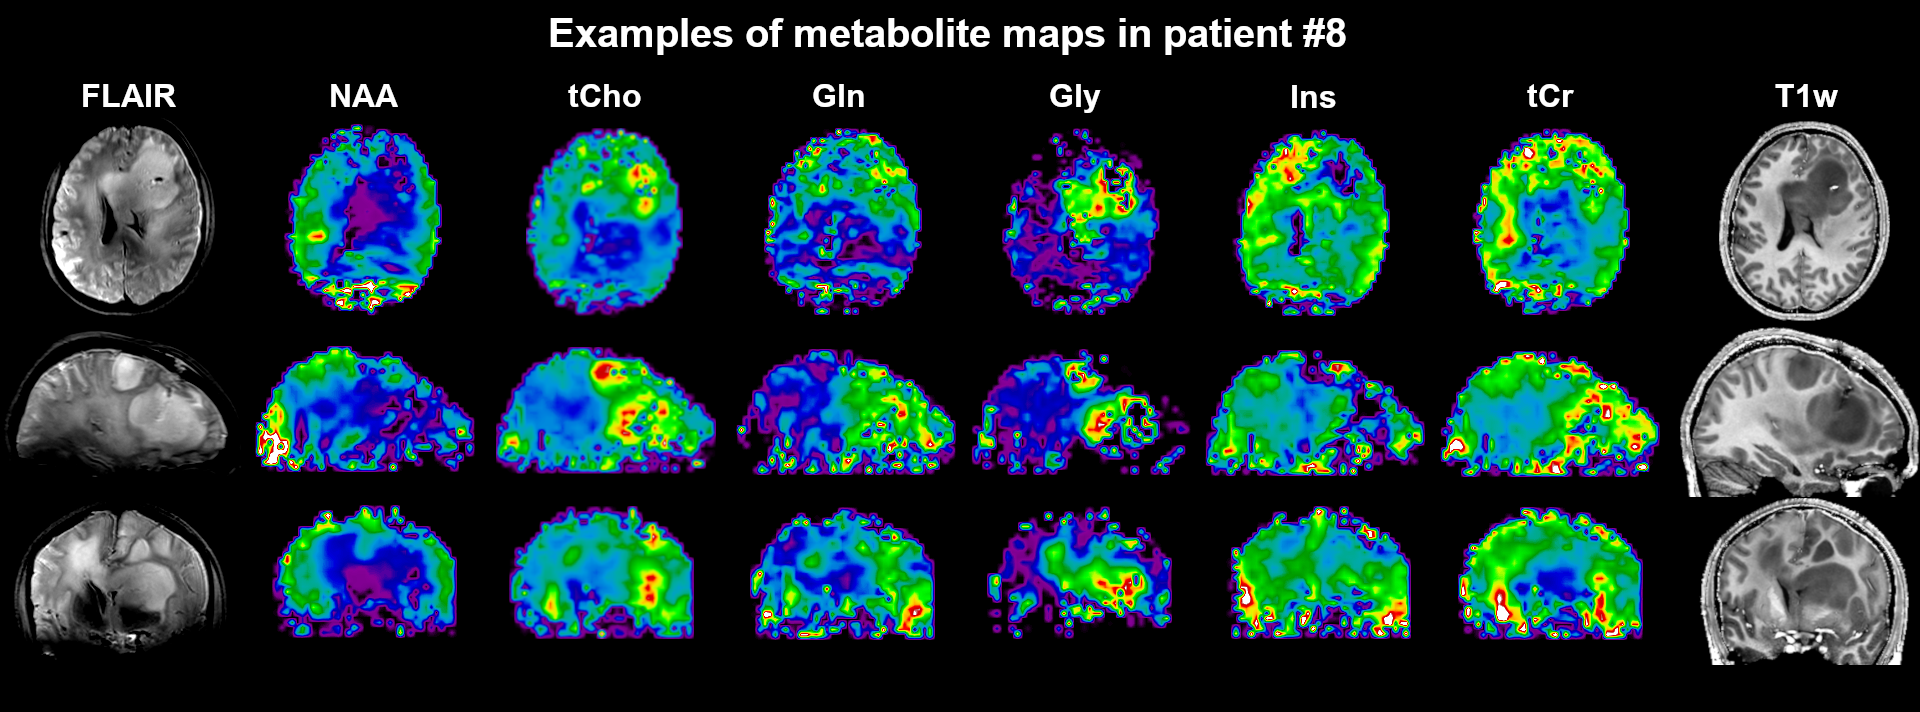
Figure 3: Examples of metabolic maps for transversal, coronal and
sagittal cuts in patient #8 (anaplastic astrocytoma grade III). Heterogeneous
behaviour of the different metabolites as well as multiple lesions are clearly
visible.
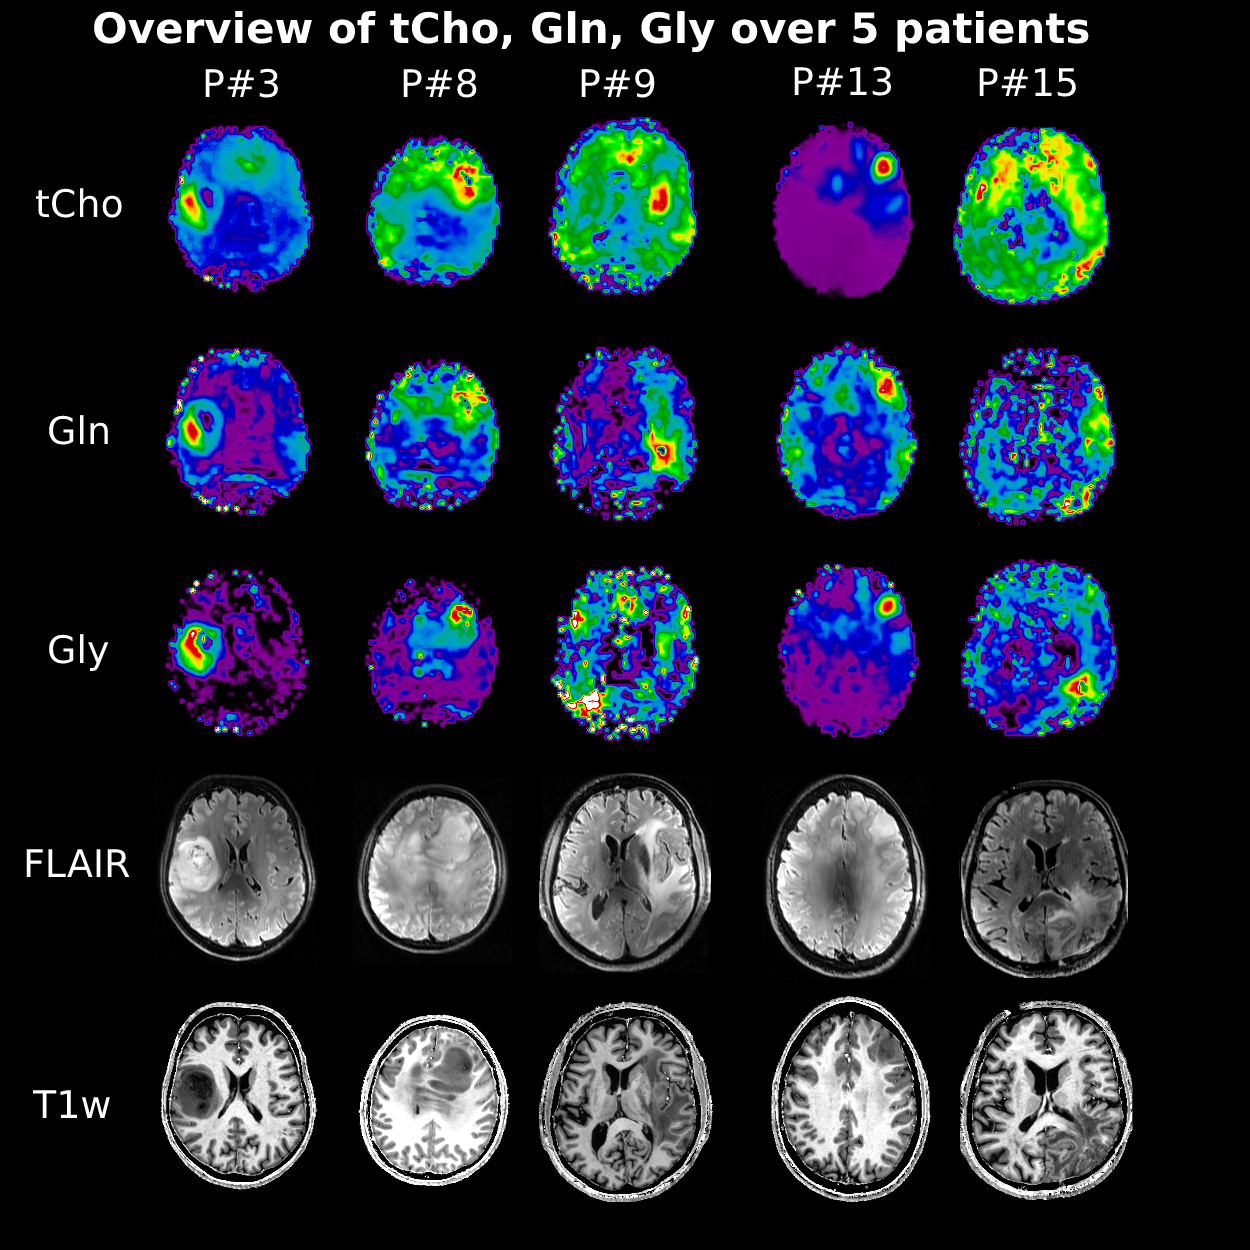
Figure 4: Metabolic overview over five patients. This figure illustrates
the ability of this MRSI approach to resolve different gliomas in different brain
locations and close to the skull. It further demonstrates the variability of
intensity changes such as in patient #3, which were so far not closer
investigated.
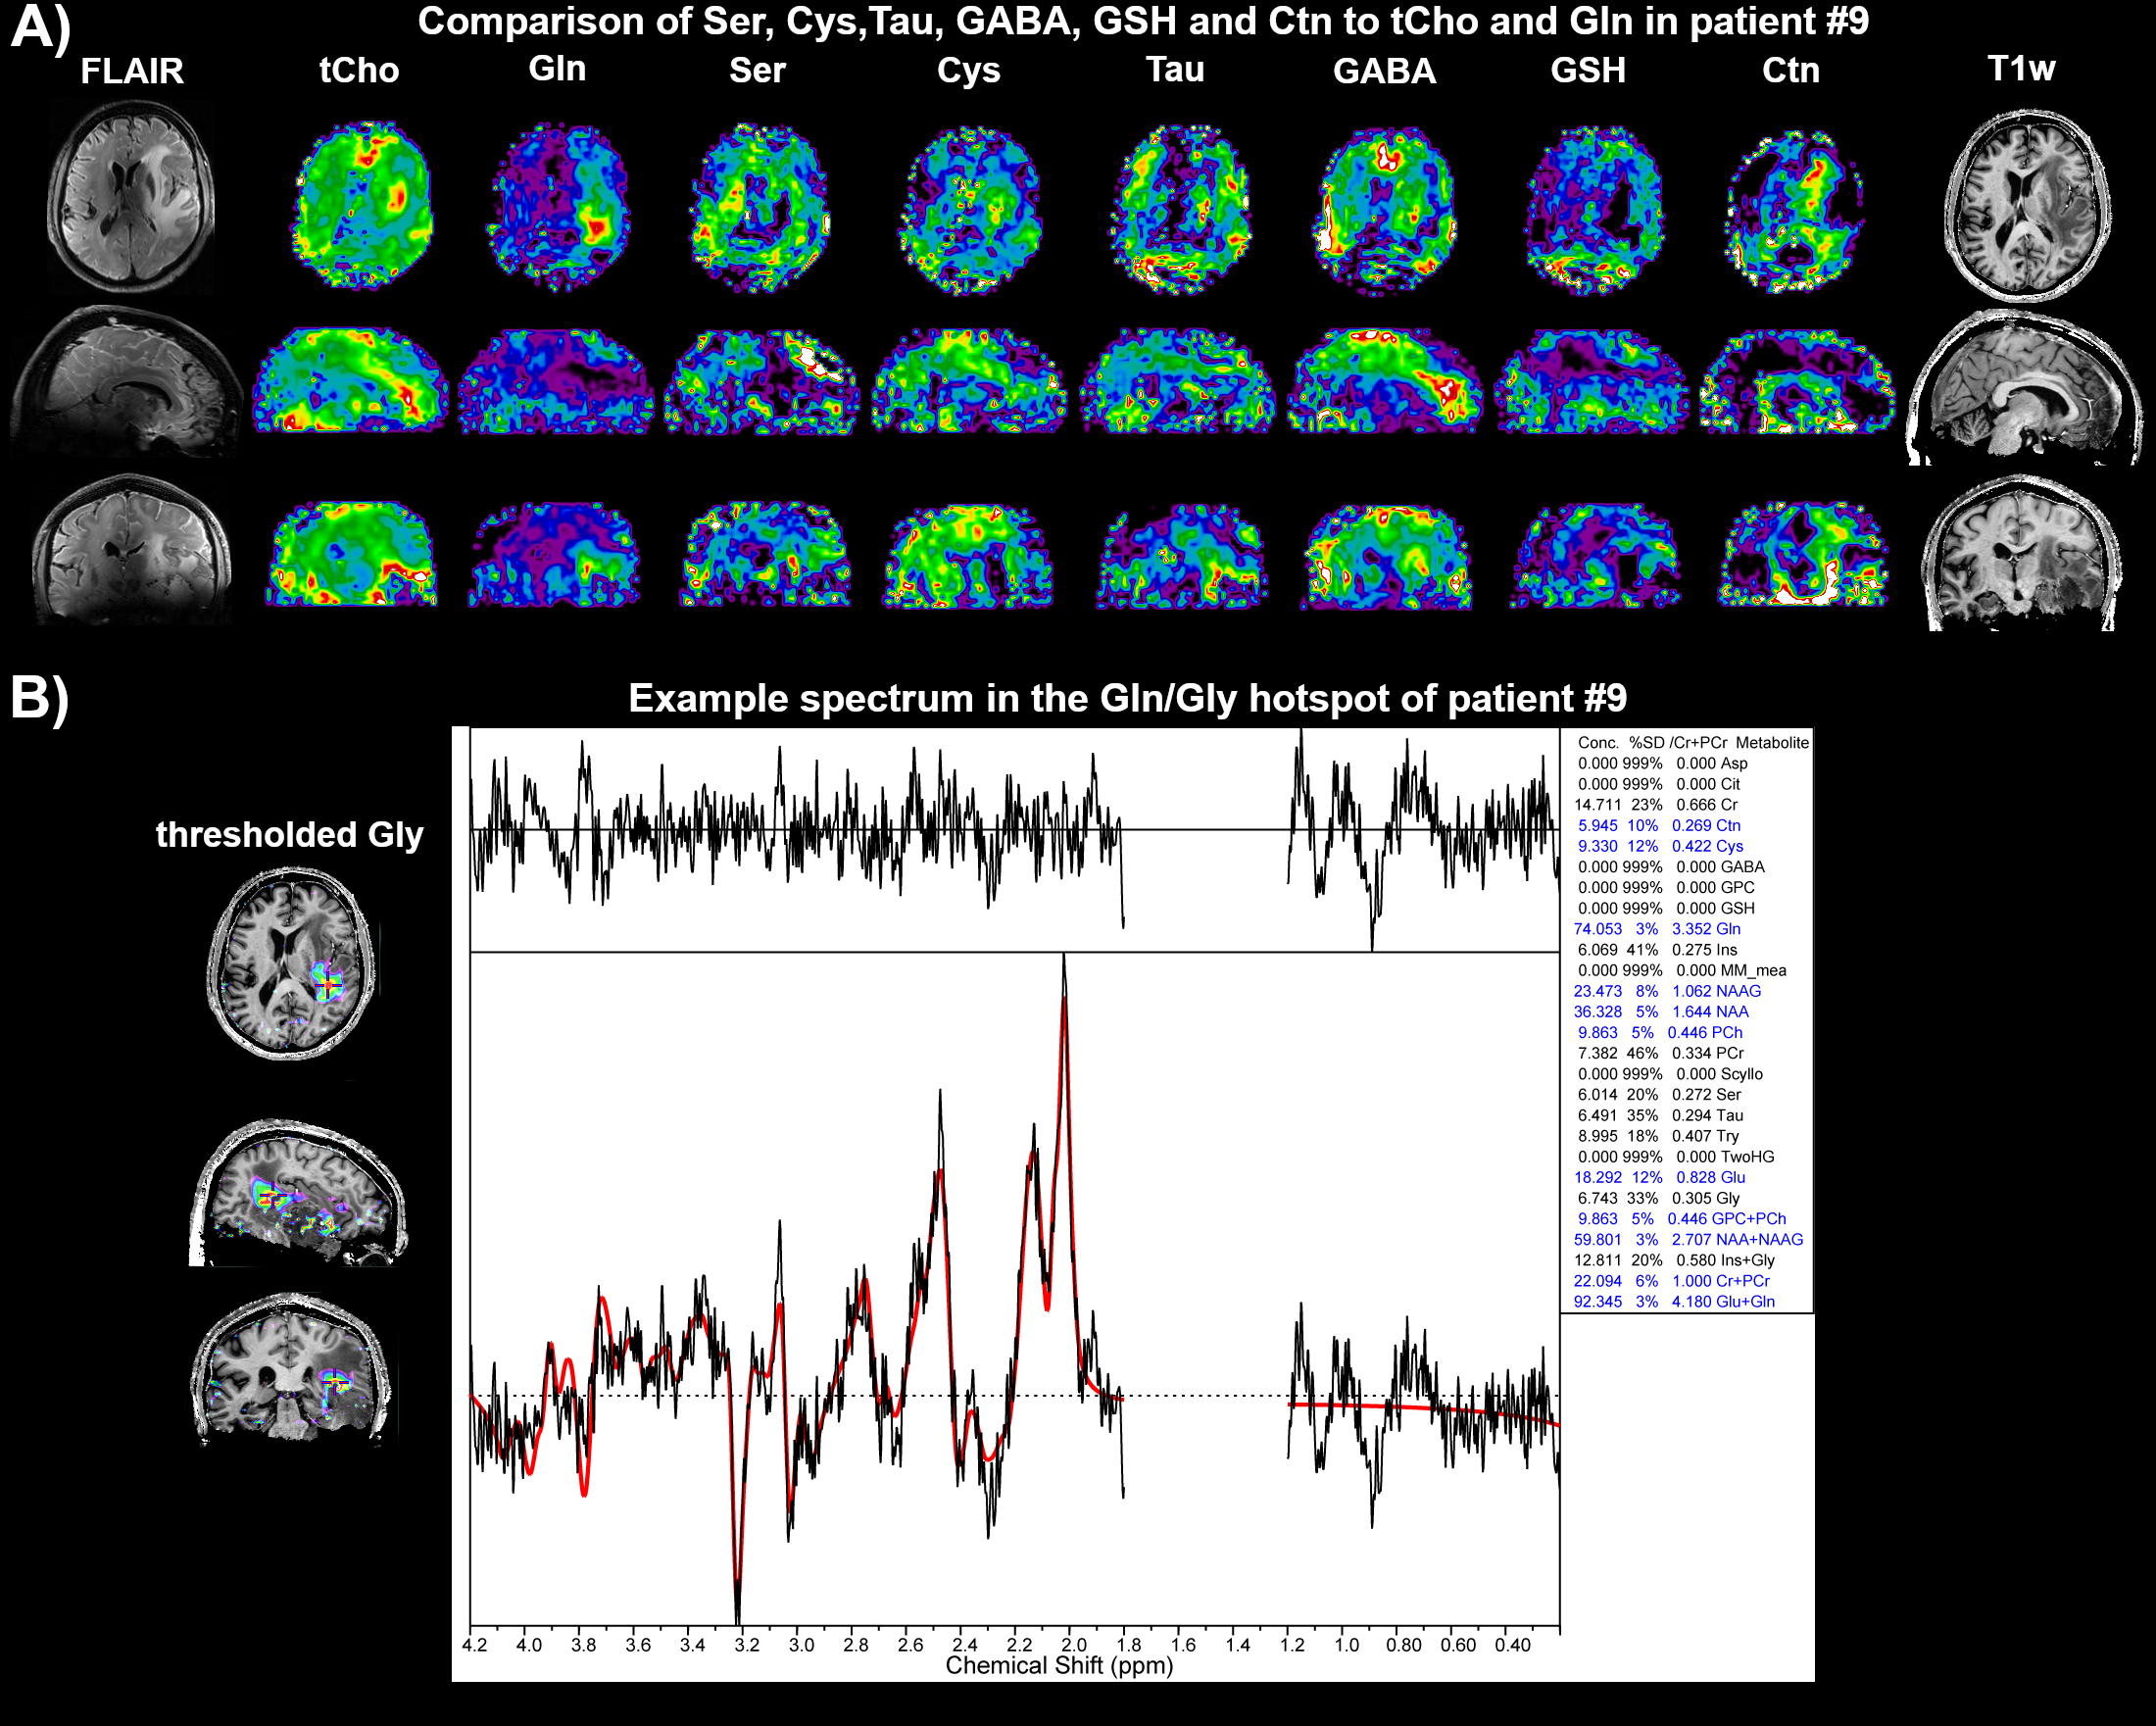
Figure 5: A - Metabolic maps of the more speculative fits compared to
tCho and Gln. B – A spectrum of the Gln and Gly hotspot showing the achieved
fitting quality.