2947
Detection of beta-hydroxybutyrate in human brain after oral administration of a ketone ester1Magnetic Resonance Spectroscopy Core, NIMH, NIH, Bethesda, MD, United States, 2NIH, NIAAA, Bethesda, MD, United States, 3Magnetic Resonance Spectroscopy Core, NIH, NIMH, Bethesda, MD, United States
Synopsis
Beta-Hydroxybutyrate (BHB) is a marker of metabolic ketosis in brain. To study ketogenic treatment spectral editing was developed to invert the signals in the 3.2-4.6 ppm spectral region for detecting BHB and co-edited signals. Using this spectral editing technique we found markedly elevated BHB signal in the human brain shortly after oral administration of 1,3-butanediol monoester of beta-hydroxybutyrate as compared to the control scan without consumption of the ketone ester.
Introduction
Fasting, high-fat low-carbohydrate “ketogenic” diet, or prolonged exercise can lead to metabolic ketosis, an alternative to low glucose availability characterized by elevated plasma and brain ketone body levels. The ketone body beta-hydroxybutyrate (BHB) is a marker of metabolic ketosis detectable by 1H-MRS. Consumption of an exogenous ketone ester such as 1,3-butanediol monoester of beta-hydroxybutyrate (1) raises levels of ketone bodies in plasma rapidly. Although in 1H-MRS BHB is overlapped by macromolecules, a spectral editing method can be used to resolve it (2; 3). We optimized an editing sequence using a narrow band editing pulse spanning the 3.2 - 4.6 ppm region. The editing pulse was designed to avoid saturating the water resonance. This was to reduce subtraction errors in the difference spectrum and thus the residual water could still be used as a frequency offset and phase reference (4). To increase quantification accuracy we simulated the BHB and other metabolites signals and analyzed in vivo data accordingly.Methods
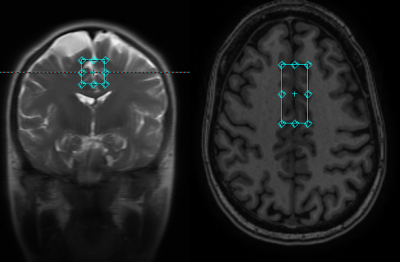
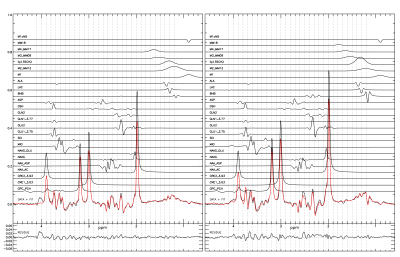
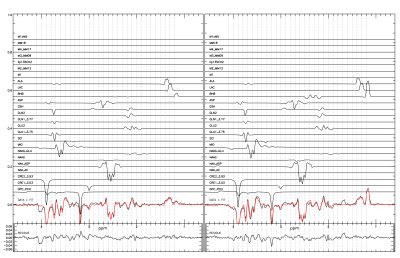
Healthy subjects were scanned in a GE clinical scanner (ESE26R3) equipped with a standard 32 channel head receive coil. A spectroscopy voxel 2*2*4.5 cm was placed in the anterior cingulate cortex (ACC) (fig 1). The GE standard probe sequence with an additional J-editing part using a customized editing pulse was implemented (5). Acquisition settings were, echo time = 80ms, TR = 1.5 s, and averages = 256, for a total scan time of 7 minutes. The editing pulse was a SLR pulse generated using MATPULSE (6) with, bandwidth = 200 Hz, pulse length = 19.2 ms, B1 strength = 124 Hz, and offset = 100 Hz to cover the 3.2-4.6 ppm spectral region. The bandwidth of the standard water suppression pulses of GE PROBE was reduced from 150 Hz to 75 Hz to avoid interference with signals resonating in the bandwidth of the editing pulse (lactate at 4.097 ppm, BHB at 4.144 ppm, and alanine at 3.775 ppm).An updated GAMMA library (7) from Duke university (8) was used to simulate metabolites reference signals using chemical shift and coupling parameters from reference (9). The simulation incorporated the effects of RF shapes for the voxel selection, J-coupling evolution, crusher gradients, and various coherence pathways (4,10). The simulated metabolites were glycerophosphocholine + phosphocholine (GPC_PCH), creatine (CRE1_3.03, CRE2_3.93), N-acetyl aspartate (NAA_AC,NAA_ASP), N-acetyl aspartatyl glutamate (NAAG, NAAG_GLU), myo-inositol (MIO), glutamate (GLU1_3.75,GLU2), glutamine (GLN1_3.77,GLN2), gluthathione (GSH), aspartate (ASP), beta-hydroxybutyrate (BHB), lactate (LAC), alanine (ALA), and various macromolecular signals. The reference signals were fitted to the non-edited, edited, and difference spectra simultaneously. A single Voigt type lineshape was used. The resonance frequencies of the metabolites were referenced to the choline peak (4).
Results and Discussion
The results from a healthy volunteer are shown here. The subject was scanned twice: 30 minutes after drinking a 1,3-butanediol monoester of beta-hydroxybutyrate solution (35mL 5M) and on a separate day without the drink. Blood BHB levels were measured using Precision Xtra finger prick strips (Abbott Diabetes Care). Plasma concentration of BHB was 0.6mM at baseline, and reached 5.2mM 30 minutes after drinking the ketone ester at the start of the scan. The study lasted 90 minutes and the BHB level decreased to 4mM. Both experiments resulted in a high SNR difference spectrum with a clearly defined BHB signal. An additional signal was found overlapping lactate and was attributed to the methyl signal of alanine. An unattributed signal was found at 1.68 ppm in the spectrum with the ketone ester which likely originated from the 1,3-butanediol moiety of the ketone ester. Using a creatine reference value of 7 mM the concentrations of BHB, lactate, and alanine after oral administration of the ketone ester were found to be 2.17 (0.035) mM, 1.11 (0.030) mM, and 0.73 (0.026) mM, respectively. Without ketone ester consumption they were 0.62 (0.043) mM, 1.23 (0.037) mM, and 0.80 (0.031), respectively. Our results demonstrated that ketone ester-induced brain BHB can be reliably measured using 1H-MRS with spectral editing.Acknowledgements
No acknowledgement found.References
(1) Andrew J. Murray, Nicholas S. Knight, Mark A. Cole, Lowri E. Cochlin, Emma Carter, Kirill Tchabanenko, Tica Pichulik, Melanie K. Gulston, Helen J. Atherton, Marie A. Schroeder, Robert M. J. Deacon, Yoshihiro Kashiwaya, M. Todd King, Robert Pawlosky, J. Nicholas P. Rawlins, Damian J. Tyler, Julian L. Griffin, Jeremy Robertson, Richard L. Veech, and Kieran Clarke, “Novel ketone diet enhances physical and cognitive performance”, FASEB J. 30, 4021–4032 (2016).
(2) Shen J, Novotny EJ, Rothman DL. “In vivo lactate and beta-hydroxybutyrate editing using a pure-phase refocusing pulse train.” Magn Reson Med. 40 ,783-8 (1998).
(3) Pan JW, Telang FW, Lee JH, de Graaf RA, Rothman DL, Stein DT, Hetherington HP, “Measurement of b-hydroxybutyrate in acute hyperketonemia in human brain”, Journal of Neurochemistry, 79, 539-544, (2001).
(4) van der Veen JW, Marenco S, Berman KF, Shen J. “Retrospective correction of frequency drift in spectral editing: The GABA editing example.” NMR in Biomedicine. 30, 3725 (2017). https://doi.org/10.1002/nbm.3725
(5) Sailasuta N, LeRoux P, Hurd R, Wang P, Sachs N, Ketter T. Detection of cerebral gamma-aminobutyric acid (GABA) in bipolar disorder patients and healthy volunteers at 3T. Proceedings of the 9th Annual Meeting ISMRM, Glasgow, Scotland, UK, 1011, (2001).
(6) Matson B, an integrated program for amplitude-modulated rf pulse generation and re-mapping with shaped gradients, Magnetic Resonance Imaging, 12, 205-1225, (1994).
(7) Smith SA, Levante TO, Meier BH, Ernst RR, Computer Simulations in Magnetic Resonance; An Object Oriented Programming Approach. J Magn Reson Ser, A 106, 75-105 (1994).
(8) http://scion.duhs.duke.edu/vespa/gamma
(9) de Graaf RA. In vivo NMR Spectroscopy, Principles and Techniques, 2nd edition Wiley: Chichester, West Sussex, England, pp 45-78 (2007).
(10) van der Veen JW, Spectral Simulations in GAMMA: Gradients & Soft Pulses, Weekend Course Advanced Spectroscopy: Part 2, Sunday, 17 June 2018, Joint Annual Meeting ISMRM-ESMRMB, 16-21 June 2018 Paris, France
Figures


