2946
Evaluating Apparent T2* values of Metabolites in Healthy Adults and Youths using TIDEL-COSY1Radiation Oncology, UT Southwestern Medical Center, Dallas, TX, United States, 2Human Magnetic Resonance Center, UMass, Amherst, MA, United States, 3UCLA, Los Angeles, CA, United States
Synopsis
For decades, one-dimensional (1D) spectroscopy has aided in the diagnosis of several pathologies. However, 1D approaches suffer from severe spectral overlap, possibly limiting their application. Two-dimensional (2D) spectroscopy allows for greater spectral separation, and many studies have successfully quantified metabolites with the localized correlated spectroscopy (L-COSY). Here, we combine the L-COSY technique with a T2* weighted deconvolution (TIDE) approach and develop the TIDEL-COSY method. We show the capability of the novel TIDEL-COSY method and compare the apparent T2* values between healthy youths and adults for a variety of metabolites.
Introduction
Magnetic resonance spectroscopy (MRS) can quantify several biochemicals in the human brain, and has proven to be invaluable for the diagnosis of cancer, metabolic disorders, and several other pathologies. While one-dimensional (1D) spectroscopy excels at a myriad of tasks, it suffers from severe spectral overlap, possibly limiting its application. Two-dimensional (2D) spectroscopy allows for greater spectral separation, and many studies have successfully quantified metabolites with the localized correlated spectroscopy (L-COSY)[1] method. Recently, it has been demonstrated that spectral signals can be separated by their T2* values by using a T2* weighted deconvolution (TIDE) approach [2]. We hypothesize that the TIDE method can be applied to in vivo L-COSY measurements, a technique termed TIDEL-COSY, to yield important T2* information. We apply this novel method to assess the T2* changes between healthy youths and adults for several major metabolites.Methods
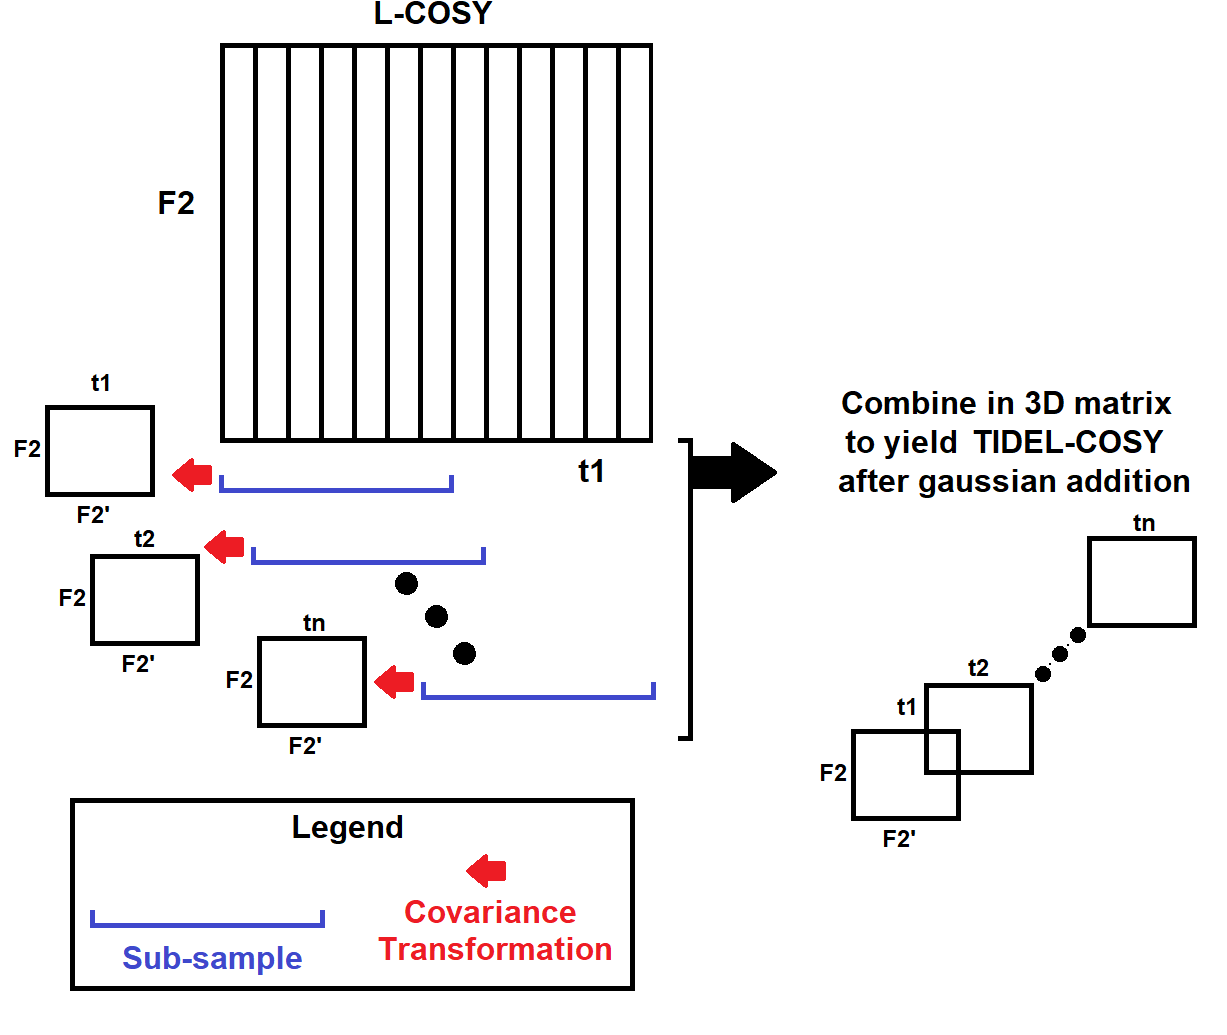
The L-COSY acquisition, which utilizes a 90°-180°-t1-90°-t2 pulse sequence, was used to obtain 14 healthy adult (mean age = 54.8 years) and 14 healthy youths (mean age = 16.2 years) in vivo data on a 3T scanner from the anterior cingular cortex. The experimental parameters were as follows: TE=30ms, TR = 2s, t1 points = 100, t2 points = 2048, and spectral bandwidths 2000Hz (F2) and 1250Hz (F1), respectively. The TIDE method, a schematic of which is shown in Fig. 1, was then applied: 1) The data were brought into the F2-t1 dimension; 2) A covariance transformation was applied to a subset of the t1 data; 3) The covariance sub-spectra were combined with Gaussian weighting to yield final covariance spectra for each time point. The TIDE approach yields a 3D matrix in the form of (F2-F2’-t), where F2 and F2’ are the direct and indirect spectral dimensions, respectively, and t represents the signal variation based on the acquired t1 points. Signal intensities from major metabolite spectral regions were quantified for each time point for all healthy subjects. These intensities were fit using an exponential function of the form: S = A*exp(-TE/T2*) to yield the apparent T2* values of the metabolites. A Student’s two-tailed t-test was used to determine if there were any significant differences between the healthy and adult subjects, defined as p < 0.05.Results
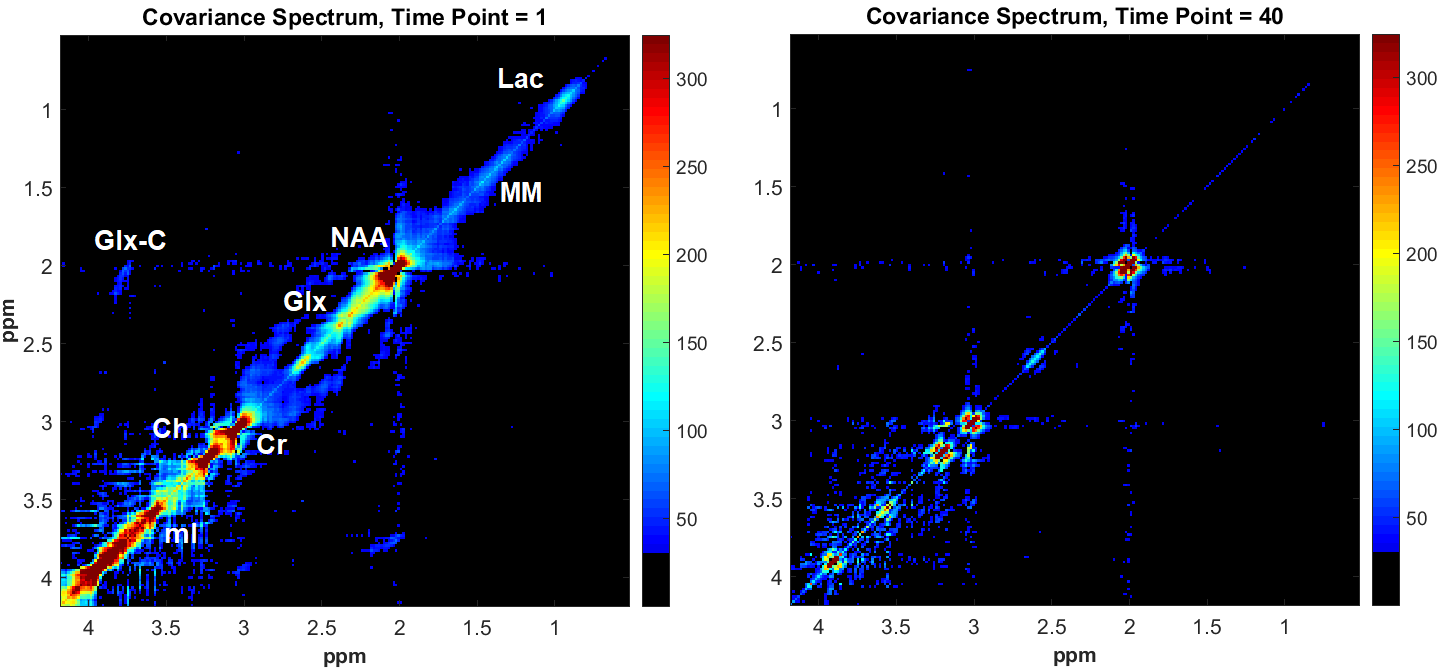
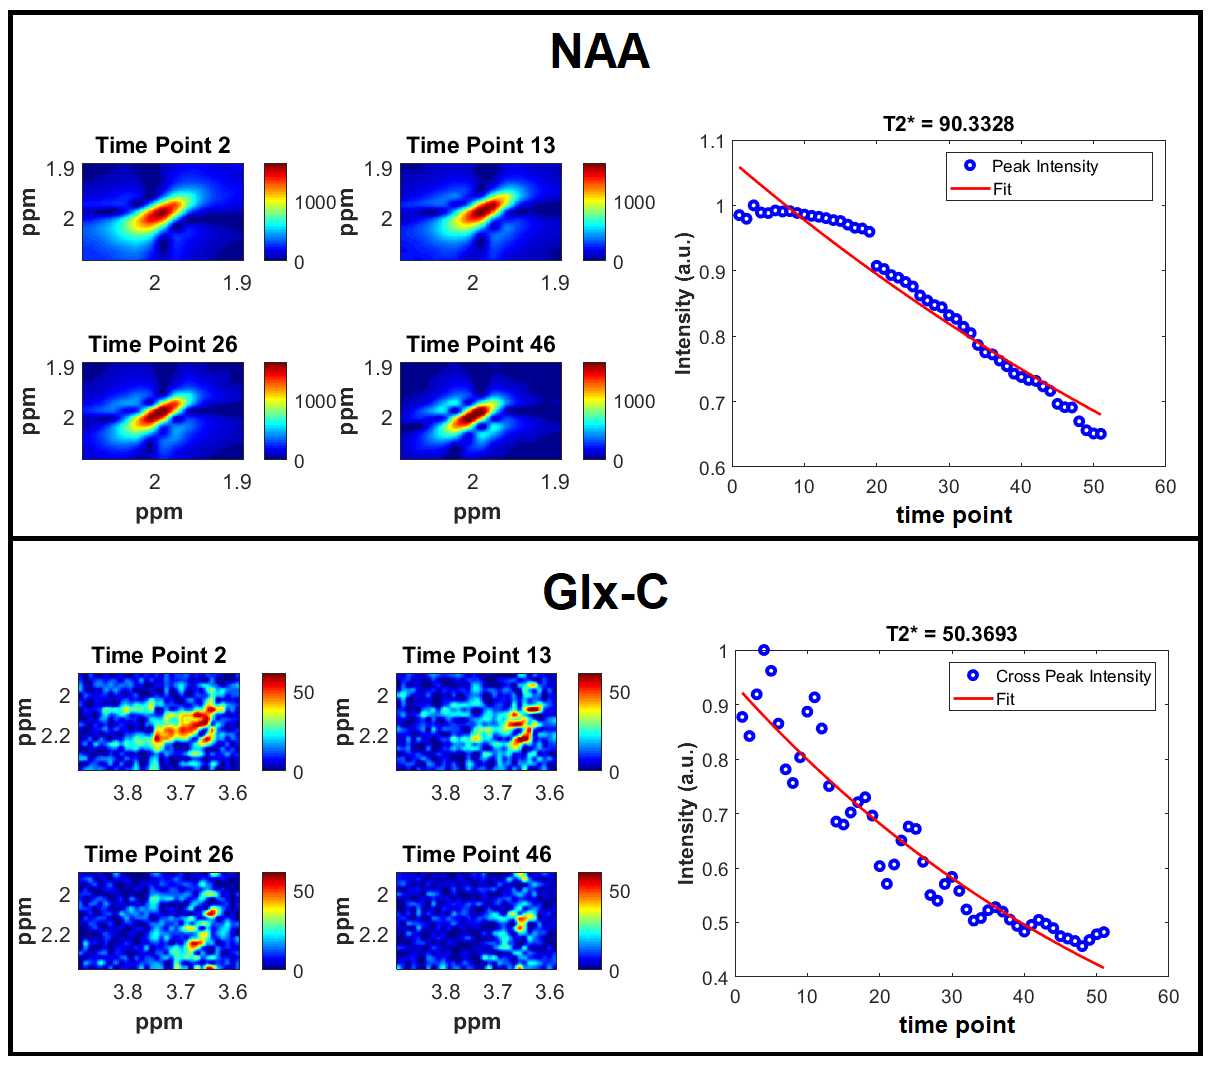
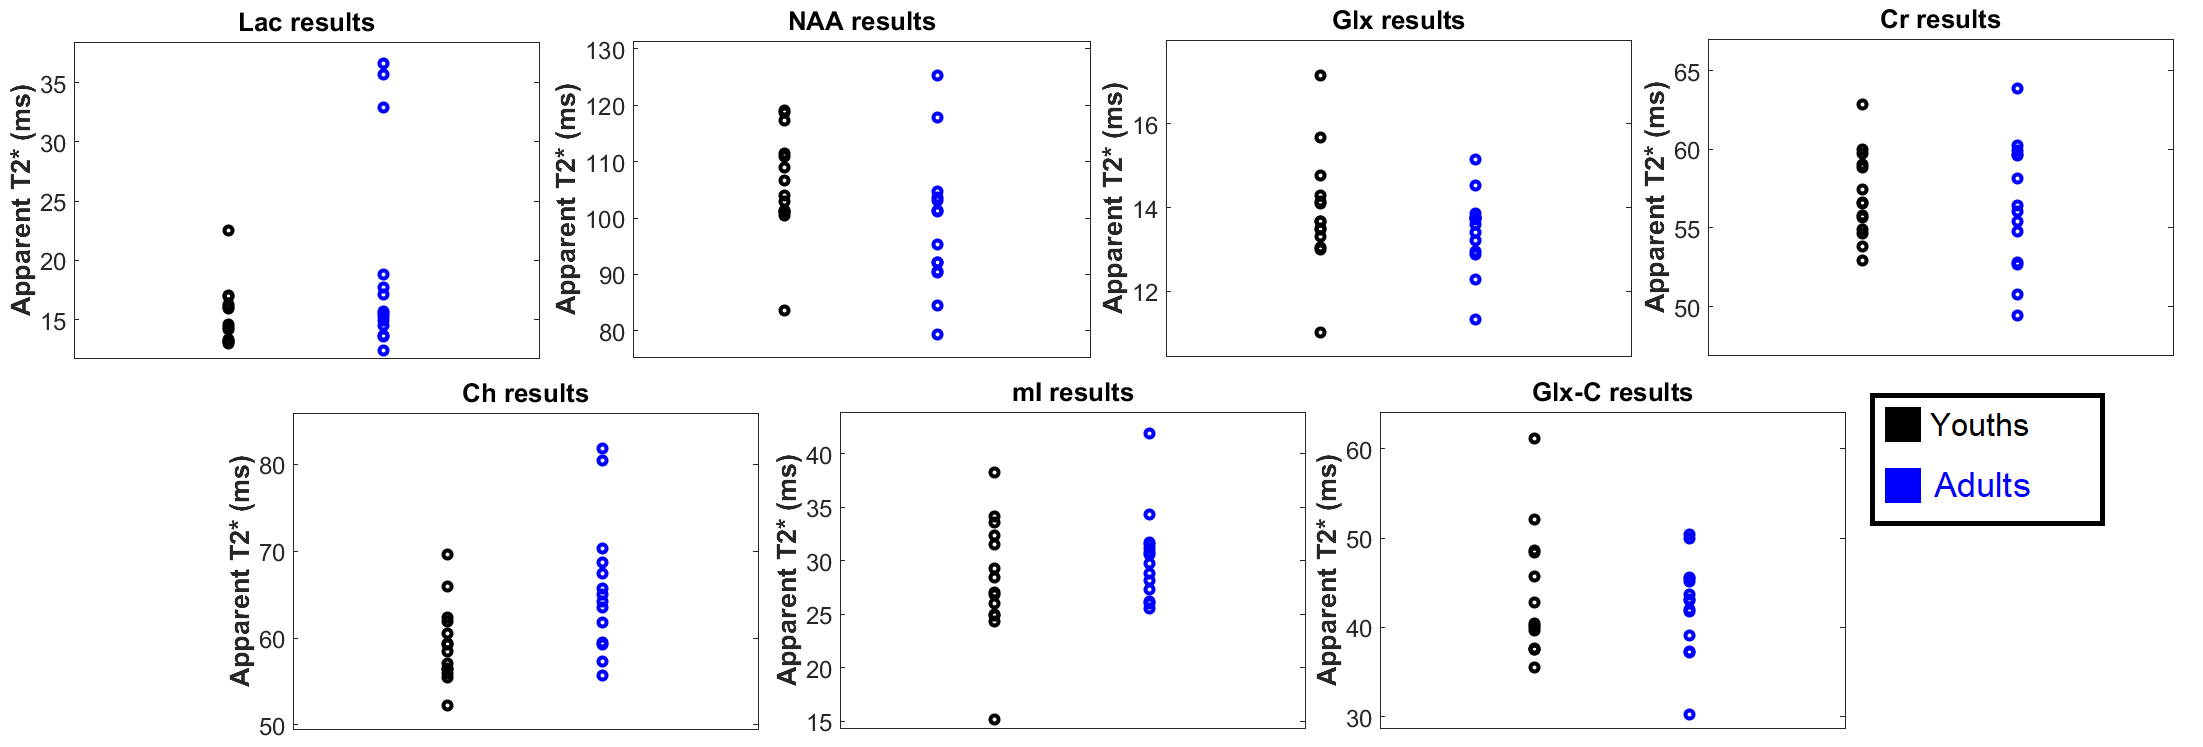
Figure 2 shows covariance spectra taken from a healthy adult from the 1st time point and the 46th time point. Signal loss is apparent in the later time point due to T2* signal losses. The major metabolites, including lactate (Lac), macromolecules (MM), N-acetyl aspartate (NAA), glutamate and glutamine (Glx), creatine 3.0 (Cr), choline (Ch), myo-Inositol (mI), and the Glx cross-peak (Glx-C) can easily be visualized. The signal decay for NAA and Glx-C for a healthy adult is shown in Figure 3. The peaks are shown for the different time points. Fitting these curves using an exponential yields the apparent T2* values for the metabolite. Finally, Figure 4 shows the apparent T2* measurements for all of the healthy subjects. No significant differences were observed, except for Ch, where the two-tailed t-test had p=0.0132.Discussion and Conclusions
In this study we demonstrate a novel technique that yields apparent T2* values from L-COSY experiments. The major advantage with this method is that the T2* values are readily available without the need for additional acquisitions. Furthermore, depending on the metabolite of interest, the TIDEL-COSY approach can be used to highlight certain signals. However, the robustness and accuracy of the apparent T2* values needs to be assessed in the future. In particular, more accurate T2* measurements can be obtained by first fitting the covariance peaks and then fitting the decay with an exponential function. After further refinement, the apparent T2* values, in combination with metabolite concentrations, may provide more specific biomarkers for several pathologies.Acknowledgements
No acknowledgement found.References
[1] Thomas, M.A., et al. Magnetic Resonance in Medicine 46, no. 1 (2001): 58-67
[2] Manu, V. S., et al. Scientific reports 9, no. 1 (2019): 8225
Figures