2945
Effects of Housing, Age, Strain, and Signal to Noise Ratio on Magnetic Resonance Spectroscopy in the Rat Brain1Physical Sciences, Sunnybrook Research Institute, Toronto, ON, Canada, 2Medical Biophysics, University of Toronto, Toronto, ON, Canada, 3Neurosurgery and Paediatric Neurosurgery, Medical University of Lublin, Lublin, Poland
Synopsis
Changes in metabolite levels as a result of treatment can be quite small. This study investigated the variability of MRS detectable metabolites so that the effects relating to the treatment would not be confounded by other experimental factors. A four-way ANOVA was used to separate the effects of differences in housing conditions (single housing, pairs, or enriched environment) as well as age (5-15 weeks), strain (Long Evans vs Sprague Dawley), and SNR. Significant changes in MRS were observed due to age, strain, and SNR, but any changes due to housing conditions were small in comparison.
Introduction
Longitudinal magnetic resonance spectroscopy (MRS) experiments often involve treatments which require rats to be housed separately rather than in pairs. The changes in MRS detectable metabolites can be quite small. In order to quantify them it is important to minimize or control for as many other variables as possible, so that the effects relating to the treatment are not confounded by other experimental factors. The purpose of this study was to investigate the variability in MRS resulting from housing conditions (rats housed either singly in a normal cage, in pairs in a normal cage, or in pairs in an enriched environment), age, strain, and signal to noise ratio (SNR).Methods
12 male Sprague Dawley (SD) rats, age 5-11 weeks, and 24 male Long Evans (LE) rats, aged 7-15 weeks, initially kept in pairs in normal cages, were housed either singly (n=12), in pairs in a normal cage (n=12), or in pairs in an enriched cage (n=12). MRS was obtained 0, 2, 4, and 6 weeks following the change in housing, in both cortex and hippocampus using a PRESS sequence: TE/TR 16/2500ms, 600 averages, 2048 points, 4kHz bandwidth, voxel size 3.5x1.25x4.0 mm3 (cortex) or 4.5x1.4.x2.0 mm3 (hippocampus). MRS spectra were analyzed using LCModel1 with a basis set generated using the Magnetic Resonance Spectrum Simulator2 (MARSS) and a measured macromolecular baseline. Metabolites were selected for further analysis based on having at least 20% of their Cramer Rao Lower Bounds < 20, and those with significant negative correlations were combined. A four-way analysis of variance (ANOVA) was used to separate the effects of age, strain, SNR, and housing type where age was measured in weeks, strain referred to LE or SD, and SNR was split into quartiles. Effects with p-values < 0.05 following Bonferroni correction were considered to be statistically significant.Results
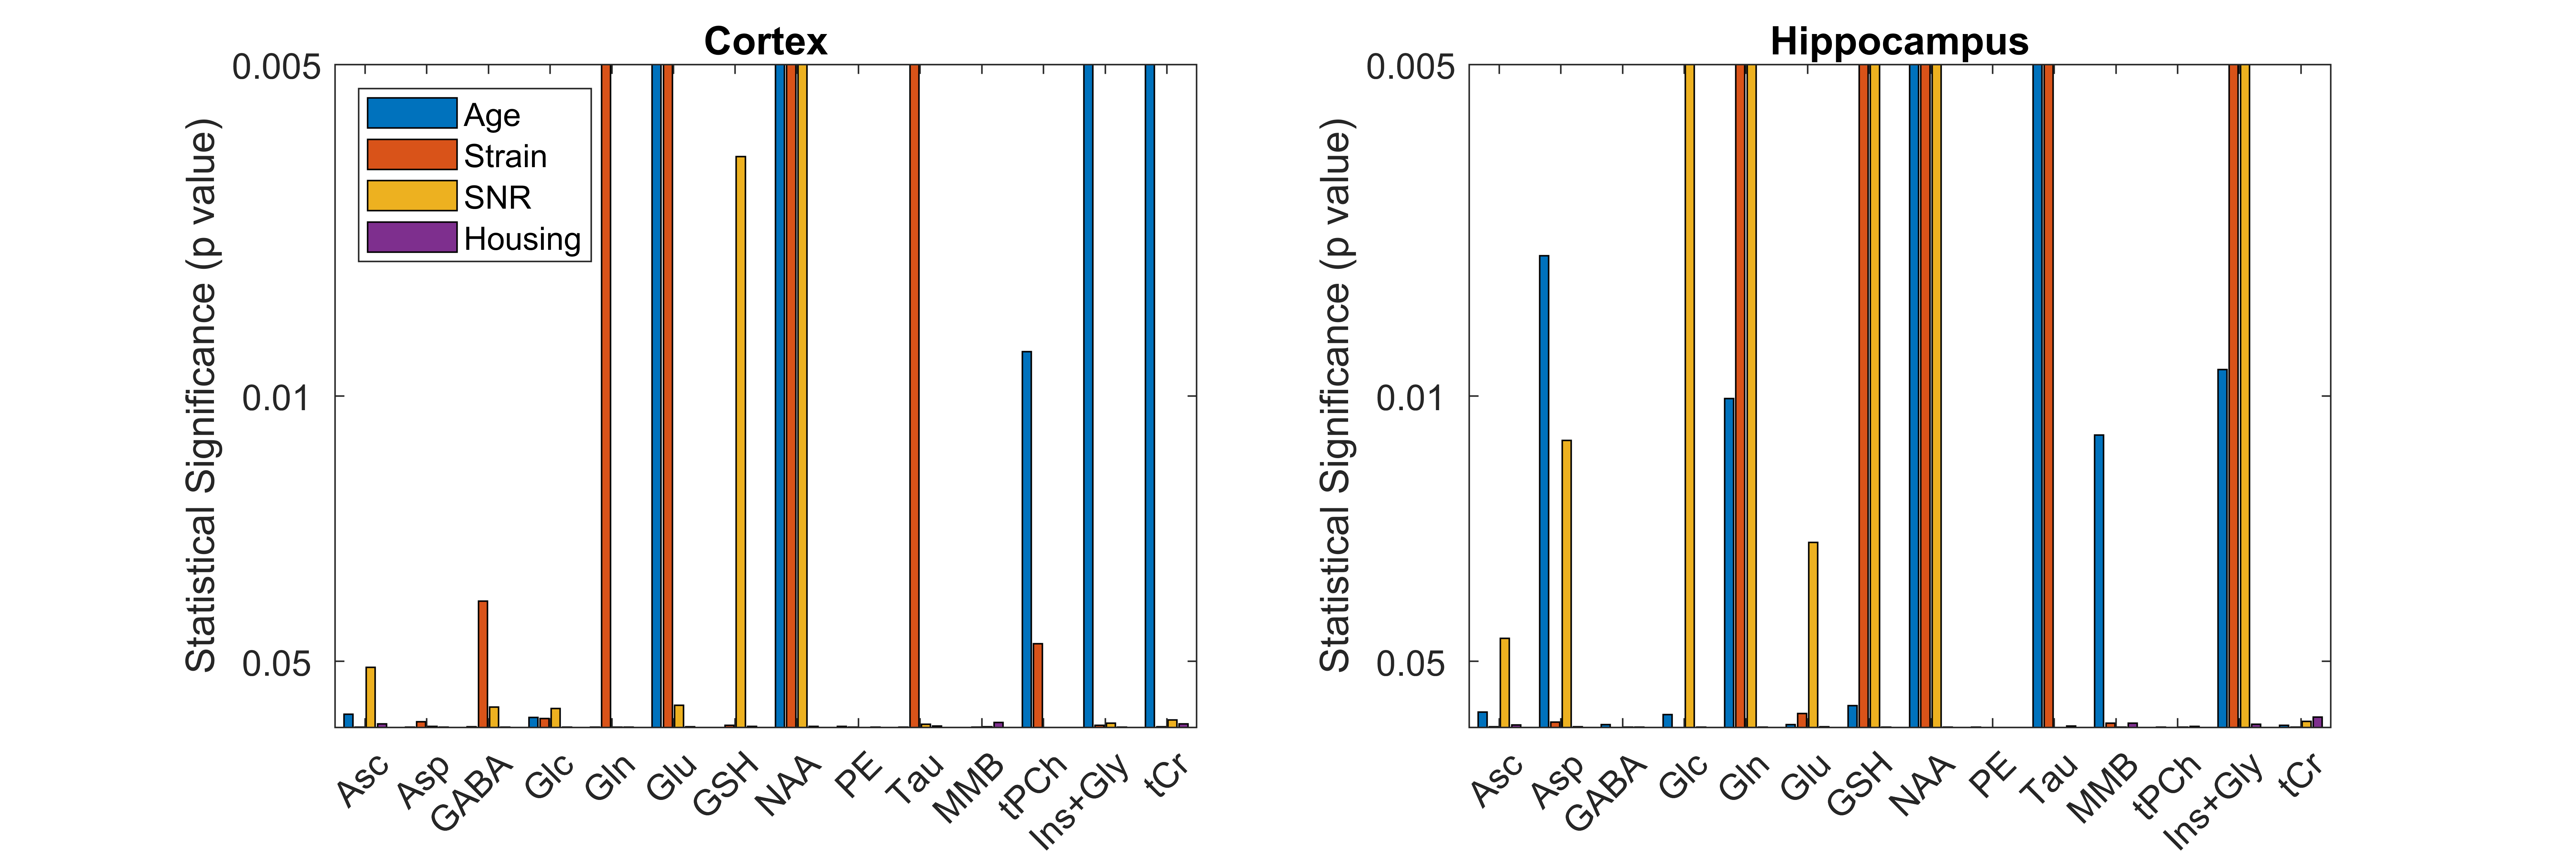
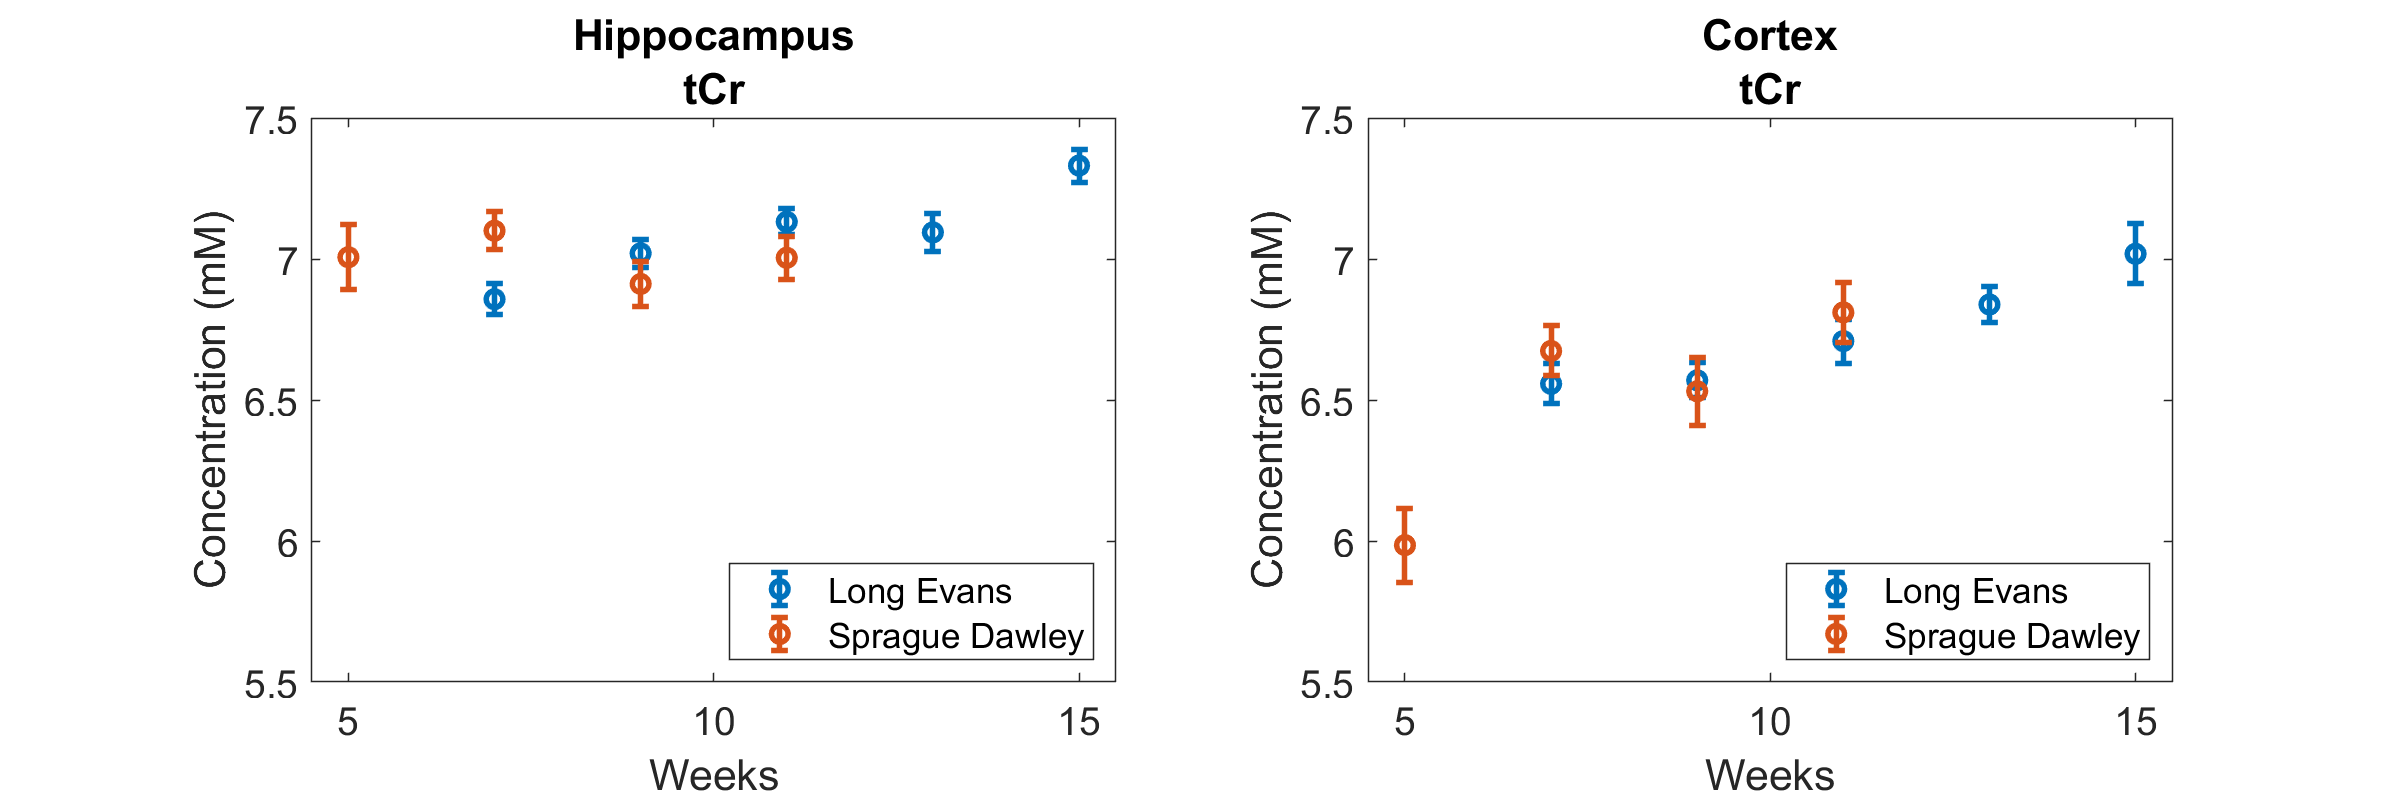
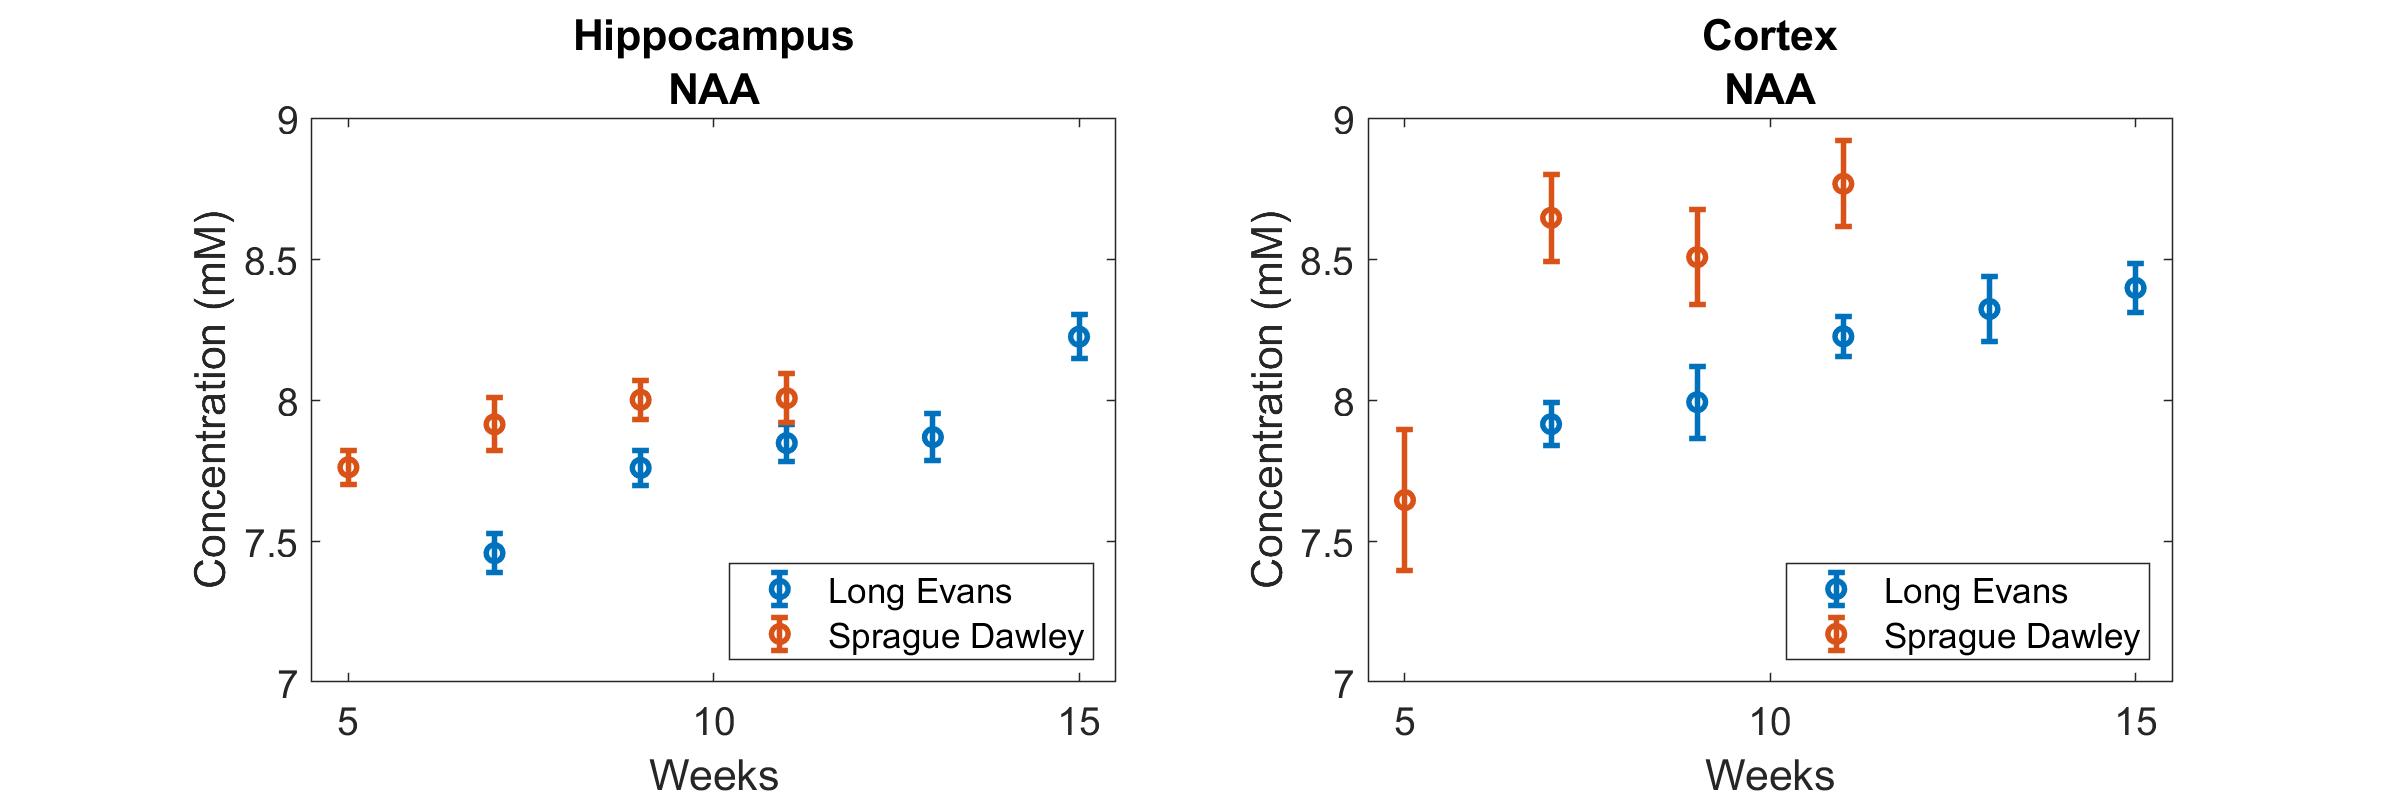
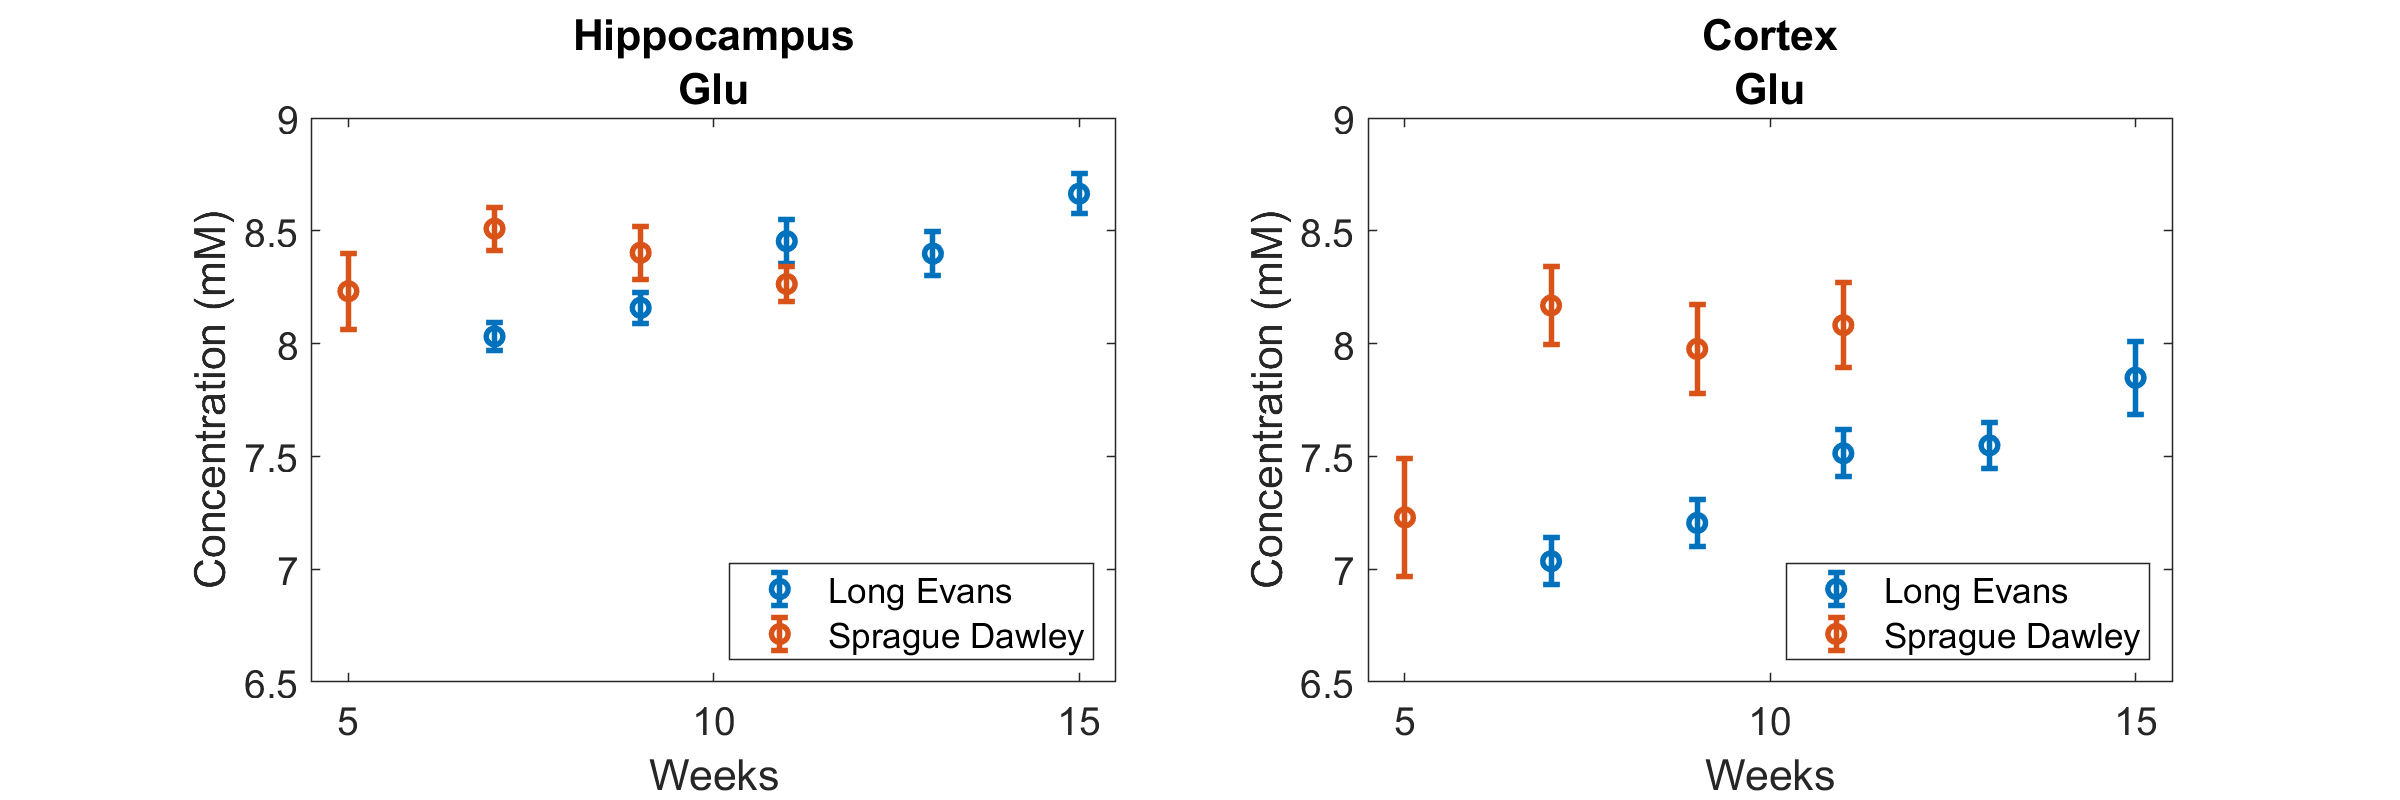
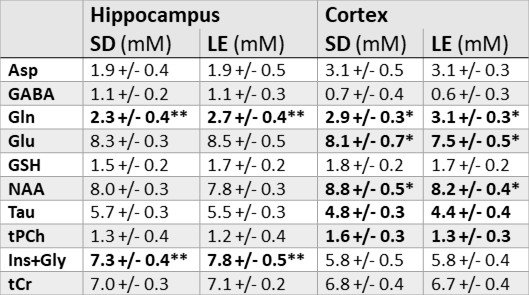
The following metabolites and combinations were selected for analysis: Ascorbate (Asc), aspartate (Asp), γ-aminobutyric acid (GABA), glucose (Glc), glutamine (Gln), glutamate (Glu), glutathione (GSH), N-acetyl aspartate (NAA), phosphoethanolamine (PE), taurine (Tau), macromolecules (MMB), glycerophosphocholine + phosphocholine (tPCh), myo-inositol + glycine (Ins+Gly), and creatine + phosphocreatine (tCr). ANOVA results are shown in Figure 1, where the y-axis has been inverted so that statistical significance will be easier to observe. There was no significant effect of housing on any of the metabolites investigated. Age, strain, and SNR all had significant effects which varied depending on brain region and metabolite. Significant effects of SNR on metabolite concentrations were primarily slight decreases in concentration as SNR increased, except for NAA which increased slightly with SNR (from 8.1±0.7mM to 8.4±0.3mM in cortex, and from 7.7±0.4mM to 8.0±0.3mM in hippocampus). Total creatine was similar between strains, but did increase with age in the cortex (Fig. 2). NAA increased with age in both regions, and was also higher in SD than in LE (Fig. 3). Glutamate showed an increase with age in the LE rats, but had a different pattern of increase in the SD rats (Fig. 4). Table 1 shows concentrations at 11 weeks for all metabolites analyzed in both brain regions and both strains.Discussion
While it remains possible that there are subtle effects of different types of rat housing that are observable on MRS, any such effects were overwhelmed by the variability in other experimental parameters. Due to logistical constraints, experiments were conducted on groups of 12 animals at a time. The original plan was to start scanning each cohort at the same age (5 weeks), however technical problems prevented the 2nd & 3rd sets of experiments from starting on time. Several metabolites were present in very different concentrations in the 5 week old SD rats, however postponing the start of the experiment until they were 7 weeks old would have caused a different problem: by 11 weeks of age these rats averaged 550±33g, and by 13 weeks some of them may have been too large to fit in the bore of the scanner. The LE rats grow more slowly and were only 410±36g at 11 weeks, making it more feasible to conduct a long experiment. The differences in measured concentration resulting from changes in SNR are most likely due to the improved overall detection of metabolites at higher SNR. Increasing SNR will have the greatest effect on the ability of algorithms like LCModel to quantify metabolites with complicated spectra and significant overlap with other spectra. In this study, all of the metabolites which showed significant decreases in measured concentration with increasing SNR had relatively complex spectra. The only metabolite which increased in concentration with increasing SNR was NAA, likely due to corresponding decreases in the measured concentration of Glu, Gln and GSH which all have complex spectra overlapping that of NAA.Conclusions
Any changes in MRS due to differences in housing conditions in rats are small in comparison to those resulting from differences in age, strain, and SNR. When planning longitudinal studies, it is critically important to control for as many factors as possible, and control groups are of particular importance as changes in neurochemistry with age mean that baseline measurements cannot be used to control for differences between treatment groups.Acknowledgements
Funding for this project was provided by the Canadian Institutes of Health Research CIHR: PJT 148660References
1. Provencher SW. Estimation of metabolite concentrations from localized in vivo proton NMR spectra. Magn Reson Med. 1993;30(6):672-679. doi:10.1002/mrm.1910300604.
2. Landheer K, Swanberg KM, Juchem C. Magnetic resonance Spectrum simulator (MARSS), a novel software package for fast and computationally efficient basis set simulation. NMR Biomed. 2019;(May):1-13. doi:10.1002/nbm.4129.
Figures