2944
Effects of High Fat Diet on the adipose tissues and brain metabolism of a transgenic mouse which over-expresses human hydrolase hMTH11NMR and MRI unit, Core facilities, Istituto Superiore di Sanita', Rome, Italy, 2Oncology and Molecular Medicine Department, Istituto Superiore di Sanita', Rome, Italy, 3Environmental and Health department, Istituto Superiore di Sanita', Rome, Italy
Synopsis
Oxidative stress is implicated in the pathogenesis of cancer, neurodegeneration and aging. hMTH1 is a hydrolase able to protect cells by oxidative damage. Overexpression of hMTH1 in transgenic mice (hMTH1‐Tg) confers significant protection against neurodegeneration and motor impairment. In this study, we use the hMTH1‐Tg mouse model and we found that oxidative damage is able to affect brain metabolism and adipose organ composition and extension. Moreover, we investigated the protective role of hMTH1-tg against an environmental oxidative stimulus like the assumption of a diet at high content of fat.
Introduction
Oxidative stress, an imbalance in the production and detoxification of reactive oxygen and nitrogen species (ROS and RNS), is implicated in the pathogenesis of cancer, neurodegenerative disorders and in the aging process. Human MutT homologue (hMTH1) is a hydrolase which is able to protect cells by oxidative damage by removing oxidized precursors (8-oxodGTP e 2-OHdATP) from pool of nucleotides, thus avoiding their incorporation in DNA. It has been shown that overexpression of hMTH1 in transgenic mice (hMTH1‐Tg) confers significant protection against neurodegeneration and motor impairment induced by the mitochondrial toxin 3‐nitropropionic acid (3‐NP) (1). Moreover, hMTH1-Tg mice show a decrease of oxidative DNA damage in several organs, prolonged life-span and enhanced exploratory behavior (2). Initial evidences have also shown reduced weight gain in the MTH1-Tg mice with respect to controls following exposure to a 4-weeks high fat diet with 60% of calories from fat.Aim
In this study, by using the hMTH1‐Tg mouse model we investigated: 1) if oxidative damage to nucleic acids is able to affect brain metabolism and adipose organ composition and extension; 2) if hMTH1 could be protective against an environmental oxidative stimulus like the assumption of a diet at high content of fat (45%).Methods
Male 10 wk old C57bl6 mice, wild-type (wt) and hMTH1-Tg, were fed with standard chow or a high fat diet (HFD) for 11 weeks (four groups of 5 mice each).During this period, body weight, oxidative DNA damage and different metabolic parameters were measured.At 4 and 11 weeks, 7 µl of fresh blood were analyzed by Single Cell Gel Electrophoresis (SCGE) assay (Comet assay), modified with digestion with Formamidopyrimidine DNA glycosylase (FPG) which specifically recognizes 8-oxodGTP and abasic sites in nuclear DNA. In order to quantify DNA damage we used tail moment (TM) parameter.
At 11 weeks brain metabolism as well as fat composition in interscapular fat was performed by 1H MRS and quantification of perivesical fat was assessed by MRI analyses.1H MRS experiments were performed on a VARIAN Inova MRI/MRS system operating at 4.7T with a transmitter volume RF coil actively decoupled from the receiver surface coil (RAPID Biomedical, Rimpar, Germany). 1H localised MR spectra were collected from the hippocampus (HIP, 11.7 μl) and prefrontal cortex (PFC, 5.9 μl) using PRESS sequence (TR/TE = 4000/23 ms, ns 512). According to a quantitative protocol (3) which includes water T2 measurements, spectra were analysed by using LCModel fitting program and the unsuppressed water signal for metabolite quantification.
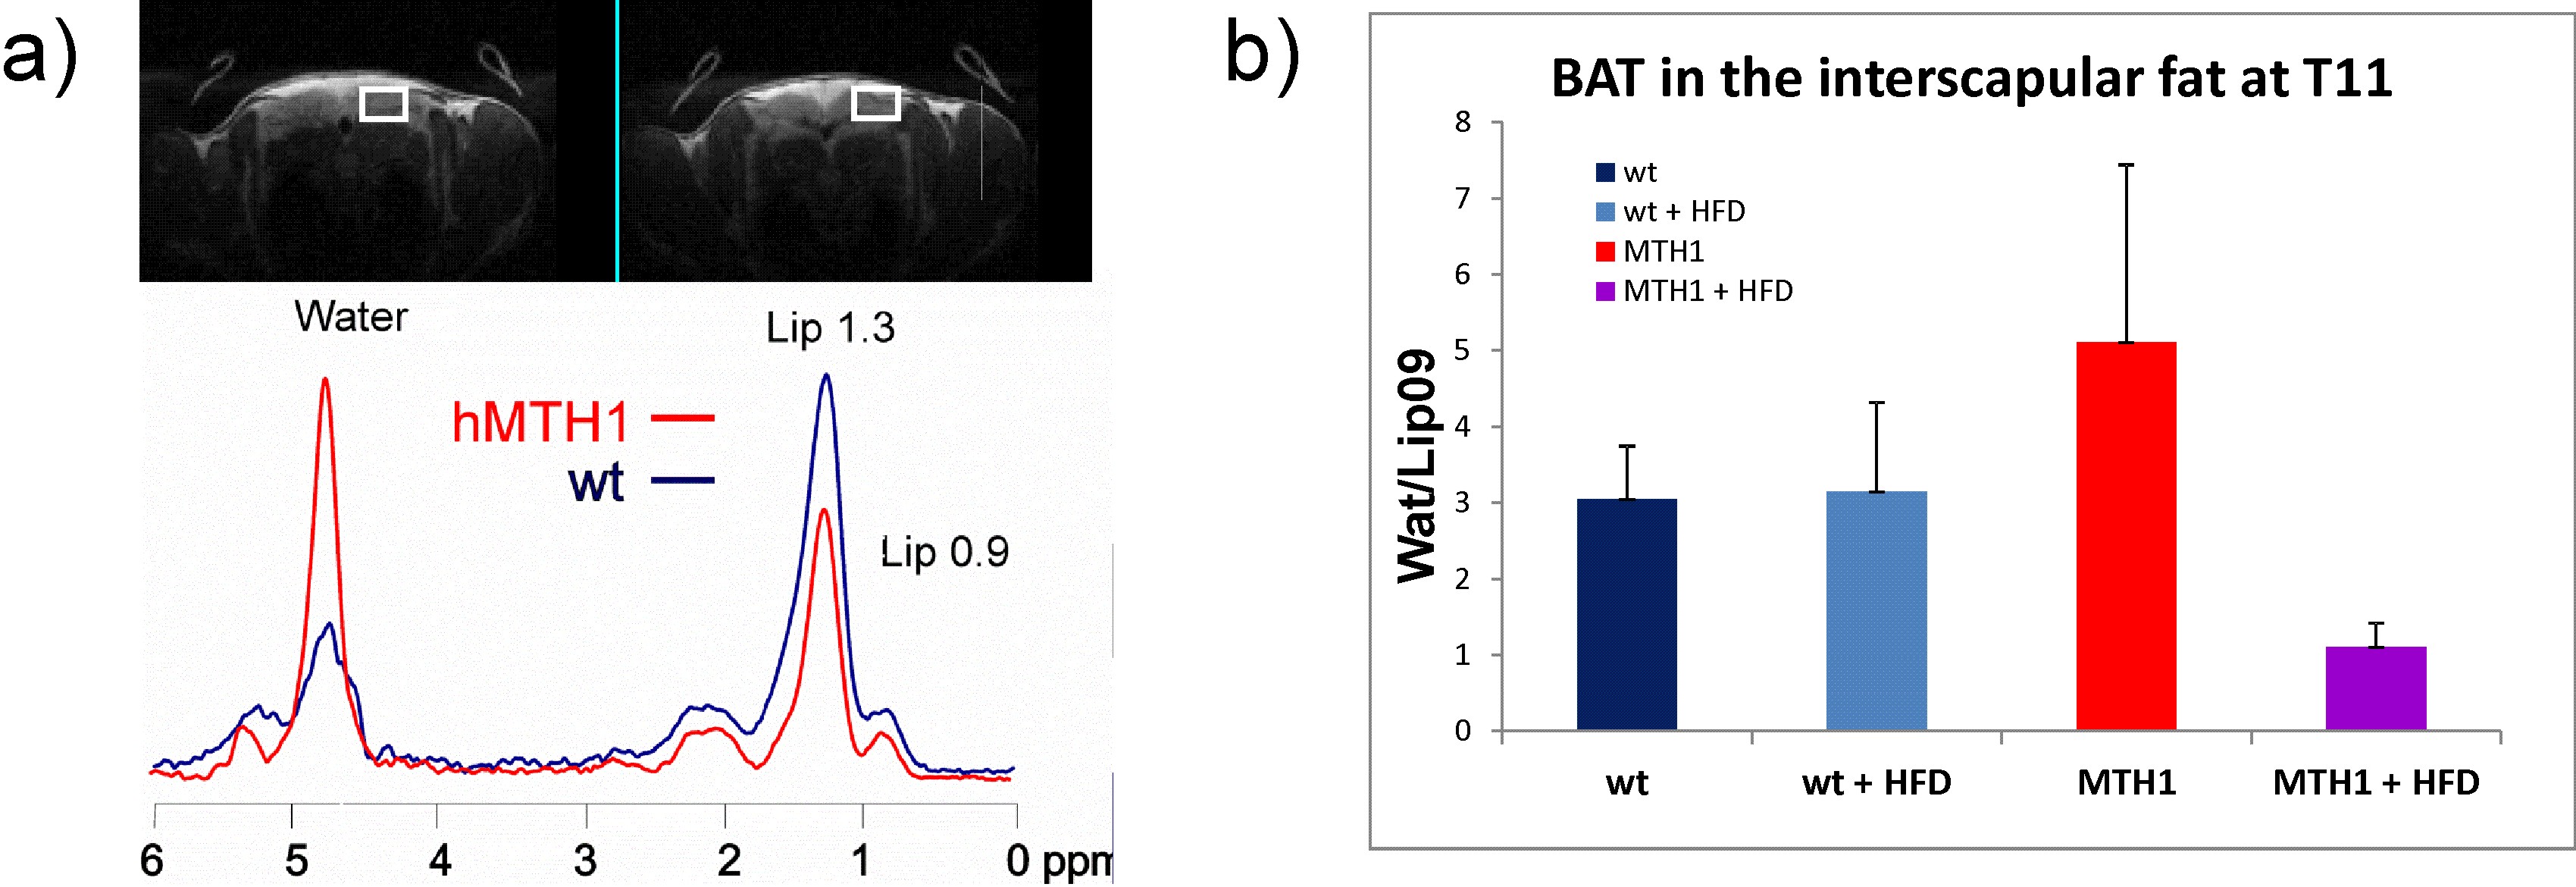
A voxel of 3.4 μl was then selected in the brown region of the interscapolar fat for water to lipid ratio determination (and therefore to assess the amount of brown fat in the region of the adipose organ which is reputed to be the richest part) by using a STEAM sequence (TR/TE/TM=6000/9/10 ms).
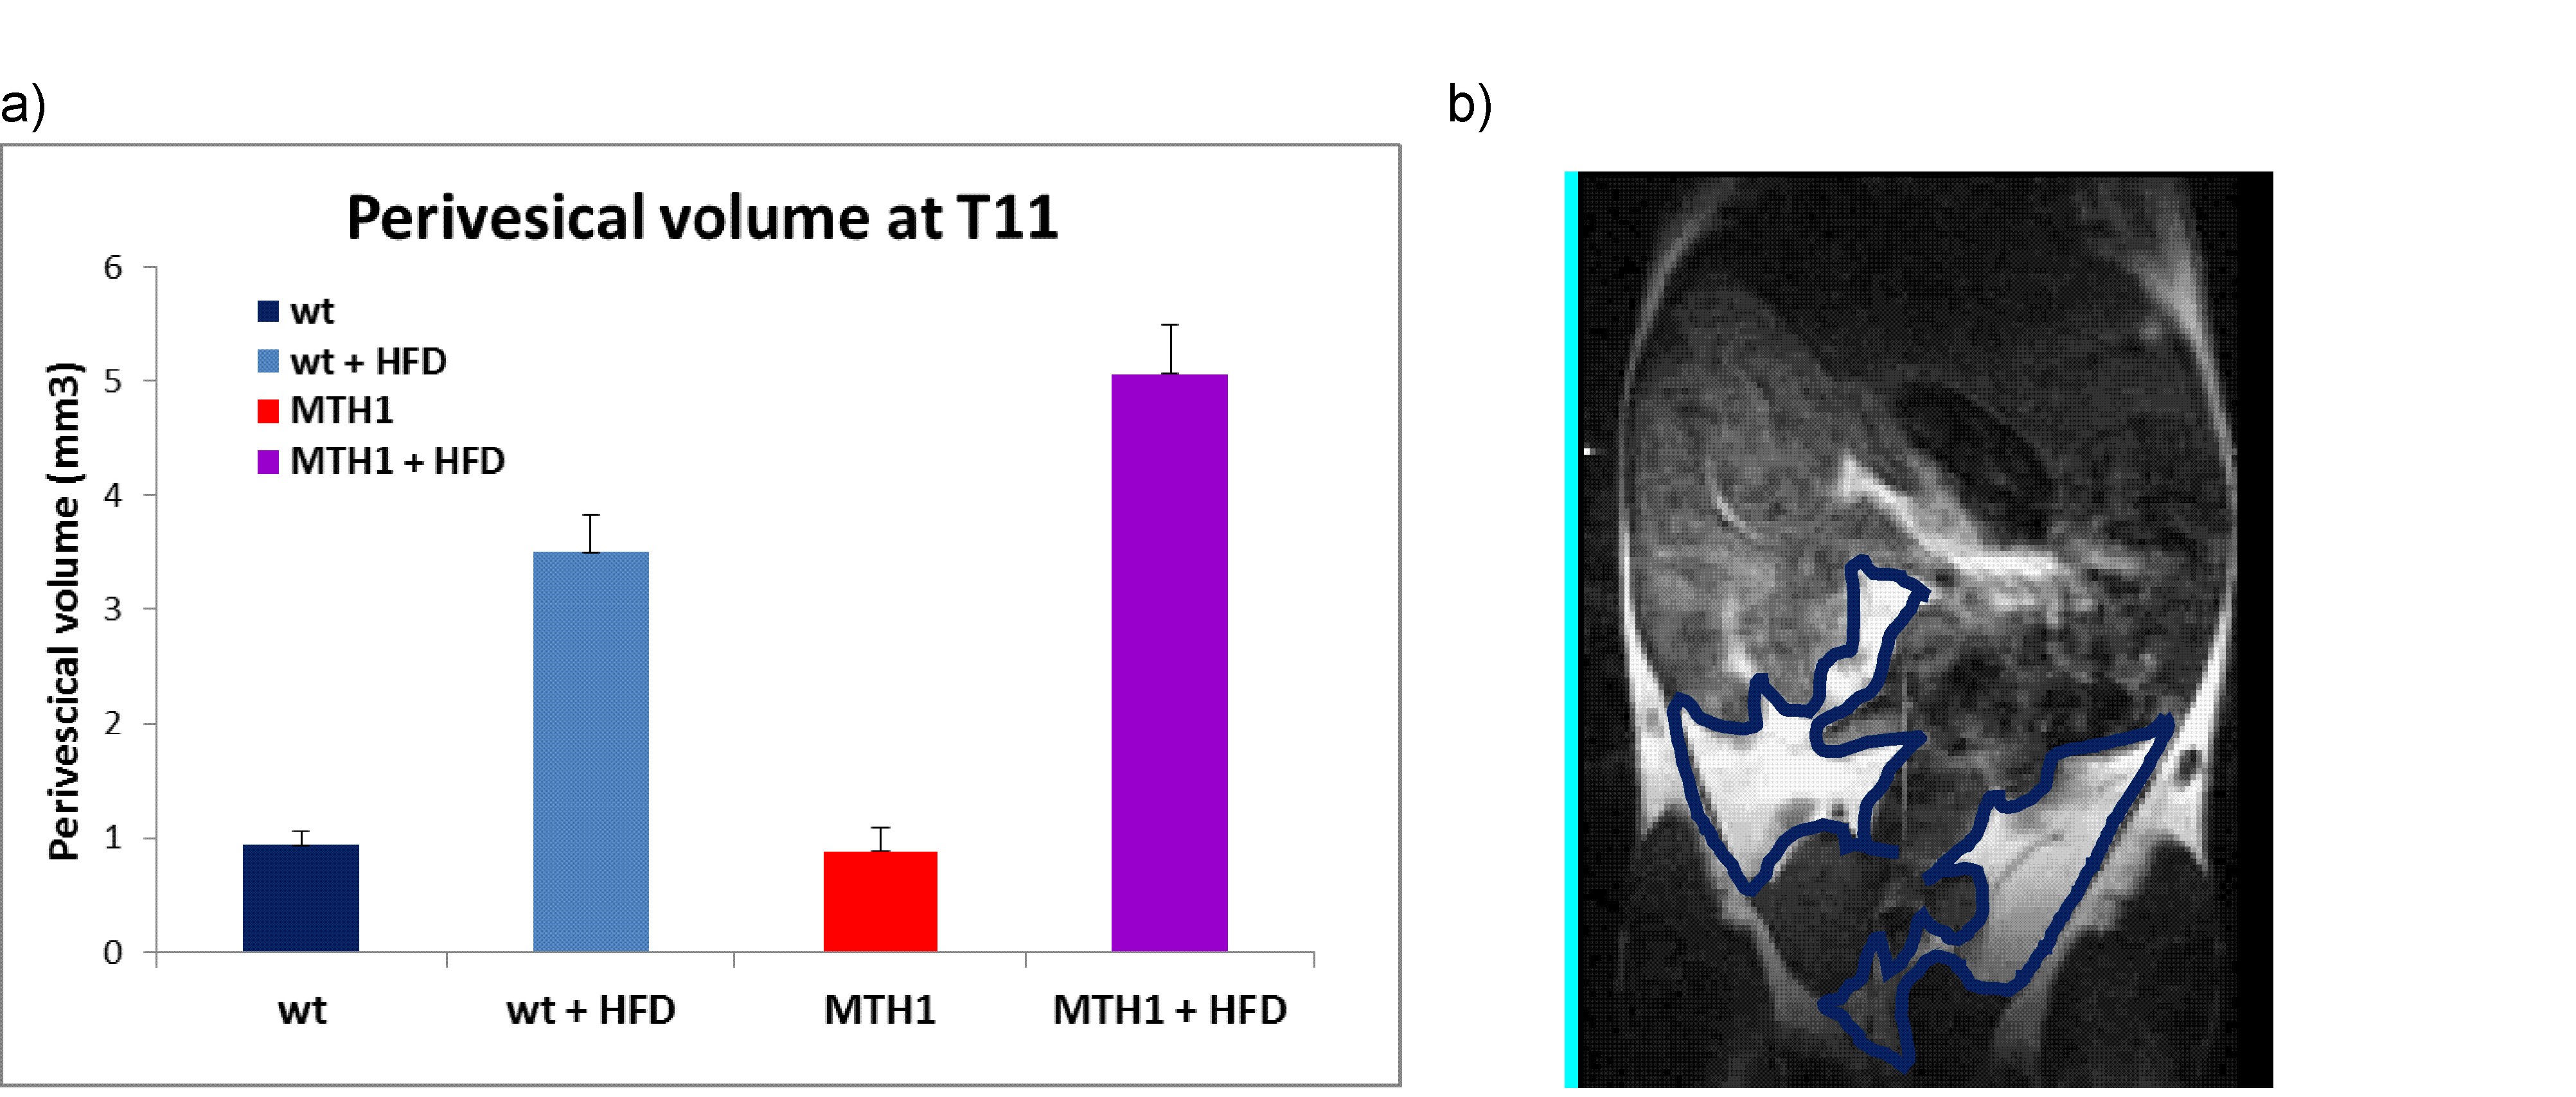
T1-weighted MRI was finally performed to the abdomen to quantify the volume of visceral fat depot in the four different mice groups. Visceral fat is known to be a risk factor for metabolic dysfunction which is related to obesity.
ANOVA 2x2 (genotype x diet) design was used for statistical comparisons. Values of P<0.05 were considered significant.
Results
After 11 weeks of HFD exposition we did not found any difference in weight gain between wt and hMTH1-Tg mice. However, we could observe a significant difference in oxidative DNA damage by comet assay. In particular, wt mice showed an increase in oxidative DNA damage both at basal level and after 4 and 11 weeks of HFD stimulus, as shown in Fig 1.Alterations in brain metabolite concentrations have been detected in both PFC and HIP. Quantitative results are shown in Fig.2.
In the interscapolar fat we observed a trend in the increase of the water/lipid signals ratio in the hMTH1-tg mice group, which is in accordance with increased presence of brown fat which is reversed in the HFD groups of animals (diet effect, p<0.05; genotype x diet effect, p<0.008), as shown in Fig. 3.
Furthermore, T1-weighted MRI of the abdomen revealed a reduced amount of visceral fat for the hMTH1-tg mice (genotype effect, p<0.001) which is reversed in the HFD animals (diet effect, p<0.001; genotype x diet effect, p<0.001), as shown in Fig.4.
Discussion and Conclusion
In spite of similar body weight, oxidative DNA damage levels and adipose organ extension and composition are different in the two mice groups. In particular, results obtained by the modified comet assay show that HFD can induce an accumulation of oxidative damage at nuclear DNA level and that hMTH1 has a protective role, both at basal level and after HFD exposure.Brain metabolism alteration highlights a direct effect on brain functionality. The protective effect observed in the hMTH1 mice (in terms of amount of brown interscapular and perivesical fat) seems to be reversed in the mice that are subjected to HFD. This paradoxical effect suggests not-obvious link between HFD and oxidative damage and warrant further investigation.
Taken together, our preliminary data show that the hMTH1-tg mouse is a good model to investigate the role of oxidative DNA damage in metabolic disorders.
Acknowledgements
No acknowledgement found.References
1. De Luca G, Russo MT, Degan P, Tiveron C, Zijno A, Meccia E, Ventura I, Mattei E, Nakabeppu Y, Crescenzi M, Pepponi R, Pezzola A, Popoli P, Bignami M. A role for oxidized DNA precursors in Huntington's disease-like striatal neurodegeneration. PLoS Genet 2008;4(11):e1000266.
2. De Luca G, Ventura I, Sanghez V, Russo MT, Ajmone-Cat MA, Cacci E, Martire A, Popoli P, Falcone G, Michelini F, Crescenzi M, Degan P, Minghetti L, Bignami M, Calamandrei G. Prolonged lifespan with enhanced exploratory behavior in mice overexpressing the oxidized nucleoside triphosphatase hMTH1. Aging Cell 2013;12(4):695-705.
3. Canese R, Pisanu ME, Mezzanzanica D, Ricci A, Paris L, Bagnoli M, Valeri B, Spada M, Venditti M, Cesolini A, Rodomonte A, Giannini M, Canevari S, Podo F, Iorio E. Characterisation of in vivo ovarian cancer models by quantitative 1H magnetic resonance spectroscopy and diffusion-weighted imaging. NMR Biomed 2012;25(4):632-642.
Figures
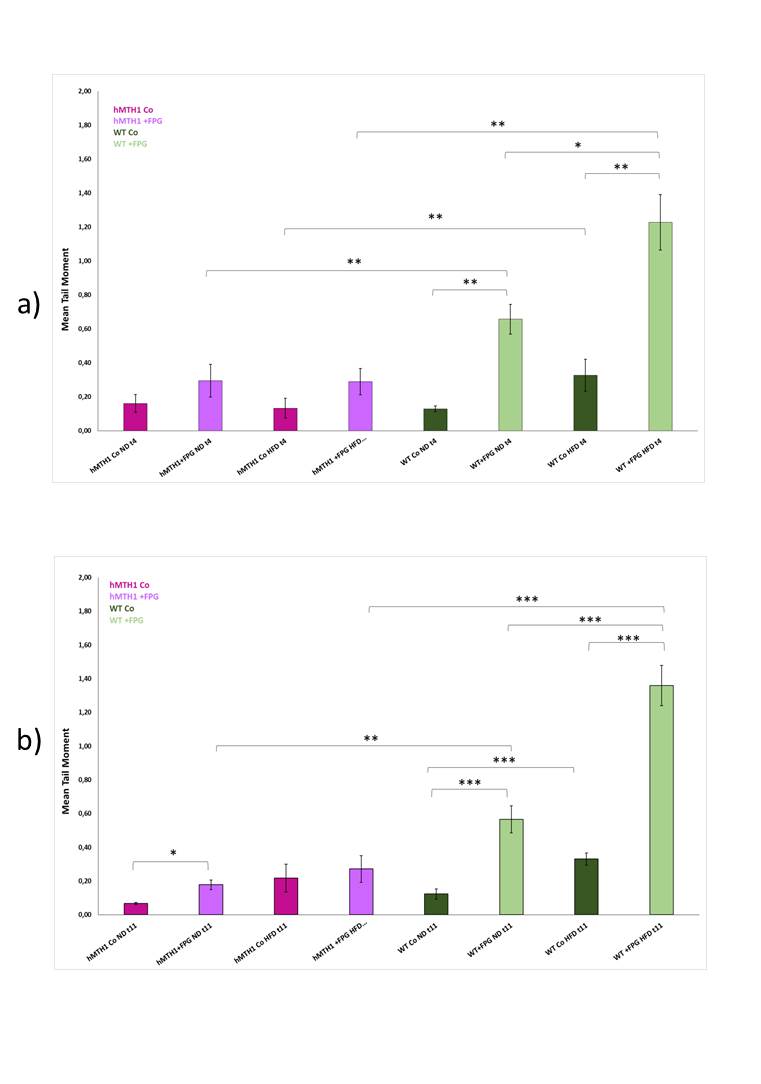
Figure 1 – Modified comet assay with FPG digestion after a) 4 weeks and b) 11 weeks of HFD exposition of wt and hMTH1-Tg mice. *p<0.05; **p<0.01; *** p<0.001
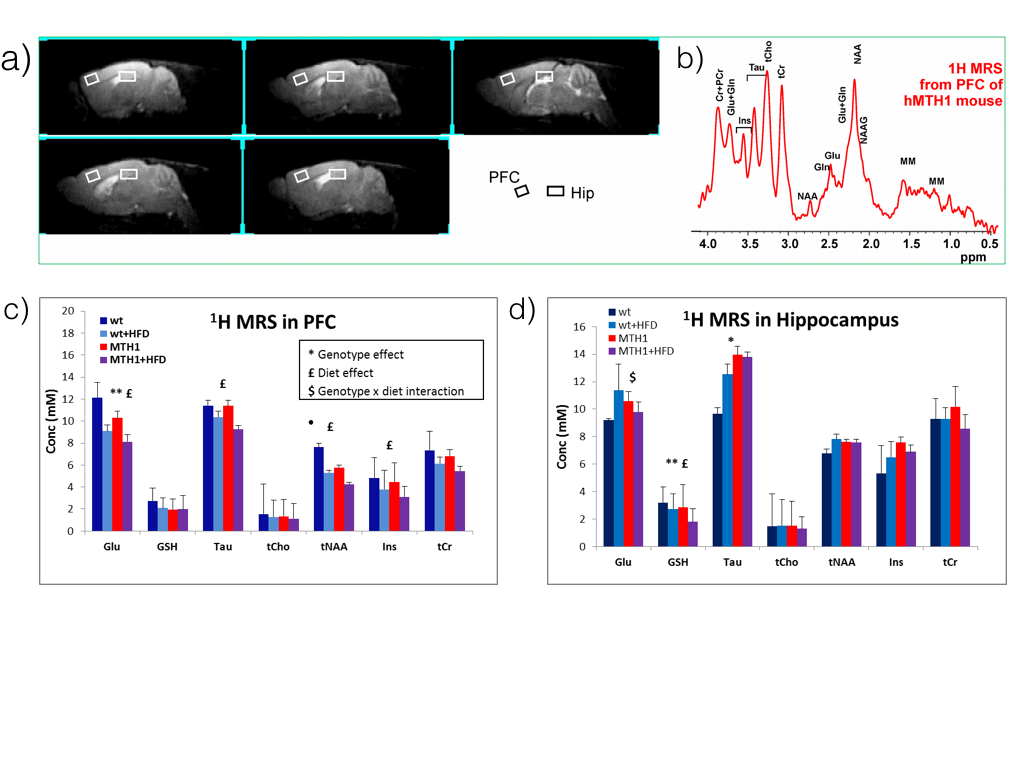
Figure 2– a) Sagittal T2W MRI indicating ROIs and a spectrum (b) from the PFC of hMTH1-tg mouse. c) and d) Metabolite levels obtained from in vivo 1H spectra acquired from PFC and hippocampus of the four groups of mice after 11 week of diet by using a quantitative protocol (which uses water as internal standard) and LCModel fitting program.
Effect of genotype: *p<0.05, **p<0.01; Effect of diet: £p<0.05; genotype x diet interaction $p<0.05: Data are mean±SD.