2943
Simultaneous characterization of individual macromolecule resonances and metabolites in the Fischer 344 rat during healthy aging1Biological and Biomedical Engineering, McGill University - Douglas Hospital Research Centre, Verdun, QC, Canada, 2Douglas Hospital Research Centre, Verdun, QC, Canada, 3Psychiatry, McGill University - Douglas Hospital Research Centre, Montréal, QC, Canada
Synopsis
To better understand pathological aging, we must first have a thorough understanding of changes that occur in the brain during healthy aging. This project employs Magnetic Resonance Spectroscopy to characterize longitudinal changes in the neurochemical profile of healthy Fischer 344 rats. In addition to the commonly reported metabolites, nine macromolecular resonances were included in the basis set and quantified, based on parameterization of a group-averaged metabolite-nulled spectrum. For the first time, longitudinal age-related changes in metabolites and individual macromolecules were simultaneously characterized in the Fischer rat. Sex-specific differences were also identified in metabolites and macromolecules.
Introduction
To better understand pathological aging, we must first thoroughly characterize the neurological changes that occur in healthy aging. Magnetic resonance spectroscopy (MRS) allows longitudinal detection of neurochemical changes related to specific cellular mechanisms1–3, and can be used for translational research in both animal models and human subjects.3,4 The present study reports normal age-related changes in both metabolite and macromolecule (MM) levels in the hippocampus of the Fischer 344 rat – an inbred strain commonly used in aging research5 – measured by short echo-time (TE) proton MRS (1H-MRS) at 7T. To quantify MM, individual MM basis spectra were derived from in vivo metabolite-nulled spectra and included in quantification basis sets. Accounting for the MM contribution in this way not only improves metabolite quantification but may also provide valuable information regarding chemical changes occurring in the aging brain.6 Finally, we also examined sex-specific differences in metabolite and MM concentrations, as previous human and animal studies have indicated such differences in the progression of neurochemical changes with both age and disease presentation.1,7,8Methods
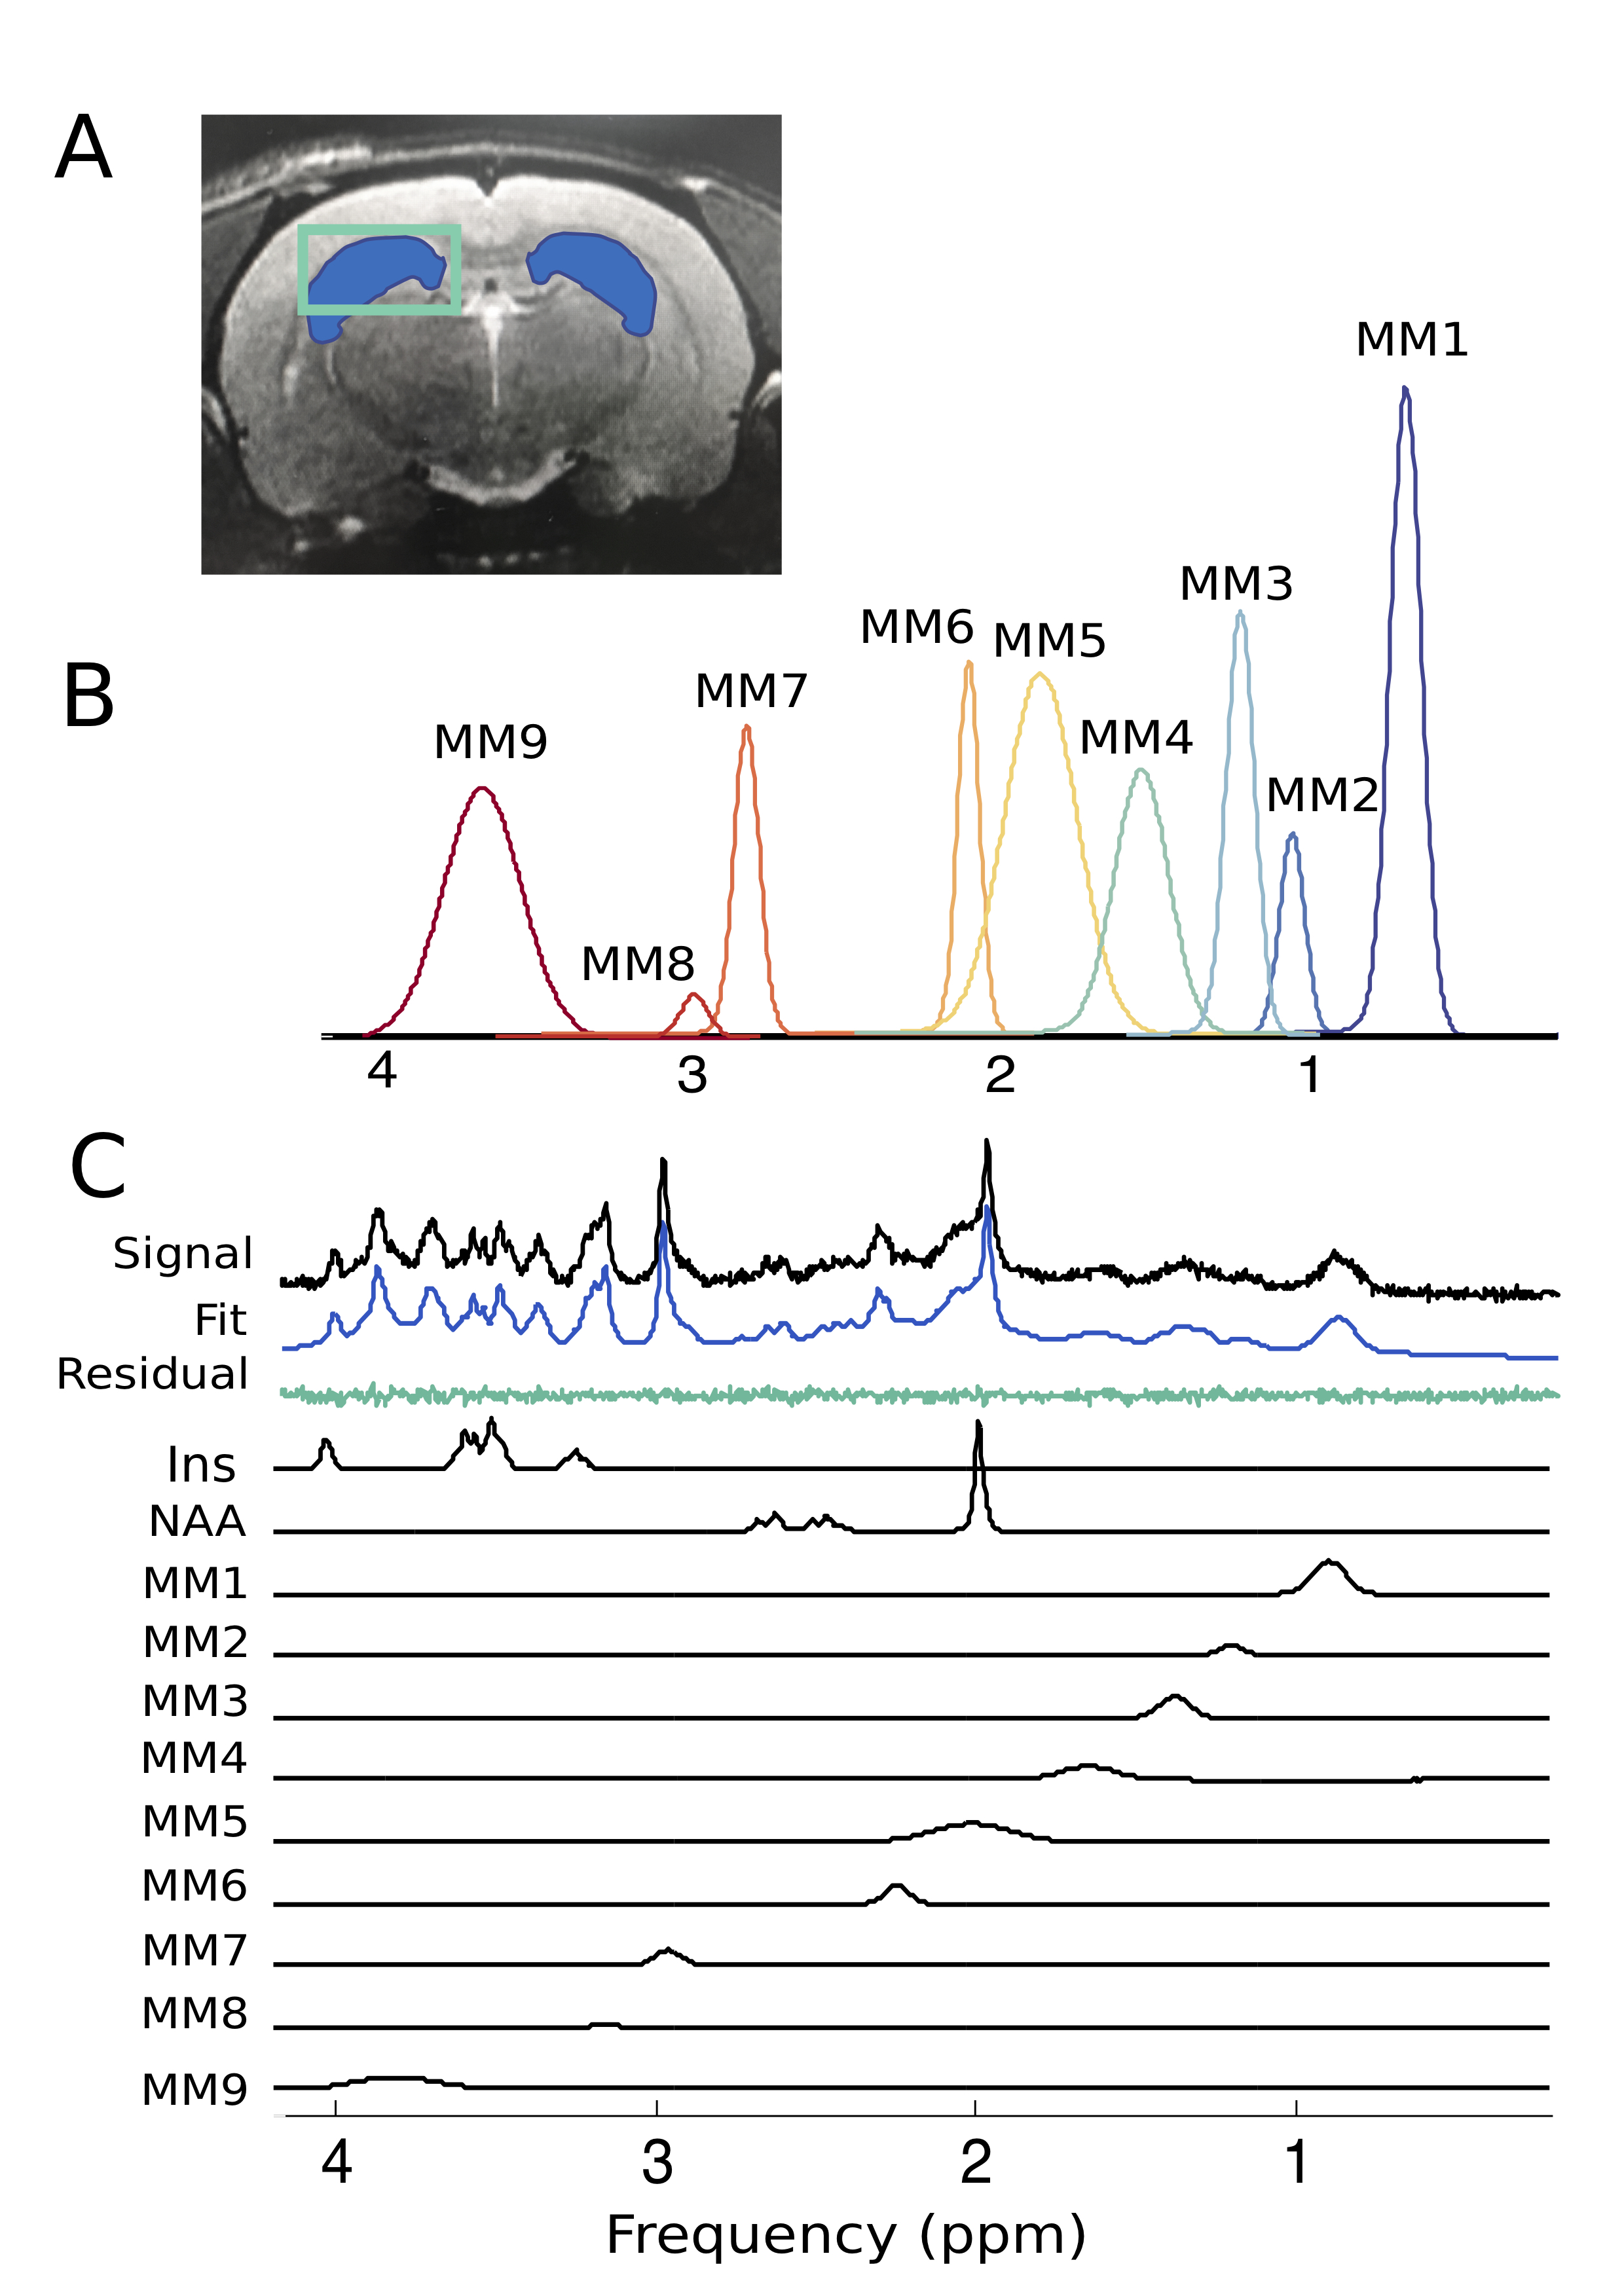
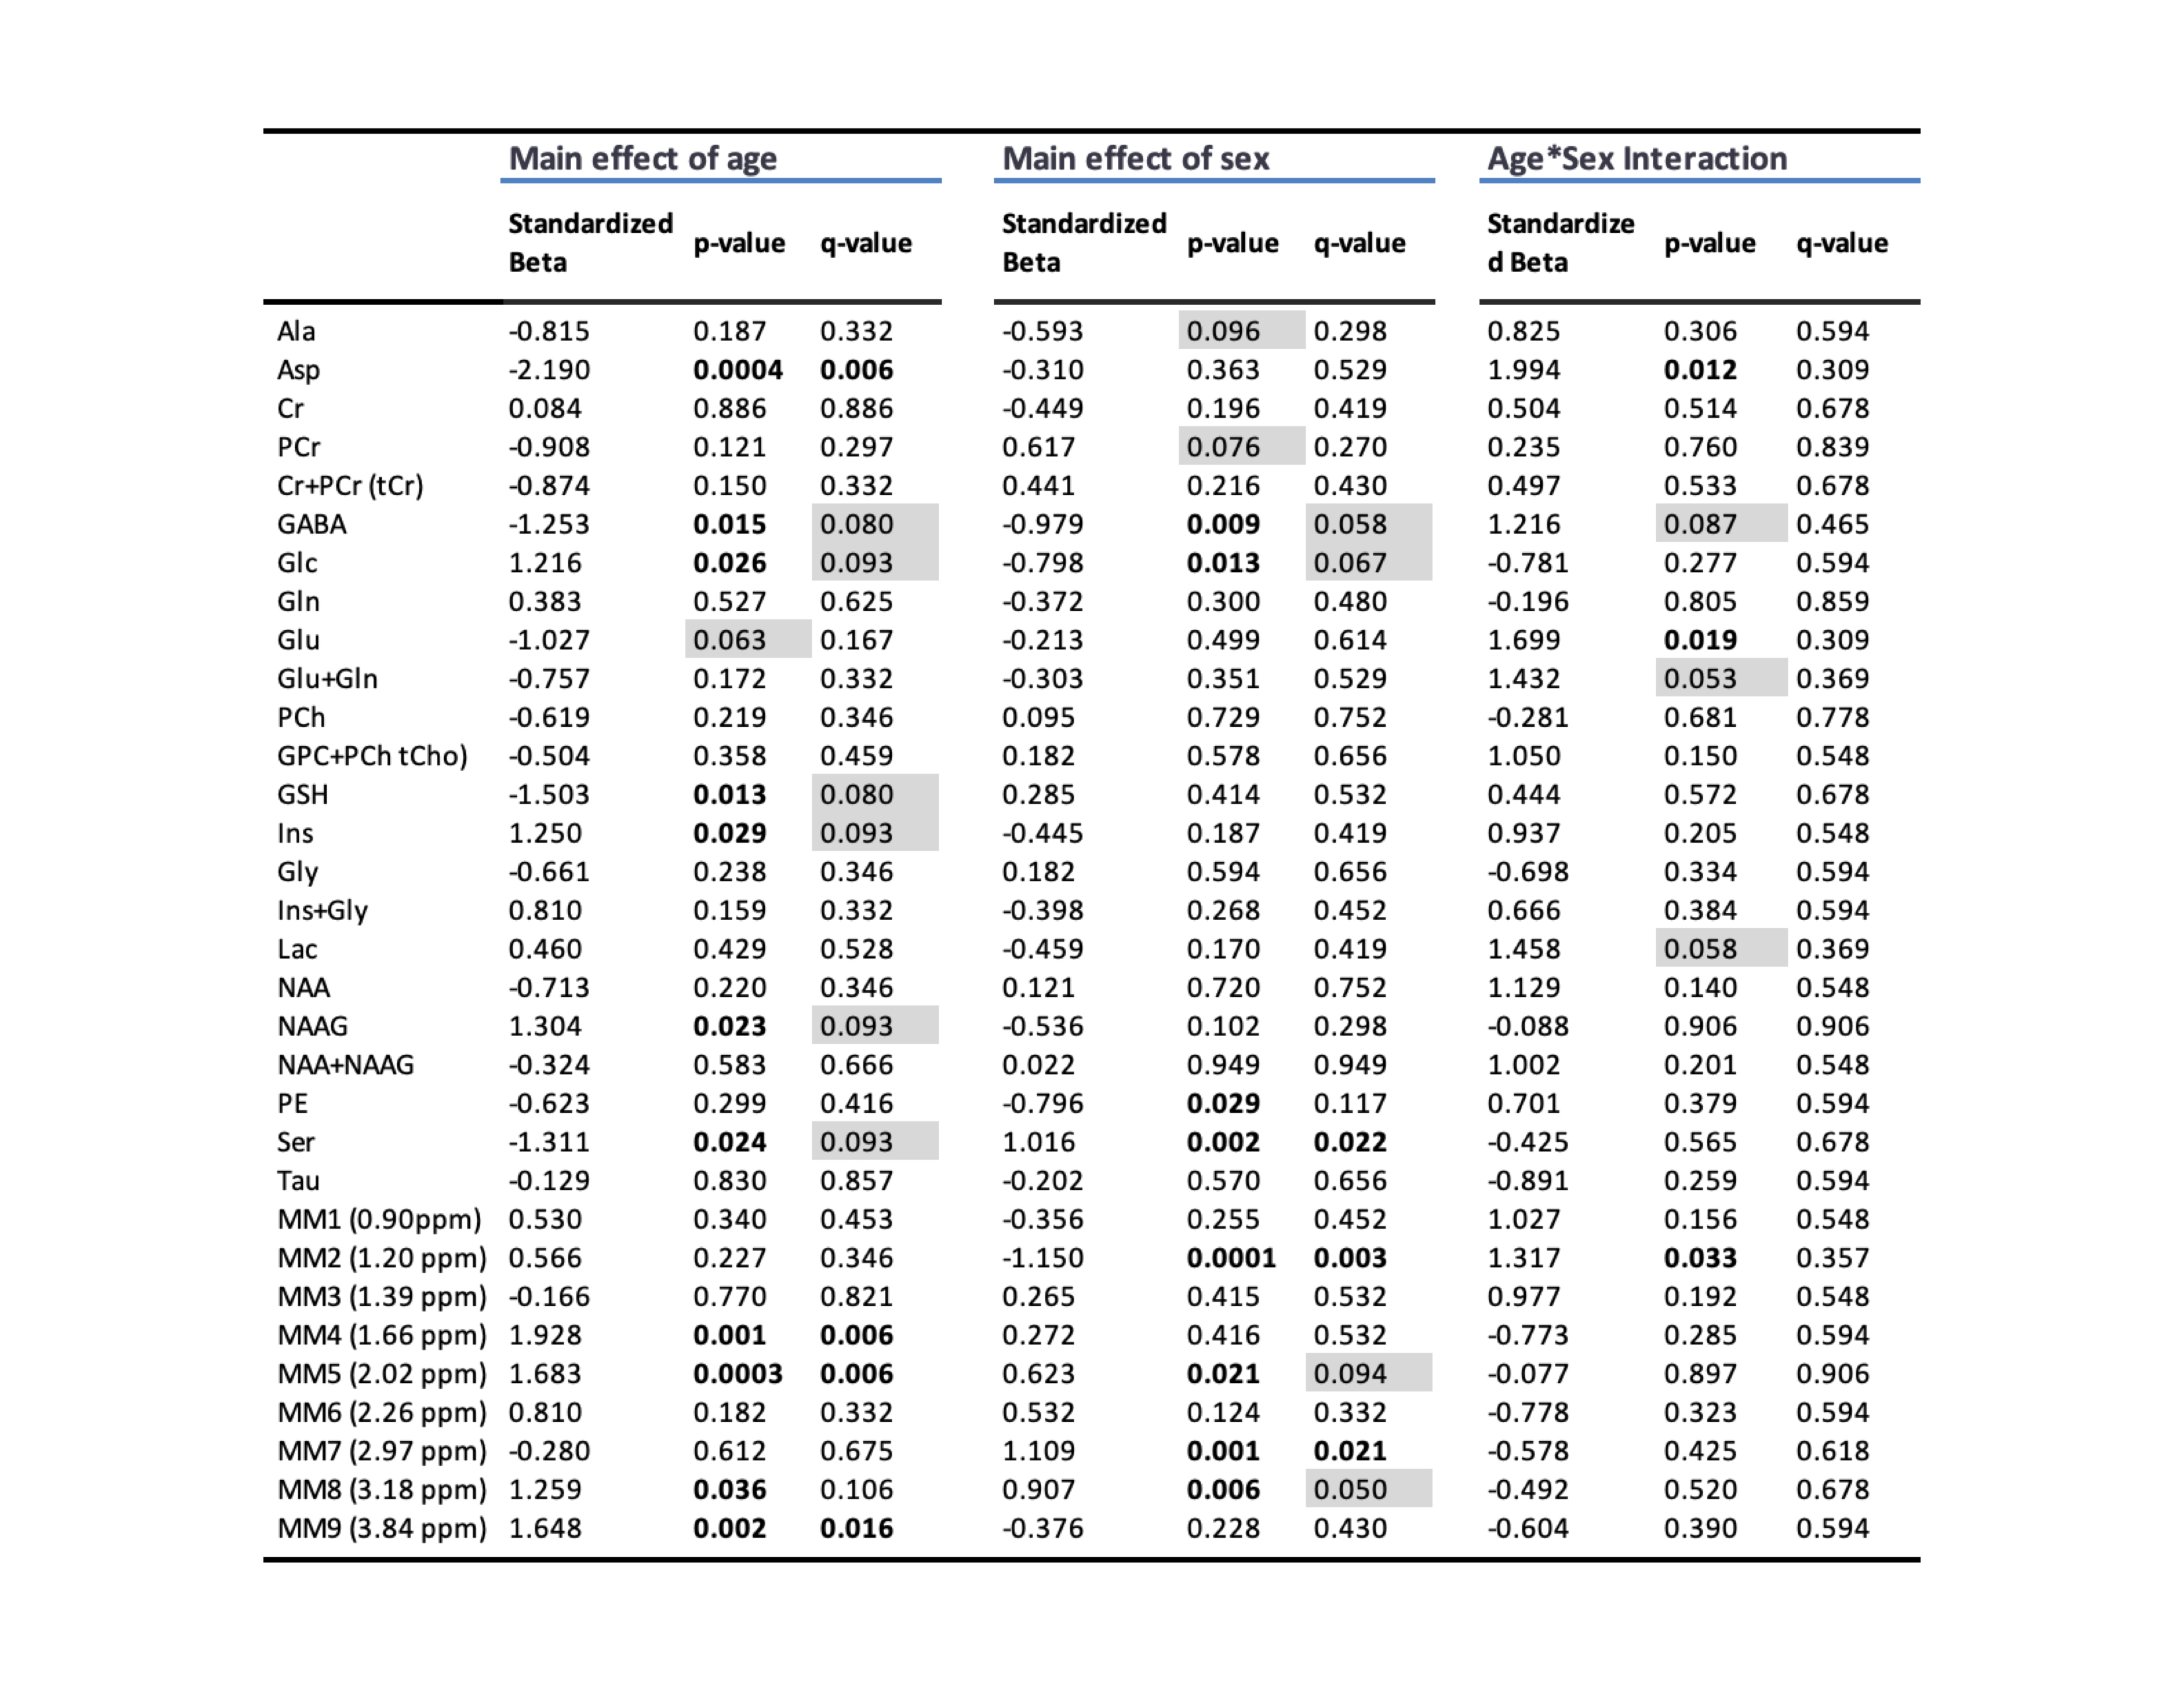
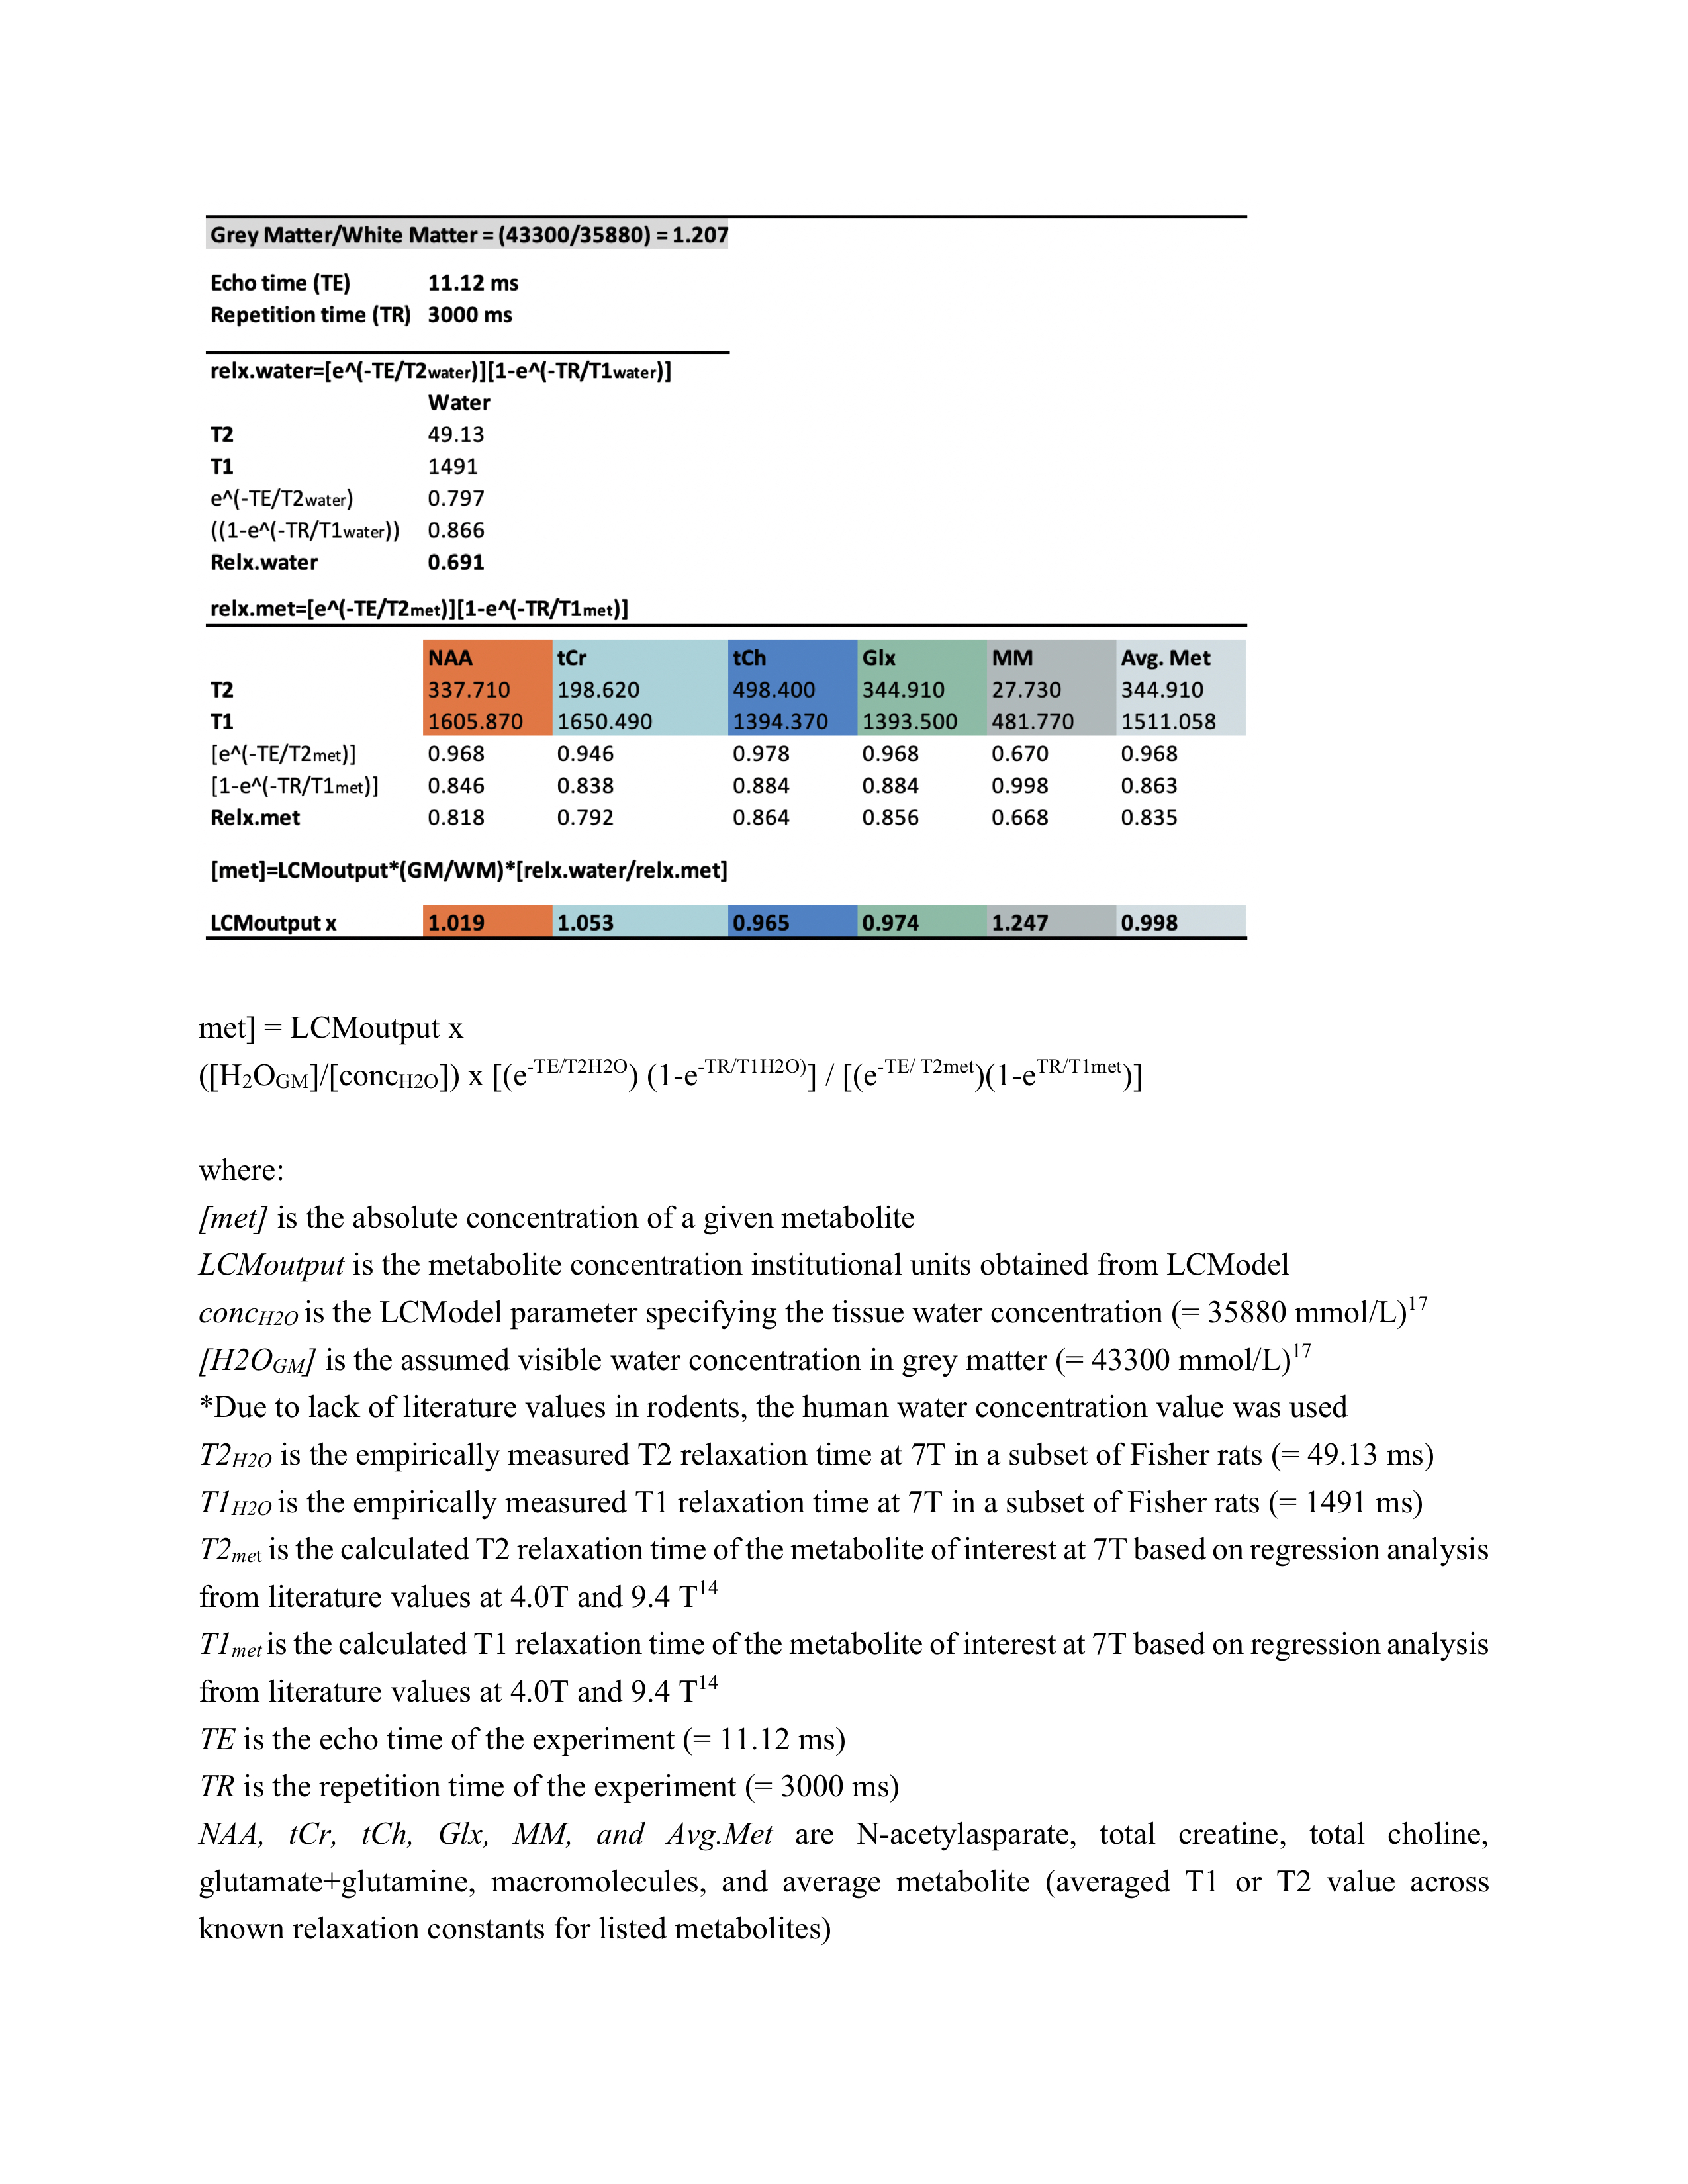
Proton MRS acquisition: All 1H-MRS data were acquired on a 7 Tesla Bruker Biospec 70/30 scanner. Automated localized shimming was performed in a region of interest (ROI) in the dorsal hippocampus (31mL) using the FASTMAP method10 (water linewidth 9.9±1.0 Hz). Water suppressed (256 averages) and unsuppressed scans (8 averages) from the ROI were acquired using PRESS (TR/TE = 3000/11ms). Macromolecule parameterization: metabolite-nulled inversion recovery (IR, TI = 800ms) scans were obtained in 8 10 month old rats from the same hippocampal ROI as above. A group-averaged MM spectrum was generated using FID-A11 and exported into JMRUI for parameterization using AMARES.12 Specifically, the chemical shift, linewidth and relative amplitudes of nine prominent macromolecule resonances were estimated. Spectral quantification: The frequency and linewidth for each MM resonance was used to simulate MM basis functions in FID-A; the MM amplitudes relative to MM1 (0.9ppm) were used as soft constraints within LCModel analysis. The complete LCModel13 basis set generated in FID-A comprised 20 metabolites and 9 macromolecules. Data pre-processing was also performed in FID-A. Absolute Concentration Calculations: Water T1 and T2 were estimated in a subset of 10 month old rats (n=7) using measured TE-series and TI-series, respectively. Metabolite T1 and T2 relaxation constants at 7T were estimated based on previously published data at 4T and 9.4 T14. Absolute concentrations, in mmol/L, were estimated by referencing to water and adjusting for T1 and T2 relaxation (Figure 5). Statistical analysis: A linear mixed-effects models with fixed effects for age, sex, and water linewidth, and a random effect of subject was used to fit the data in RStudio (RStudio Team). Weighting based on the LCModel absolute standard deviation of each measurement was introduced to account for differences in fitting reliability. Any metabolite for which 50% of observations had very low reliability (i.e. CRLB > 100%) was excluded entirely (Scyllo and GPC). Scaling on all continuous variables was performed to make beta values immediately interpretable. FDR correction (0.05) for multiple comparisons was applied, with p-values and q-values summarized in Figure 4.Results and Discussion
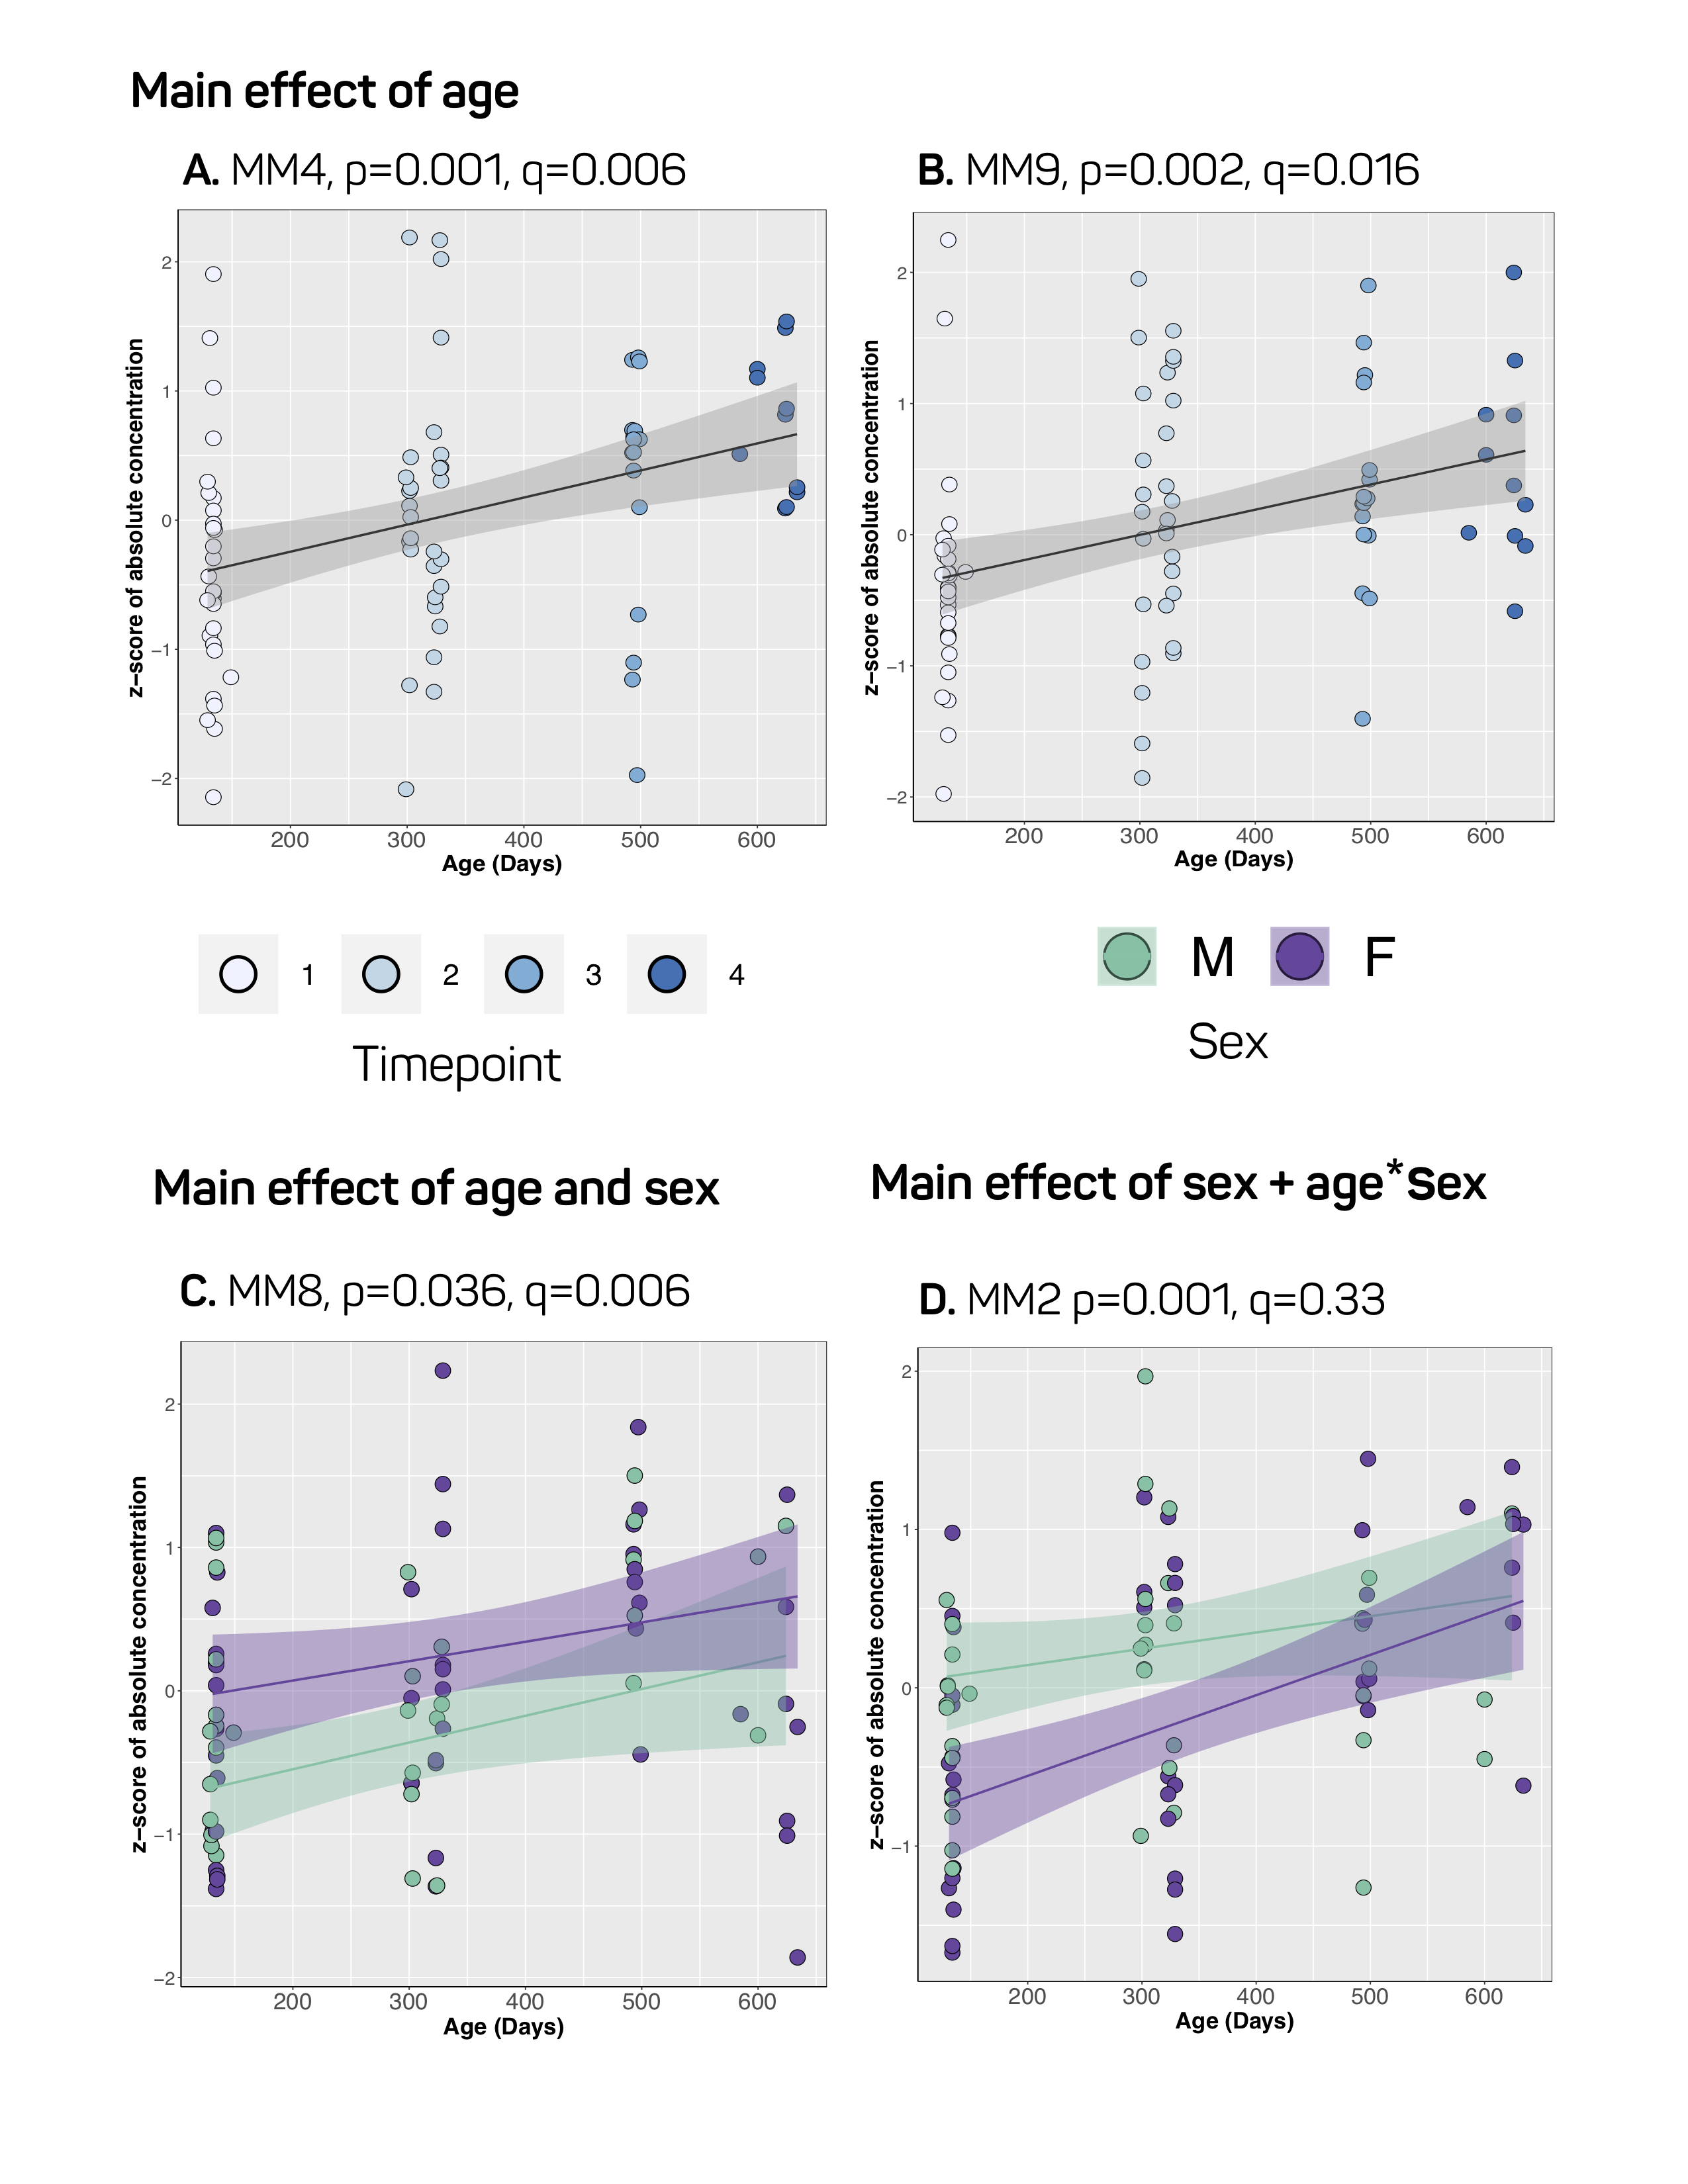
Our approach to parameterize and quantify each of the individual MM resonances allowed improved quantification of metabolite signals, while simultaneously providing valuable information on MM changes with aging.6,15,16 Nine MM resonances were quantified in this study (MM1, 0.9 ppm; MM2, 1.20 ppm; MM3, 1.39 ppm; MM4, 1.66 ppm; MM5, 2.02 ppm; MM6, 2.26 ppm; MM7, 2.97 ppm; MM8, 3.18 ppm; MM9, 3.84 ppm) in addition to an array of 18 standard metabolites. Linear modelling of neurochemical concentrations revealed effects of age and/or sex in key metabolites associated with the aging process such as increased myo-inositol, and decreased glutathione and glutamate (Figures 2 and 4). No change was seen in other commonly reported metabolites such as N-acetylaspartate (NAA) and total choline (tCho) (Figure 4); reports have been inconsistent as to whether NAA decreases with age and tCho increases with age, or whether they remain stable1,2,7. It should be noted that the final timepoint of our study was at 20-months of age, at which point rats are reaching late-middle-age; it is possible that we might have seen more significant neurochemical changes had we extended this study. Finally, changes due to sex and/or age were seen in 6 of the 9 macromolecules, with the most notable being a significant increase with age in MM4 and MM9, and an increase with age combined with an increase in males relative to females in MM8 (Figure 3). Aside from the knowledge that the MM resonances can be assigned to cytosolic proteins and that regional differences in MM concentrations have been reported2,6,7, the physiological meaning behind changes in individual MMs remains to be investigated.Conclusion
The present study reports, for the first time, longitudinal modifications in metabolite and macromolecule levels in the hippocampus of the aging Fischer rat, measured at 7T. These results present the basal neurochemical profile of the hippocampus in aging Fischer rats, and therefore confirm the value of MRS measurements as non-invasive biomarkers for detection and monitoring of neurologic disorders and/or treatment efficacy.Acknowledgements
No acknowledgement found.References
1. Duarte JMN, Do KQ, Gruetter R. Longitudinal neurochemical modifications in the aging mouse brain measured in vivo by 1H magnetic resonance spectroscopy. Neurobiol Aging. 2014;35(7):1660-1668. doi:10.1016/J.NEUROBIOLAGING.2014.01.135
2. Harris JL, Yeh HW, Swerdlow RH, Choi IY, Lee P, Brooks WM. High-field proton magnetic resonance spectroscopy reveals metabolic effects of normal brain aging. Neurobiol Aging. 2014;35(7):1686-1694. doi:10.1016/j.neurobiolaging.2014.01.018
3. Gao F, Barker PB. Various MRS application tools for Alzheimer disease and mild cognitive impairment. Am J Neuroradiol. 2014;35(6 SUPPL.). doi:10.3174/ajnr.A3944
4. Marjańska M, Curran GL, Wengenack TM, et al. Monitoring disease progression in transgenic mouse models of Alzheimer’s disease with proton magnetic resonance spectroscopy. Proc Natl Acad Sci. 2005;102(33):11906-11910. doi:10.1073/pnas.0505513102
5. Mitchell SJ, Scheibye-Knudsen M, Longo DL, de Cabo R. Animal Models of Aging Research: Implications for Human Aging and Age-Related Diseases. Annu Rev Anim Biosci. 2015;3(1):283-303. doi:10.1146/annurev-animal-022114-110829
6. Považan M, Strasser B, Hangel G, et al. Simultaneous mapping of metabolites and individual macromolecular components via ultra-short acquisition delay1H MRSI in the brain at 7T. Magn Reson Med. 2018;79(3):1231-1240. doi:10.1002/mrm.26778
7. Boumezbeur F, Mason GF, De Graaf RA, et al. Altered brain mitochondrial metabolism in healthy aging as assessed by in vivo magnetic resonance spectroscopy. J Cereb Blood Flow Metab. 2010;30(1):211-221. doi:10.1038/jcbfm.2009.197
8. Febo M, Foster TC. Preclinical magnetic resonance imaging and spectroscopy studies of memory, aging, and cognitive decline. Front Aging Neurosci. 2016;8(JUN):1-19. doi:10.3389/fnagi.2016.00158
9. Cohen RM, Rezai-Zadeh K, Weitz TM, et al. A Transgenic Alzheimer Rat with Plaques, Tau Pathology, Behavioral Impairment, Oligomeric A , and Frank Neuronal Loss. J Neurosci. 2013;33(15):6245-6256. doi:10.1523/JNEUROSCI.3672-12.2013
10. Gruetter R. Automatic, localized in Vivo adjustment of all first???and second???order shim coils. Magn Reson Med. 1993;29(6):804-811. doi:10.1002/mrm.1910290613
11. Simpson R, Devenyi GA, Jezzard P, Hennessy TJ, Near J. Advanced processing and simulation of MRS data using the FID appliance (FID-A)-An open source, MATLAB-based toolkit. Magn Reson Med. 2017;77(1):23-33. doi:10.1002/mrm.26091
12. Vanhamme L, Van Den Boogaart A, Van Huffel S. Improved Method for Accurate and Efficient Quantification of MRS Data with Use of Prior Knowledge. J Magn Reson. 1997;129(1):35-43. doi:10.1006/jmre.1997.1244
13. Provencher SW. Automatic quantitation of localized in vivo1H spectra with LCModel. NMR Biomed. 2001;14(4):260-264. doi:10.1002/nbm.698
14. De Graaf RA, Brown PB, McIntyre S, Nixon TW, Behar KL, Rothman DL. High magnetic field water and metabolite proton T1 and T 2 relaxation in rat brain in vivo. Magn Reson Med. 2006;56(2):386-394. doi:10.1002/mrm.20946
15. Lee HH, Kim H. Parameterization of spectral baseline directly from short echo time full spectra in 1 H-MRS. Magn Reson Med. 2017;78(3):836-847. doi:10.1002/mrm.26502
16. Otazo R, Mueller B, Ugurbil K, Wald L, Posse S. Signal-to-noise ratio and spectral linewidth improvements between 1.5 and 7 Tesla in proton echo-planar spectroscopic imaging. Magn Reson Med. 2006;56(6):1200-1210. doi:10.1002/mrm.21067
17. Dhamala E, Abdelkefi I, Nguyen M, Hennessy TJ, Nadeau H, Near J. Validation of in vivo MRS measures of metabolite concentrations in the human brain. NMR Biomed. 2019;(November 2018):1-15. doi:10.1002/nbm.4058
Figures