2942
Lactate change during visual stimuli detected by MEGA-PRESS at 3T
Ya-Tien Liu1, Dian-Han Yang1, Cheng-Wen Ko1, Tzu-Chao Chuang2, and Shang-Yueh Tsai3,4
1Department of Computer Science and Engineering, National Sun Yat-sen University, Kaohsiung, Taiwan, 2Department of Electrical Engineering, National Sun Yat-sen University, Kaohsiung, Taiwan, 3Graduate Institute of Applied Physics, National Chengchi University, Taipei, Taiwan, 4Research Center of Mind, National Chengchi University, Taipei, Taiwan
1Department of Computer Science and Engineering, National Sun Yat-sen University, Kaohsiung, Taiwan, 2Department of Electrical Engineering, National Sun Yat-sen University, Kaohsiung, Taiwan, 3Graduate Institute of Applied Physics, National Chengchi University, Taipei, Taiwan, 4Research Center of Mind, National Chengchi University, Taipei, Taiwan
Synopsis
In this study, we investigate the feasibility of using MEGA-PRESS to detect Lac response to the visual stimuli in visual cortex in fMRS experiment at 3T. The significant raise in Lac level was found either by averaging the whole fMRS scan or by averaging over the stimuli blocks. Our results show consistency with the published results. More sophisticated approach to analyze fMRS data may be necessary to facilitate reliable metabolic quantification.
Introduction
Functional magnetic resonance spectroscopy (fMRS) can provide biochemical information of the brain by investigating metabolic response to external stimuli. Using the same experiment design as fMRI, several studies have reported the findings that glutamate (Glu) and lactate (Lac) can alter during visual stimuli in primary visual cortex1,2,3 and in motor cortex during motor task4, where 2~4% increase between stimuli and rest sessions is reported for Glu and for Lac 9%~30% increase is found. These studies are all performed in 7T MRI system in the consideration of the small change of metabolic level and intrinsic low signal to noise ratio (SNR) of MRS. As Lac can be detected using MEGA-PRESS method at 3T MRI system and is already applied to detect the lac change during inspiratory hypoxia5, it is possible to detect Lac change during visual stimuli at 3T system. In this study, we investigate the feasibility of using MEGA-PRESS to detect Lac response to the visual stimuli in visual cortex in fMRS experiment.Method
Six subjects were enrolled for the studies and experiments were conducted in 3T MRI system (MR750, GE, Milwaukee USA). For each subject, T1 images were acquired using SPGR sequence. A fMRI experiment was performed using block design (6 stim and 6 rest) with checker board visual stimulation. Each on and off block consists of 10 seconds and the total scan time is 3 minutes. The experiment parameters using EPI sequence are TR/TE=2000/33 ms, FOV=220x220 mm2, Matrix=64x64, thickness=4mm. Online calculation was performed to localize the primary visual cortex. MRS experiment was performed using MEGA-PRESS sequence with VOI size in the range of 20~25 mm in AP and SI dimension and 40~59 mm in LR dimension according to the fMRI results. The parameters of MEGA-PRESS sequence are TR/TE=2000/142 ms, bandwidth =5000 Hz, sample point=4096. Gaussian-shaped editing pulses of 80-Hz bandwidth were applied at 4.11 ppm and 5.29 ppm in interleaved way. The MRS experiment is firstly conducted without visual stimuli for 25 minutes. Then fMRS experiment was conducted with 5 blocks (3 rest and 2 stimuli) and each block is 5 minutes. Checker board stimuli was presented during on block and the scan time is also 25 minutes.MEGA-PRESS data was processed using FID-A software package6 for coil combination, frequency and phase alignment, edit on and edit off reconstruction. The edit spectra were then quantified using LCModel with basis sets simulated with VeSPA7. Concentrations of Lac were reported using water scaling with relaxation and partial volume correction. Two analysis methods were performed. First, the averaged Lac concentrations over whole 25 minutes scan were compared between MRS and fMRS scans. Secondly, for the fMRS scan, Lac concentrations were averaged over the last 3.3 min of stimuli and rest blocks respectively.
Results
Figure 1 shows the VOI of MRS acquisitions (left), the averaged edit spectra of MRS (A, blue) and fMRS (A, red) scans from one subject (Sub3), and averaged edit spectra of rest (B, blue) and stimuli (B, red) blocks from fMRS scans. Evident increase of Lac concentration by 19% was found in fMRS scan while relative to MRS scan without stimuli. When comparing the activation with rest within each fMRS scan, an elevation up to 45% of Lac concentration was observed as shown in Fig.1. Figure 2 illustrated the Lac concentrations of 6 subjects compared between MRS and fMRS scans. The relative changes of Lac level range from 7% to 50% with CRLB (SD%) below 20%. Figure 3 demonstrated the changes of Lac concentrations between activation and rest periods in fMRS scans. Relative increase of Lac concentrations was found to be ranging from 0.61% to 45%.Discussions
The Lac increase corresponding to visual stimuli was successfully detected on 6 subjects in our study. The Lac change found in our study appears substantially consistent with the values published previously2,3. Currently, the experiment setting for fMRS is similar to fMRI, which is designed based on the well-known hemodynamic response. However, temporal response of metabolism to physiological stimuli is still unknown so far. In our study, larger Lac increase was found between activation and rest periods in fMRS among 4 of 6 subjects while comparing individual differences. Notably, only the spectra acquired during the last 3.3 min of each 5-min stimuli/rest block were averaged in our analysis to reduce the effect of Lac regulation. However, the less spectra to be averaged result in lower SNR and the worse fitting reliability (higher CRLB). More sophisticated approach to analyze fMRS data, especially for the time-course analysis, may facilitate solid metabolic quantification. It is still recommended to perform fMRS study on 7T system for reliable quantification on metabolites in vivo. However, at current stage, more outcomes on fMRS are also needed to get insight into brain metabolism during physiological stimuli. fMRS experiments conducted on current wide-spread 3T system can be still necessary.Acknowledgements
Support from MOST grant “108-2314-B-110-002” and Mind Research and Imaging Center (NCKU) is acknowledged.References
- Lin AL, Jahrling JB, Zhang W, DeRosa N, Bakshi V, Romero P, Galvan V, Richardson A: Rapamycin rescues vascular, metabolic and learning deficits in apolipoprotein E4 transgenic mice with pre-symptomatic Alzheimer's disease. J Cereb Blood Flow Metab 2017, 37(1):217-226.
- Bednarik P, Tkac I, Giove F, DiNuzzo M, Deelchand DK, Emir UE, Eberly LE, Mangia S: Neurochemical and BOLD responses during neuronal activation measured in the human visual cortex at 7 Tesla. J Cereb Blood Flow Metab 2015, 35(4):601-610.
- Schaller B, Mekle R, Xin L, Kunz N, Gruetter R: Net increase of lactate and glutamate concentration in activated human visual cortex detected with magnetic resonance spectroscopy at 7 tesla. J Neurosci Res 2013, 91(8):1076-1083.
- Schaller B, Xin L, O'Brien K, Magill AW, Gruetter R: Are glutamate and lactate increases ubiquitous to physiological activation? A (1)H functional MR spectroscopy study during motor activation in human brain at 7Tesla. Neuroimage 2014, 93 Pt 1:138-145.
- Edden RA, Harris AD, Murphy K, Evans CJ, Saxena N, Hall JE, Bailey DM, Wise RG: Edited MRS is sensitive to changes in lactate concentration during inspiratory hypoxia. J Magn Reson Imaging 2010, 32(2):320-325.
- Simpson R, Devenyi GA, Jezzard P, Hennessy TJ, Near J: Advanced processing and simulation of MRS data using the FID appliance (FID-A)-An open source, MATLAB-based toolkit. Magn Reson Med 2017, 77(1):23-33.
- Soher BJ, Wu WE, Tal A, Storey P, Zhang K, Babb JS, Kirov, II, Lui YW, Gonen O: Automated whole-brain N-acetylaspartate proton MRS quantification. NMR Biomed 2014, 27(11):1275-1284
Figures
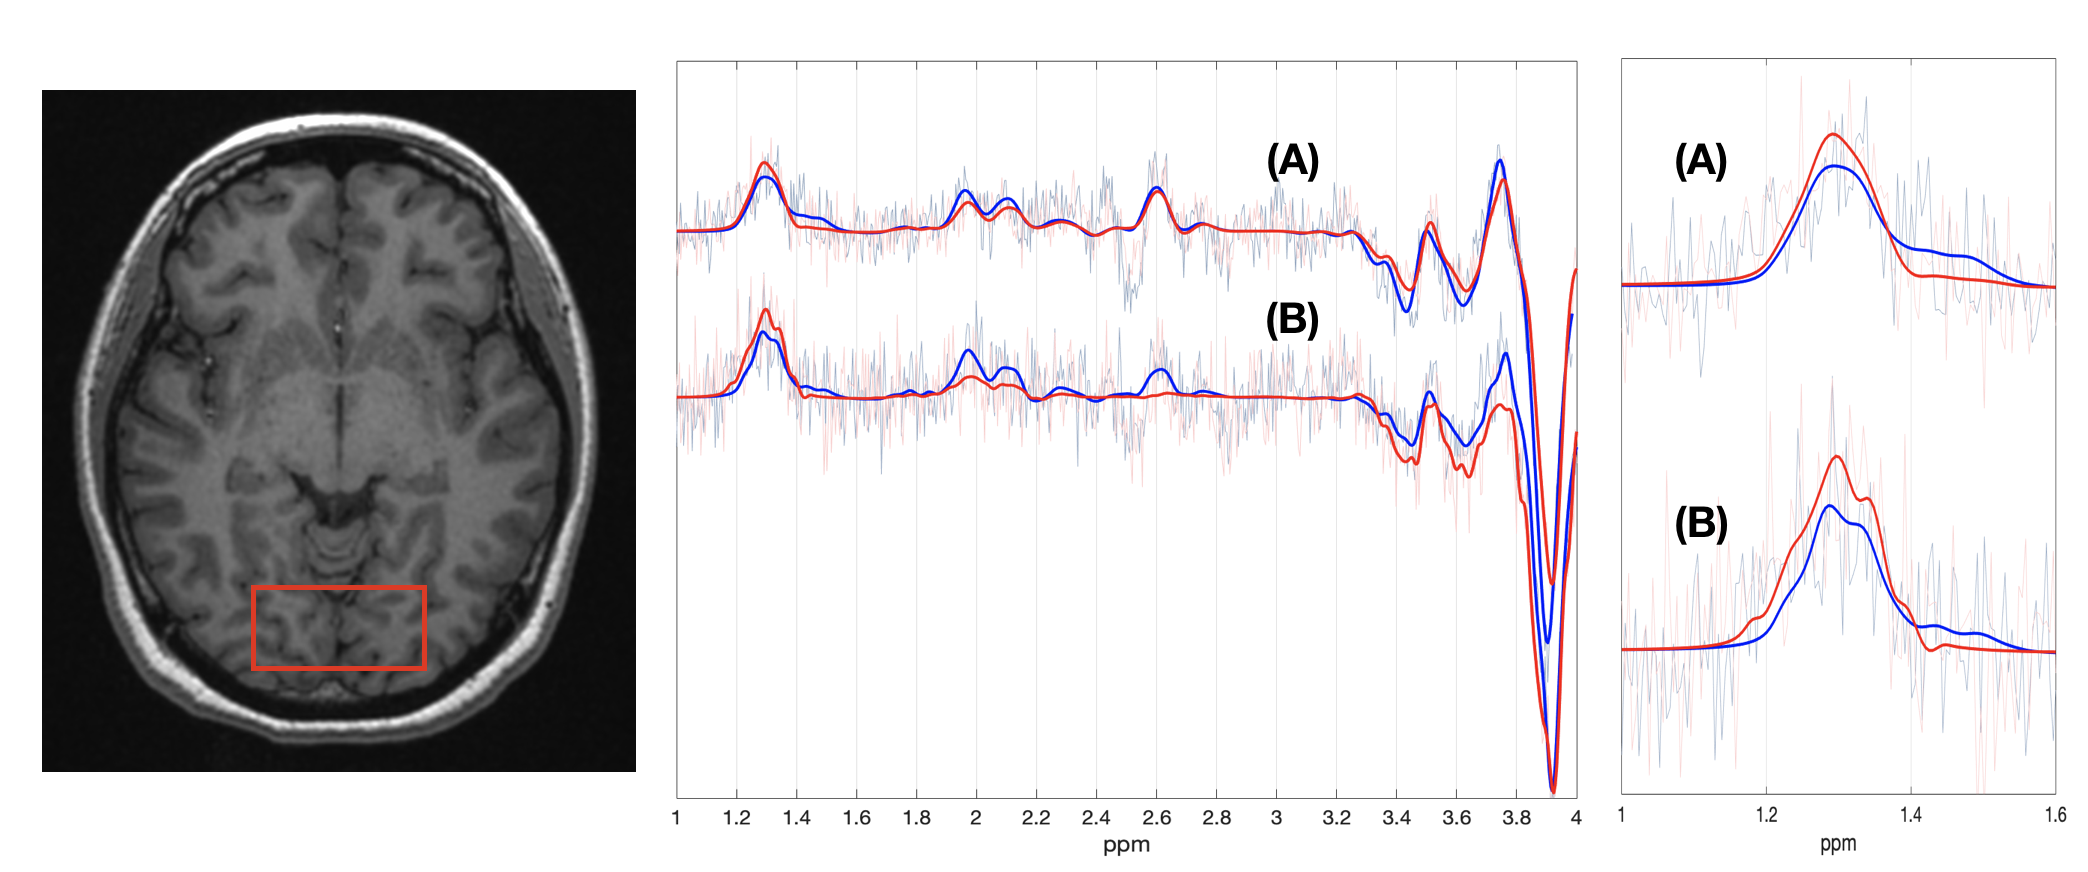
Figure 1. Spectra acquired in MRS and fMRS on
Subject #3. Location and size of the VOI
was placed according to fMRI activated area (left). Fitted spectra averaged over individual MRS
and fMRS scans were displayed in the middle while the enlargement from 1.0 to
1.6 ppm was shown on the right. (A)
spectra compared between MRS (blue) and fMRS (red); (B) spectra compared
between stimuli (red) and rest (blue) period in fMRS scan. Lac increase of 19% (A) and 45% (B) was
found in this case.
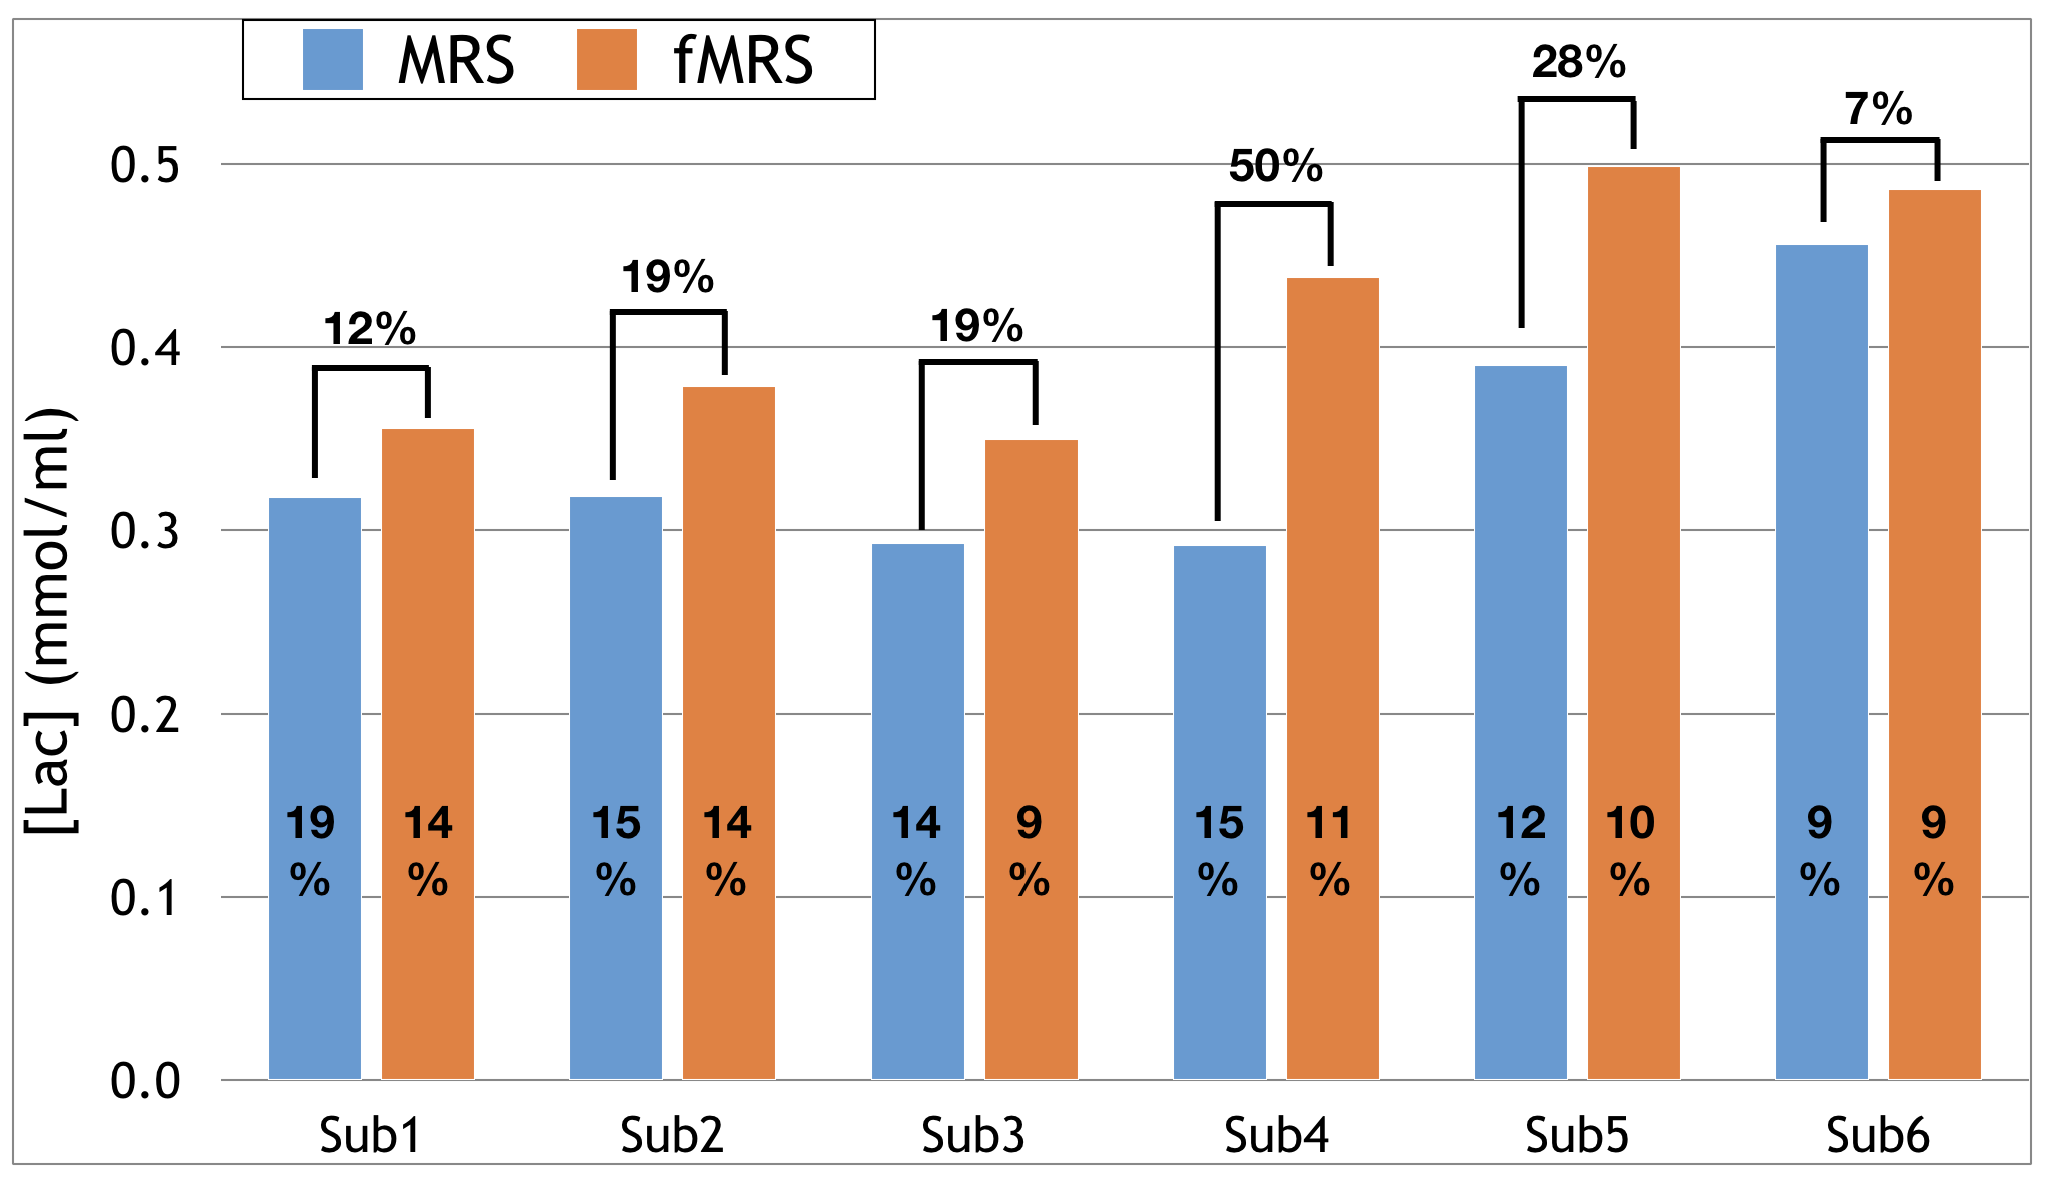
Figure
2. Lac concentrations of 6 subjects compared between the spectra averaged over
the whole 25-min of MRS and fMRS scans.
CRLBs (SD%) by LCModel were shown in each bar. Relative change (%) between MRS and fMRS
acquisitions was displayed above the paired bars.
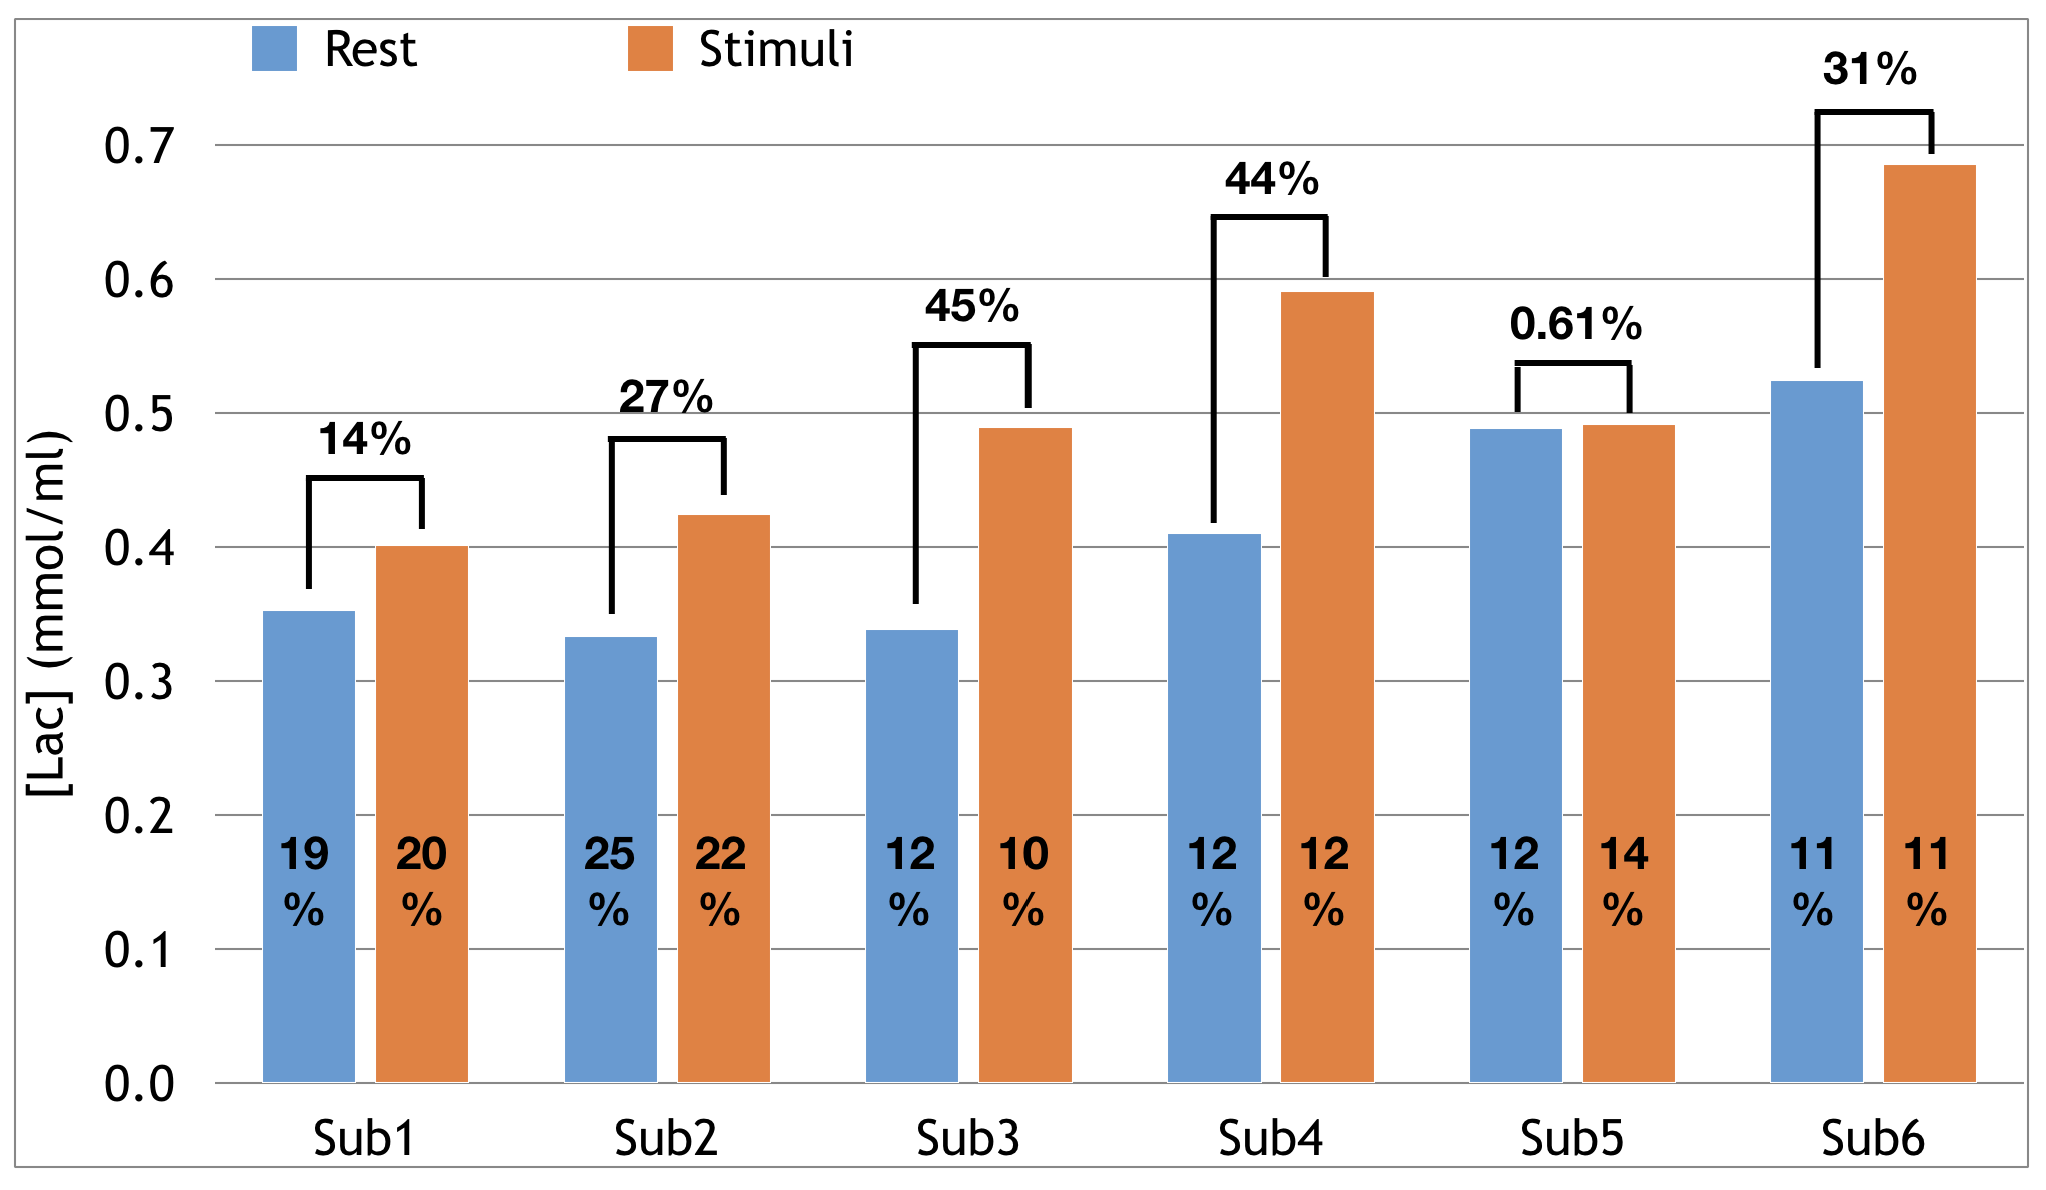
Figure
3. Lac concentrations of 6 subjects obtained from the spectra averaged over the
last 3.3-min of 5-min period of stimuli and rest blocks in fMRS scans. CRLBs (SD%) by LCModel were shown in each
bar. Relative change (%) between stimuli
and rest periods was displayed above the paired bars.