2940
In-vivo 1H-MRS Shows Differences in Polyunsaturated Fatty Acid Content between White and Brown Adipose Tissue in Humans.1Biomedical and Metabolic Imaging Branch, NIDDK/NIH, Bethesda, MD, United States, 2Translational Physiology Section, Diabetes, Endocrinology, and Obesity Branch, NIDDK/NIH, Bethesda, MD, United States, 3Energy Metabolism Section, Diabetes, Endocrinology, and Obesity Branch, NIDDK/NIH, Bethedsa, MD, United States
Synopsis
Localized 1H-MRS was used to compare the fatty acid composition and MR relaxation in PET proven metabolically active brown adipose tissue (BAT) in humans with white adipose tissue (WAT). Paired comparison of BAT and WAT results from the same individuals the showed differences in MR relaxation of fatty acid resonances and unsaturated fatty acid content between metabolically activatable brown fat and white adipose tissue
INTRODUCTION
Cold activatable brown adipose tissue (BAT) in humans can act as an endocrine system influences energy homeostasis, fat metabolism and obesity(1). MRS has been used to study the biochemical and biophysical properties of BAT in animals(2), but in humans mainly to measure the water content. We used Magnetic Resonance Spectroscopy (MRS) to characterize the lipid and water signals in 18FDG-PET proven cold activatable BAT in humans and subcutaneous white adipose tissue (WAT) to identify biophysical and biochemical differences between these tissues.METHODS
In 21 healthy subjects with normal body mass indices high resolution a set of oblique VARPRO water-fat images was recorded and used to identify potential brown fat regions near the clavicles and subcutaneous fat regions (see figure 1). In pure adipose tissue volumes selected in these regions a series of PRESS localized 1H spectra were recorded on a 3T Siemens to measure the T2 and T1 relaxation of 1H resonances with a logarithmic series or 16 TEs between 24 and 200ms and a fully relaxed spectrum at TE 24 ms to gauge the T1(3), see figure 2. Spectra were analyzed with AMARES time domain fitting(4) (see figure 3). 18FDG-PET after cold stimulation was used to retrospectively identify metabolically active BAT regions that matched locations of MRS volumes by two radiologists blinded to the MRS results. MRS derived results from volumes within active BAT regions were compared with results from subcutaneous WAT in the same individuals with paired two-tailed t-tests.RESULTS
1H-MRS data form nineteen PET proven cold activatable BAT areas in twelve individuals (age 28±11, BMI 23±2 kg/m2 4, male) could be matched to data from subcutaneous WAT. The T2 for FA chain methylene protons was significantly shorter in BAT than in WAT (BAT 69±7 ms, WAT 81±2 ms p <0.0001, N=19). Paired T2 data for the methylene resonance at 1.3 ppm T and WAT are shown in figure 4. The T1 of the methylene protons was longer in BAT (BAT 0.40±0.05 ms, WAT 0.37±0.04 ms, p <0.05, N= 19). The proton density of methylene protons adjacent to double bonds and diallylic methylene protons were both lower in BAT compared to WAT indicating a lower UFA and PUFA content in WAT. Expressed as a percentage of the sum of the proton densities of all FA resonances the proton density of the UFA methylene resonance was 10.2±4.2%in WAT versus 6.2±2.7% in BAT (p< 0.005, N=19). For the diallylic (PUFA) resonance this was 1.0±0.3% in WAT versus 0.7±0.4% in BAT (p < 0.005, N=19). The (relaxation corrected) proton density fat fraction was lower in BAT compared to WAT (79±7% and 88±6% p<0.0005, N=19).DISCUSSION
Differences in MR properties and FA composition between BAT and WAT have been demonstrated in ex-vivo samples from rodents(2). These results show that like in mice, human BAT has a lower UFA and PUFA content than WAT. The differences relaxation properties (longer T1 shorter T2) of BAT versus WAT are more consistent with a reduced fluidity of the triglycerides, as would be caused by a lower UFA content, than with a paramagnetic effect.CONCLUSION
The relaxation parameters differences found with 1H-MRS of BAT and WAT in humans can potentially be used as grounds for imaging method to identify BAT without the need for radiation or cold stimulation, thereby assist in quantification and improving understanding of BAT biology and future medical applications. The biochemical differences in unsaturated fatty acid content are likely related to the rates of lipogenesis from glucose and uptake of dietary FA in BAT and thus of great interest for understanding the biology of human BAT and for the development of BAT related medical solutions for obesity and diabetes.Acknowledgements
No acknowledgement found.References
1. Carpentier AC, Blondin DP, Virtanen KA, Richard D, Haman F, Turcotte ÉE. Brown adipose tissue energy metabolism in humans. Front. Endocrinol. (Lausanne). 2018;9:1–21.
2. Hamilton G, Smith DL, Bydder M, Nayak KS, Hu HH. MR properties of brown and white adipose tissues. J. Magn. Reson. Imaging 2011;34:468–473.
3. Ouwerkerk R, Cypess A, Chen K, et al. Spin Densities and Relaxation Parameters of the Spectral Components of Brown Fat and Subcutaneous Fat with Localized 1H-MRS at 3T . In: Proc. 25th Meeting of the ISMRM. 2017, p3436
4. Vanhamme L, van den Boogaart A, Van Huffel S. Improved method for accurate and efficient quantification of MRS data with use of prior knowledge. J. Magn. Reson. 1997;129:35–43.
Figures
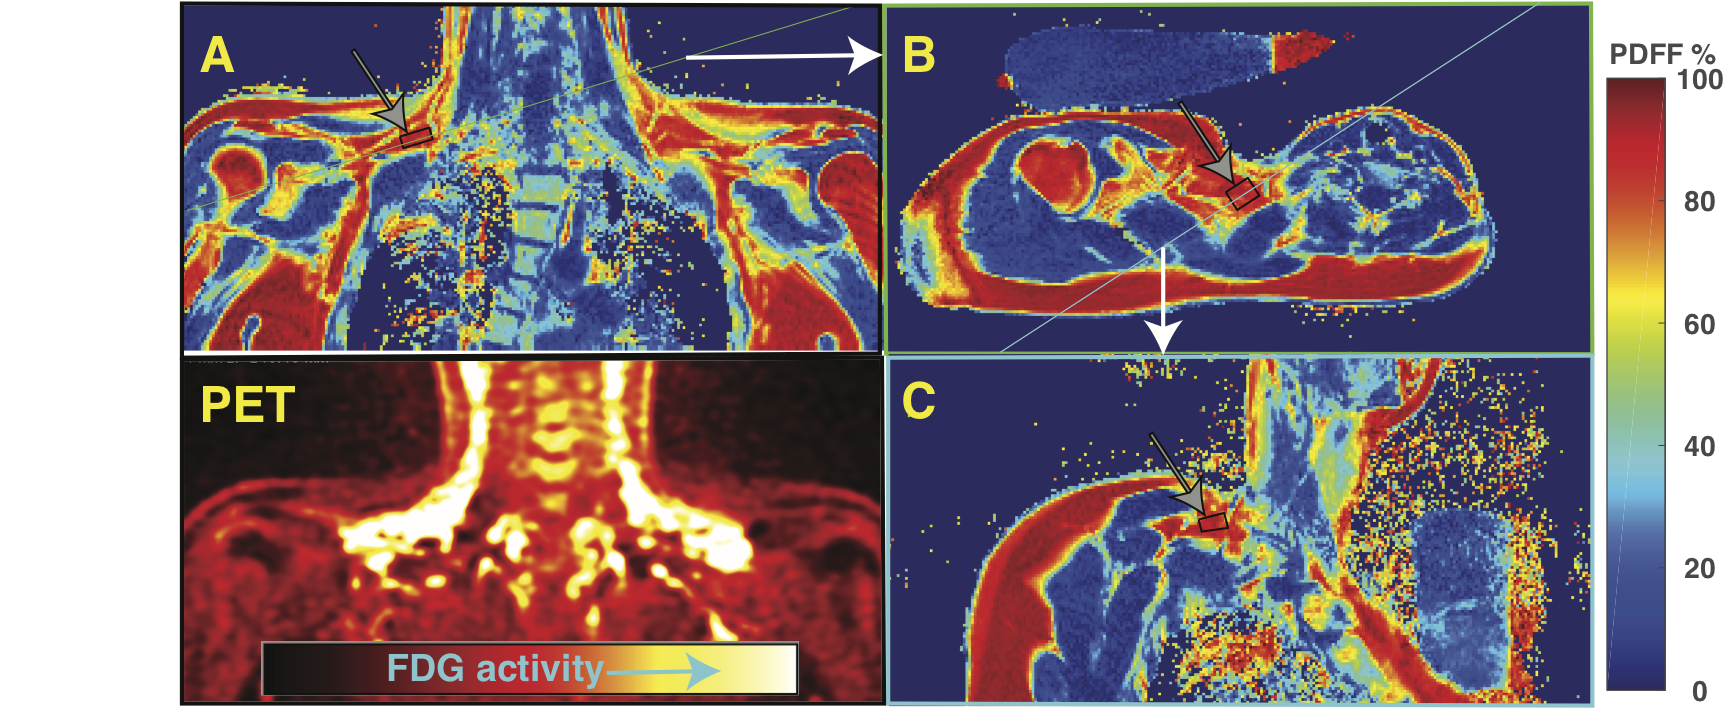
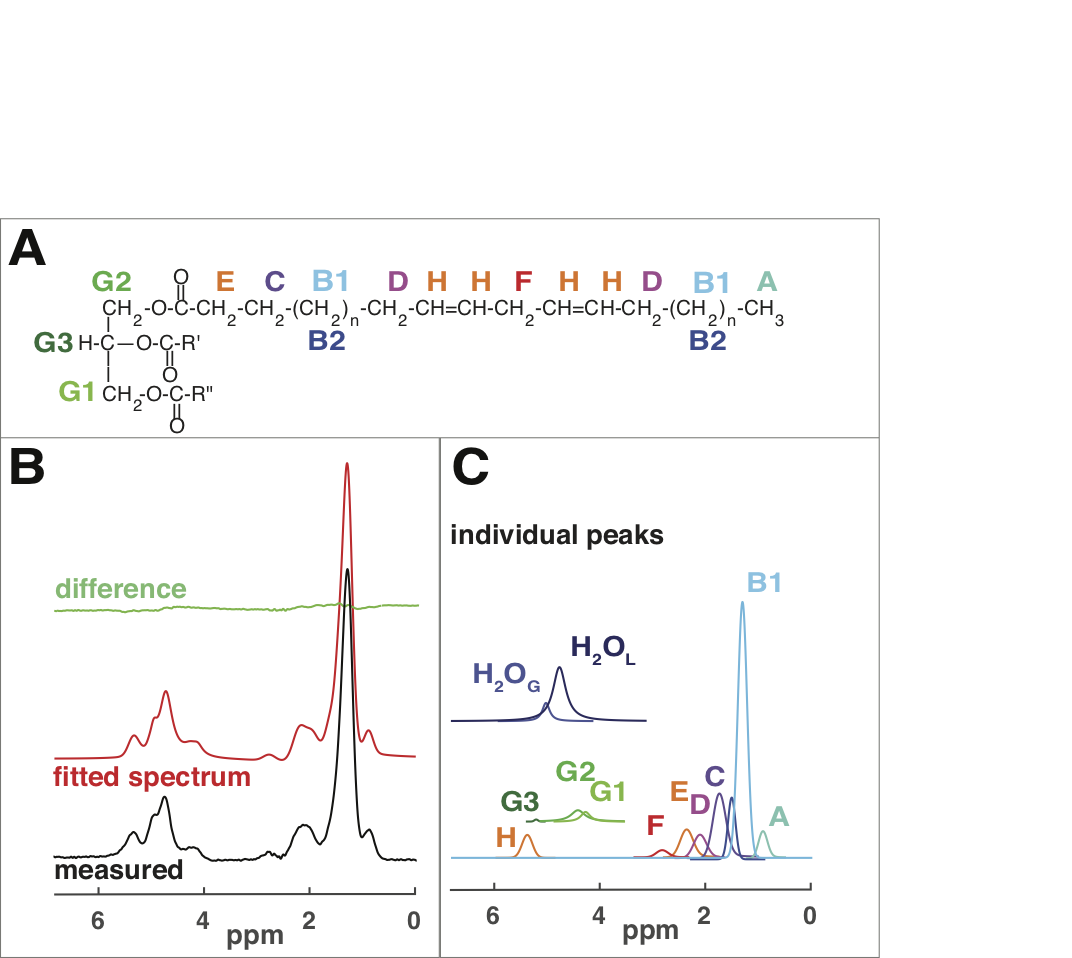
Figure 2. AMARES analysis (A) TG molecule with proton peak labels: A: methyl, B1and B2: two peaks to fit methylene, C: methylene b to COO, D: methylene a to HC=CH, E: methylene a to COO, F: diallylic methylene, G1,G2 and G3: glycerol, H: vinylic. (B) A 24ms TE spectrum of BAT. Measured (black), fitted (red), fit residual (green) (all same scale). (C) Individual fitted components. Glycerol G1, G2 and G3 and water peaks are offset for clarity. H2OL and H2OG: Lorentzian and Gaussian lines to fit water ( summed for estimates of the relaxation and water content).

