2937
Detection of metabolic alterations in the thalamus of the TMEV mouse model of multiple sclerosis at 9.4 Tesla1Department of Medical Physics, Jacobs School of Medicine and Biomedical Sciences, University at Buffalo, The State University of New York, Buffalo, NY, United States, 2Buffalo Neuroimaging Analysis Center, Department of Neurology, Jacobs School of Medicine and Biomedical Sciences, University at Buffalo, The State University of New York, Buffalo, NY, United States, 3Center for Biomedical Imaging at the Clinical and Translational Science Institute, University at Buffalo, The State University of New York, Buffalo, NY, United States
Synopsis
This study aimed to characterize the metabolic alterations in the thalamus throughout the disease course of Theiler's murine encephalomyelitis virus (TMEV) in mice using 9.4T MRS, and relate the findings to the known effects of microglia activation on neurotransmitter homeostasis. Our study confirmed that TMEV models metabolite alterations in Multiple Sclerosis. Dynamics of neurotransmitter imbalance suggest that early thalamic dyshomeostatis is driven by neuronal loss in basal ganglia input.
Introduction
Several recent studies using Quantitative Susceptibility Mapping (QSM) have reported declining thalamic iron levels in patients with multiple sclerosis (MS) over time1,2. The cause and cellular underpinnings of these findings remain unclear. PET and histopathology showed a high number of activated microglia in the thalamus in advanced disease stages3–8. We hypothesized that iron is released from oligodendrocytes through cytokines expressed by activated microglia9. The present study aimed to characterize the metabolic alterations in the thalamus throughout the disease course using 9.4T MRS, and relate the findings to the known effects of microglia activation on neurotransmitter homeostasis. We expected to see an increase of myo-inositol (INS) and glutamate (Glu) in the acute phase (influx of activated microglia10), followed by a decline in γ-aminobutyric acid (GABA; cytokine-induced11), further increase of Glu (activated microglia; cytokines11,12), and decline in N-acetylaspartate (NAA) and choline (PCh; neuropathology and myelin loss).Methods
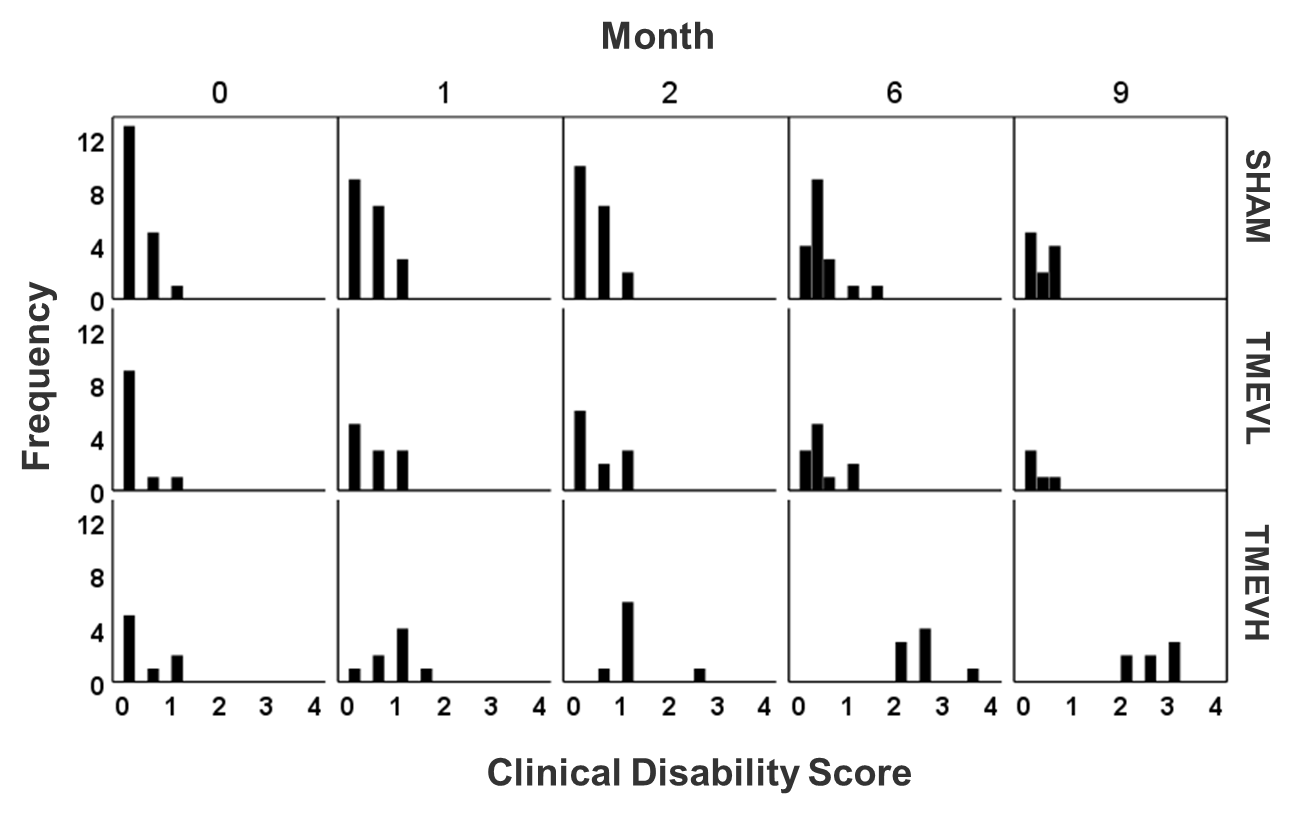
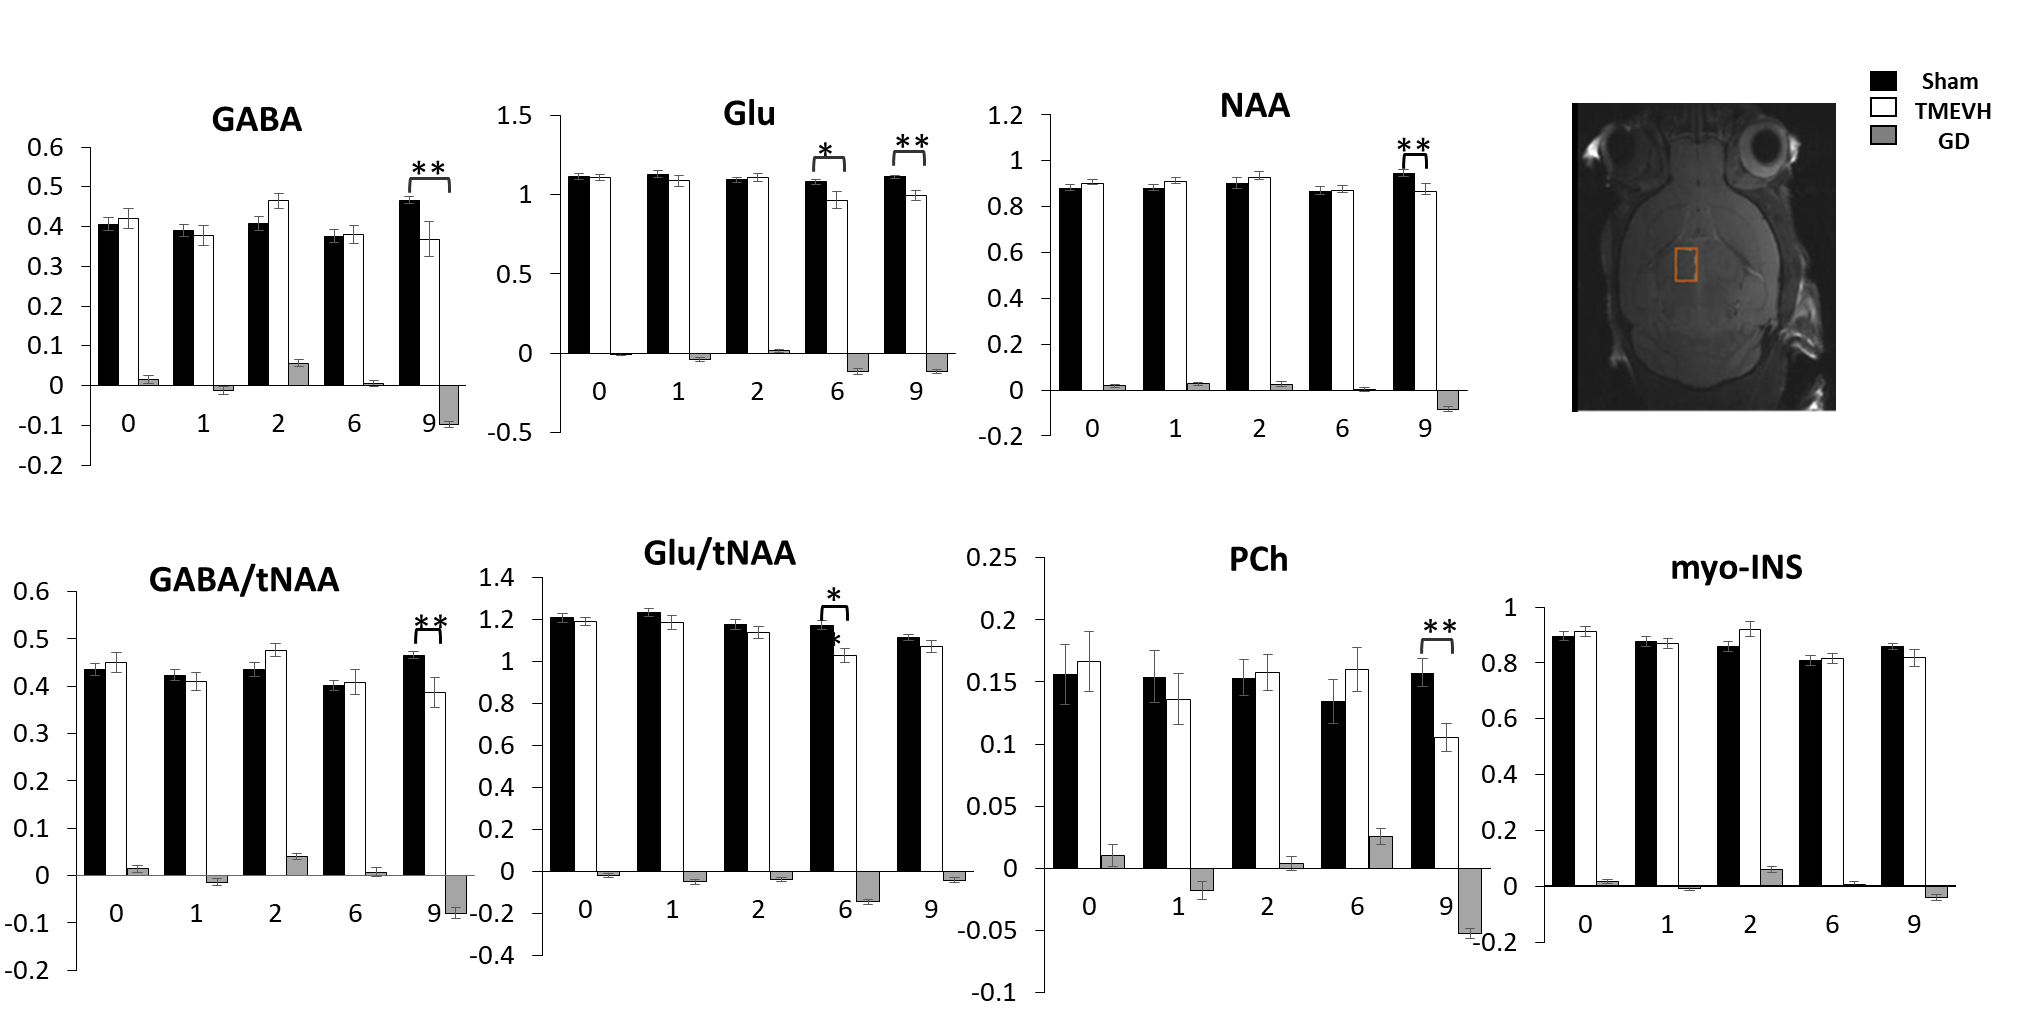
This work presents a revised analysis of previously reported preliminary data30. Here, we accounted for differences in infection levels and MRS referencing issues. Animals: Our study involved 38 Swiss Jim Lambert (SJL/J) animals. At seven weeks of age, we administered Theiler’s Murine Encephalomyelitis Virus (TMEV)13 into the right cortex of 19 animals by minimally invasive intracerebral injection, and phosphate buffer solution into the remaining 19 animals (shams). TMEV infection models certain aspects of multiple sclerosis (MS)14,15. The biphasic neurological disease starts with an early acute inflammation of the subcortical gray matter (< month 1)16,17 and progresses into a late chronic demyelinating phase associated with oligodendroglial damage that develops into a neurodegenerative phase (>4 months)18,19. Animals were assigned weekly Clinical Disability Scores (CDS) on a scale between 1 and 5 based on limb mobility and eventual death20. MRS: Isoflurane anesthetized mice were scanned at baseline and then at months 1, 2, 6, and 9 post-infection using a cryogenic transceiver coil at 9.4 Tesla (Bruker Biospec 94/20USR). We used 1H-UTE-STEAM21 acquisition (17mins; TE/TR=3.16/2000ms, 60kHz spectral width, NEX=512) with a 3.7µL voxel placed in the contralateral thalamus (Fig. 2-inset). Time-domain data were analyzed using LCModel22 and unreliable metabolites were excluded as described previously23,24 . Analysis: We used independent t-tests to study cross-sectional group differences. To study temporal alterations, we used a Linear Mixed Model (LMM) with group, time, and interaction as fixed factors25. To improve metabolite estimates, we used CDS, weights, and total NAA (tNAA=NAA+NAAG; except for NAA-analysis) as co-variates.Results
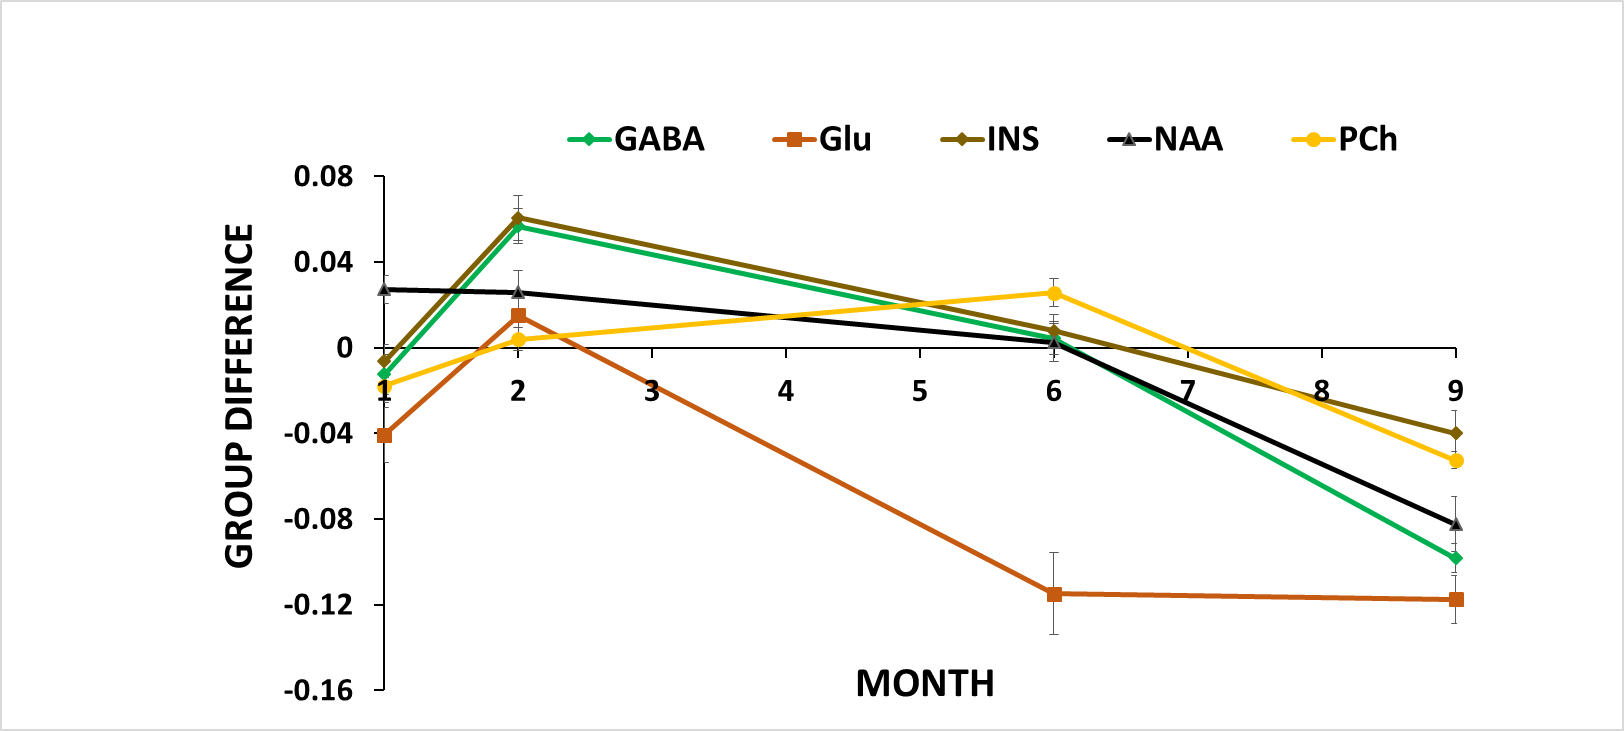
Disability: Analysis of CDS (Fig. 1) and body weight (Fig. 2A) revealed that a sub-group of TMEV animals did not develop the disease with sufficient disability to be clinically relevant (CDS<2 at month 9). We excluded these animals from further analyses (TMEVL; low disability). In animals with high disability (TMEVH), CDS monotonously increased with time compared to shams (month 2: p= 0.049; month 6: p=0.004; month 9: p<0.001; Fig. 2B). Bodyweight increased in all groups until month 4, where it sharply declined in TMEVH compared to TMEVL and shams (months 6, 9: p<0.008) (Fig. 2A). MRS-reference: Absolute concentrations showed substantial variability in shams,22 likely due to ventricular contamination. Referencing to total creatine (tCr) stabilized sham values. Absolute tCr was not significantly different between groups at any time point (p>0.35), validating its use as an internal reference. MRS-concentrations: Metabolites were similar at baseline (p>0.1), confirming accurate experimental conditions. We observed a consistent trend among metabolites toward increased concentrations in the acute phase, followed by a progressive decline (Figs. 3, 4). However, neither cross-sectional (p>0.06; Fig. 3) nor longitudinal (p>0.09; Tab. 1-left) alterations reached significance in the acute phase. In the progressive chronic phase, GABA, Glu, NAA, and PCh were reduced in TMEVH compared to shams (p<0.02; Fig. 3), with GABA, Glu, and PCh showing a significant decline over time compared to shams (Tab. 1-right). Accounting for neuronal loss (tNAA) showed that neurodegeneration can explain the reduced Glu at month 9 but not the reduced Glu at month 6 and GABA at month 9 (Fig. 3; Tab. 1-right).Discussion
Decreased PCh and NAA in the chronic phase are consistent with neuronal death and cerebral atrophy26. Decreased GABA has previously been reported in patients with secondary-progressive MS27. Increased GABA in the earlier disease phase (month 2), which just missed the significance threshold (p=0.06), is consistent with findings in relapsing-remitting MS (RRMS)28,29. Decreased Glu is in line with previous findings in RRMS29. Referencing to tNAA and using tNAA as covariate, respectively, revealed that neurotransmitter alterations were not driven merely by neuronal loss.Our finding of decreased Glu does not support the hypothesis of cytokine-induced excitotoxicity. Early increase and progressive decline in GABA point toward changing inhibitory input from basal ganglia prior to a decline in cortical (excitatory) input.
Conclusion
Our study confirmed that TMEV models metabolite alterations in MS. Dynamics of neurotransmitter imbalance suggest that early thalamic dyshomeostatis is driven by neuronal loss in basal ganglia input.Acknowledgements
This work was supported in part by University at Buffalo Center for Advanced Biomedical and Bioengineering Technology (UB CAT) and by National Center for Advanced Translational Sciences of National Institutes of Health under award number UL1TR001412. The content is solely the responsibility of the authors and does not necessarily represent the official views of the NIH.References
(1) Schweser, F.; Raffaini Duarte Martins, A. L.; Hagemeier, J.; Lin, F.; Hanspach, J.; Weinstock-Guttman, B.; Hametner, S.; Bergsland, N.; Dwyer, M. G.; Zivadinov, R., "Mapping of Thalamic Magnetic Susceptibility in Multiple Sclerosis Indicates Decreasing Iron with Disease Duration: A Proposed Mechanistic Relationship between Inflammation and Oligodendrocyte Vitality", NeuroImage, 167:438–452; 2018
(2) Zivadinov, R.; Tavazzi, E.; Bergsland, N.; Hagemeier, J.; Lin, F.; Dwyer, M. G.; Carl, E.; Kolb, C.; Hojnacki, D.; Ramasamy, D.; et al., "Brain Iron at Quantitative MRI Is Associated with Disability in Multiple Sclerosis", Radiology, 289(2):487–496; 2018
(3) Banati, R. B.; Newcombe, J.; Gunn, R. N.; Cagnin, A.; Turkheimer, F.; Heppner, F.; Price, G.; Wegner, F.; Giovannoni, G.; Miller, D. H.; et al., "The Peripheral Benzodiazepine Binding Site in the Brain in Multiple SclerosisQuantitative in Vivo Imaging of Microglia as a Measure of Disease Activity", Brain, 123(11):2321–2337; 2000
(4) Herranz, E.; Giannì, C.; Louapre, C.; Treaba, C. A.; Govindarajan, S. T.; Ouellette, R.; Loggia, M. L.; Sloane, J. A.; Madigan, N.; Izquierdo‐Garcia, D.; et al., "Neuroinflammatory Component of Gray Matter Pathology in Multiple Sclerosis", Annals of Neurology, 80(5):776–790; 2016
(5) Kaunzer U; "M. G. Uptake of [C11]PK11195 in the thalamus of Multiple Sclerosis (MS)", ectrims-congress; 2016
(6) Haider, L.; Simeonidou, C.; Steinberger, G.; Hametner, S.; Grigoriadis, N.; Deretzi, G.; Kovacs, G. G.; Kutzelnigg, A.; Lassmann, H.; Frischer, J. M., "Multiple Sclerosis Deep Grey Matter: The Relation between Demyelination, Neurodegeneration, Inflammation and Iron", J. Neurol. Neurosurg. Psychiatry, 85(12):1386–1395; 2014
(7) Rissanen, E.; Tuisku, J.; Rokka, J.; Paavilainen, T.; Parkkola, R.; Rinne, J. O.; Airas, L., "In Vivo Detection of Diffuse Inflammation in Secondary Progressive Multiple Sclerosis Using PET Imaging and the Radioligand 11C-PK11195", J. Nucl. Med., 55(6):939–944; 2014
(8) Vercellino, M.; Masera, S.; Lorenzatti, M.; Condello, C.; Merola, A.; Mattioda, A.; Tribolo, A.; Capello, E.; Mancardi, G. L.; Mutani, R.; et al., "Demyelination, Inflammation, and Neurodegeneration in Multiple Sclerosis Deep Gray Matter", J Neuropathol Exp Neurol, 68(5):489–502; 2009
(9) Zhang, X.; Surguladze, N.; Slagle-Webb, B.; Cozzi, A.; Connor, J. R., "Cellular Iron Status Influences the Functional Relationship between Microglia and Oligodendrocytes", Glia, 54(8):795–804; 2006
(10) Leray, E.; Yaouanq, J.; Le Page, E.; Coustans, M.; Laplaud, D.; Oger, J.; Edan, G., "Evidence for a Two-Stage Disability Progression in Multiple Sclerosis", Brain, 133(7):1900–1913; 2010
(11) Lee, M.; Schwab, C.; McGeer, P. L., "Astrocytes Are GABAergic Cells That Modulate Microglial Activity",Glia, 59(1):152–165; 2011
(12) Rossi, S.; Furlan, R.; De Chiara, V.; Motta, C.; Studer, V.; Mori, F.; Musella, A.; Bergami, A.; Muzio, L.; Bernardi, G.; et al., "Interleukin-1β Causes Synaptic Hyperexcitability in Multiple Sclerosis", Ann. Neurol., 71(1):76–83; 2012
(13) Theiler, M., "Spontaneous Encephalomyelitis of Mice- A new Virus Disease", Science, 80(2066):122–122; 1934
(14) Oleszak, E. L.; Chang, J. R.; Friedman, H.; Katsetos, C. D.; Platsoucas, C. D. "Theiler’s Virus Infection: A Model for Multiple Sclerosis", Clin Microbiol Rev, 17(1):174–207; 2004
(15) Dal Canto MC, Kim; Miller ; Melvold., "Theiler’s Murine Encephalomyelitis Virus (TMEV)-Induced Demyelination: A Model for Human Multiple Sclerosis", Methods, 10(3):453–461; 1996
(16) Rodriguez, M.; Leibowitz, J. L.; Lampert, P. W., "Persistent Infection of Oligodendrocytes in Theiler’s Virus-Induced Encephalomyelitis", Ann. Neurol.,13(4):426–433; 1983
(17) Oleszak, E. L.; Chang, J. R.; Friedman, H.; Katsetos, C. D.; Platsoucas, C. D., "Theiler’s Virus Infection: A Model for Multiple Sclerosis", Clinical Microbiology Reviews, 17(1):174–207; 2004.
(18) Drescher, K. M.; Pease, L. R.; Rodriguez, M. "Antiviral Immune Responses Modulate the Nature of Central Nervous System (CNS) Disease in a Murine Model of Multiple Sclerosis", Immunological Reviews, 159(1):177–193; 1997
(19) McGavern, D. B.; Murray, P. D.; Rivera-Quiñones, C.; Schmelzer, J. D.; Low, P. A.; Rodriguez, M., "Axonal Loss Results in Spinal Cord Atrophy, Electrophysiological Abnormalities and Neurological Deficits Following Demyelination in a Chronic Inflammatory Model of Multiple Sclerosis", Brain, 123 Pt 3 (Pt 3):519–531; 2000
(20) Pol, S.; Schweser, F.; Bertolino, N.; Preda, M.; Sveinsson, M.; Sudyn, M.; Babek, N.; Zivadinov, R. "Characterization of Leptomeningeal Inflammation in Rodent Experimental Autoimmune Encephalomyelitis (EAE) Model of Multiple Sclerosis", Experimental Neurology, 314:82–90; 2019
(21) Modica, C. M.; Schweser, F.; Sudyn, M. L.; Bertolino, N.; Preda, M.; Polak, P.; Siebert, D. M.; Krawiecki, J. C.; Sveinsson, M.; Hagemeier, J.; et al., "Effect of Teriflunomide on Cortex-Basal Ganglia-Thalamus (CxBGTh) Circuit Glutamatergic Dysregulation in the Theiler’s Murine Encephalomyelitis Virus Mouse Model of Multiple Sclerosis", PLOS ONE, 12(8):e0182729; 2017
(22) Provencher, S. W., "Estimation of Metabolite Concentrations from Localized in Vivo Proton NMR Spectra", Magnetic resonance in medicine, 30 (6):672–679; 1993
(23) Kreis, R., "Issues of Spectral Quality in Clinical 1H-Magnetic Resonance Spectroscopy and a Gallery of Artifacts", NMR in Biomedicine, 17(6):361–381; 2004
(24) Tkác, I.; Oz, G.; Adriany, G.; Uğurbil, K.; Gruetter, R., "In Vivo 1H NMR Spectroscopy of the Human Brain at High Magnetic Fields: Metabolite Quantification at 4T vs. 7T", Magn Reson Med, 62(4):68–879; 2009
(25) Orije, J.; Kara, F.; Guglielmetti, C.; Praet, J.; Van der Linden, A.; Ponsaerts, P.; Verhoye, M., "Longitudinal Monitoring of Metabolic Alterations in Cuprizone Mouse Model of Multiple Sclerosis Using 1H-Magnetic Resonance Spectroscopy", NeuroImage, 114:128–135; 2015
(26) Parry, L.; Shores, E.; Rae, C.; Kemp, A.; Waugh, M.-C.; Chaseling, R.; Joy, P., "An Investigation of Neuronal Integrity in Severe Paediatric Traumatic Brain Injury", Child neuropsychology : a journal on normal and abnormal development in childhood and adolescence, 10:248–261; 2005
(27) Cawley, N.; Solanky, B. S.; Muhlert, N.; Tur, C.; Edden, R. A. E.; Wheeler-Kingshott, C. A. M.; Miller, D. H.; Thompson, A. J.; Ciccarelli, O.,"Reduced Gamma-Aminobutyric Acid Concentration Is Associated with Physical Disability in Progressive Multiple Sclerosis", Brain, 138(Pt 9):2584–2595; 2015
(28) Bhattacharyya, P. K.; Phillips, M. D.; Stone, L. A.; Bermel, R. A.; Lowe, M. J., "Sensorimotor Cortex Gamma-Aminobutyric Acid Concentration Correlates with Impaired Performance in Patients with MS", American Journal of Neuroradiology, 34(9):1733–1739; 2013
(29) Nantes, J. C.; Proulx, S.; Zhong, J.; Holmes, S. A.; Narayanan, S.; Brown, R. A.; Hoge, R. D.; Koski, L., "GABA and Glutamate Levels Correlate with MTR and Clinical Disability: Insights from Multiple Sclerosis", Neuroimage, 157:705–715; 2017
(30) (ISMRM 2019) Longitudinal 9.4 Tesla 1H MRS in the thalamus of the Theiler’s encephalomyelitis virus (TMEV) mouse model of multiple sclerosis. http://archive.ismrm.org/2019/3200.html
Figures