2936
Glutamate, GABA and Excitatory/Inhibitory Ratios observed by Short-TE STEAM proton MRS measurements of young healthy subjects at 7T.
Tomohisa Okada1, Koji Fujimoto1, Dinh Ha Duy Thuy1, Hideto Kuribayashi2, Yuta Urushibata2, Ravi Teja Seethamraju3, Sinyeob Ahn4, and Tadashi Isa1
1Kyoto University, Kyoto, Japan, 2Siemens Healthcare K.K., Tokyo, Japan, 3Siemens Healthineers USA, Burlington, MA, United States, 4Siemens Healthineers USA, Berkeley, CA, United States
1Kyoto University, Kyoto, Japan, 2Siemens Healthcare K.K., Tokyo, Japan, 3Siemens Healthineers USA, Burlington, MA, United States, 4Siemens Healthineers USA, Berkeley, CA, United States
Synopsis
Relationship between glutamate and GABA as well as their regional differences have not been much investigated. Focused on the posterior cingulate cortex (PCC), the primary motor area (M1) and the primary visual area (V1), this study found significantly higher glutamate concentration and E/I ratios at PCC than others, whereas GABA concentration was significantly higher at V1 than others. Region-wise correlation analysis between glutamate and GABA found statistically significant correlation only at M1 (r = 0.69, p = 0.0005). These differences may reflect difference in functional status at rest, but further investigation is required to clarify the reasons.
INTRODUCTION
Excitatory neurotransmitter glutamate and inhibitory neurotransmitter gamma-aminobutyric acid (GABA) have been major targets of proton MRS, but their low concentration, especially GABA, has required special MRS measurements such as spectral editing1. However, at 7T, high signal-to-noise ratio and increased spectrum resolution enable separation of metabolites peaks better than 4T2. In addition, usage of a short-TE STEAM is advantageous to investigate small-amount metabolite peaks that have short T2 values2 and/or J-coupling3 without spectral editing, enabling a direct comparison between glutamate and GABA within a single scan. Recent investigation on a visual learning process found that overlearning abruptly changes neurochemical processing which can be understood from observation of abrupt shift from glutamate-dominant excitatory to GABA-dominant inhibitory processing in early visual areas as changes in excitatory/inhibitory (E/I) ratios4. This change suggests stabilization and protection of trained perceptual learning from subsequent new learning. However, relationship between glutamate and GABA as well as their regional differences have not been much addressed, and these issues were investigated in this study.METHODS
Young healthy subjects (36 subjects: 27 males and 9 females, mean age 22.6 years, aged 20 - 28 years), who had no known history of neuropsychiatric disorders or substance abuse, were enrolled with written informed consent under an IRB-approved protocol. MRS scans were conducted at the posterior cingulate (PCC) in 18 subjects (aged 20 - 28 years), the left primary motor area (M1) centered at the hand knob in 21 subjects (aged 20 - 26 years) and the primary visual cortex (V1) centered at the calcarine sulcus in 11 subjects (aged 21 - 25 years). Fourteen subjects were scanned twice at 2 different regions. Scans were conducted on a 7T whole-body scanner (70 mT/m maximum amplitude, 200 mT/m/ms maximum slew rate; Siemens, Erlangen, Germany) using a single-transmit volume coil and a 32-channel receiver head coil (Nova Medical, MA, USA). After a 3D whole-brain T1-weighted MPRAGE imaging (TR/TE/TI = 2300/3.26/1050 ms, FA = 9°, spatial resolution = isotropic 0.8 mm), a voxel of isotropic 20 mm was placed at PCC, M1 and V1. Proton MRS measurements were conducted using a short-TE STEAM sequence (Siemens prototype sequence: TR/TE/TM = 4000/5/45 ms, spectral width = 6 kHz, data points = 2048, averages = 32, scan time = 2 min and 24 sec). FASTMAP shimming (Siemens prototype sequence) and additional manual shimming were conducted. Water unsuppressed spectra were also acquired for eddy-current correction and quantitation.Spectral analysis was carried out using LCModel (version 6.3-1L)5. Glutamate and GABA concentration ratios were normalized by total creatine. E/I ratios were calculated as glutamate concentration divided by GABA concentration. Significance of regional differences was evaluated by using ANOVA or Kruskal-Wallis test dependent on the distribution normality of the data (Shapiro-Wilk test), and post-hoc Scheffe test was applied. Correlation between glutamate and GABA was also investigated. A p-value < 0.05 was considered statistically significant.RESULTS
No statistically significant difference was observed across age (p = 0.79) or gender (p = 0.96) among the subject groups. In MRS, Cramér-Rao lower bound (CRLB) values were 2 – 4 % and 7 – 15 % for glutamate and GABA, respectively. Mean (SD) concentration of glutamate were 1.23 (0.07), 1.07 (0.08) and 1.10 (0.04), and those of GABA were 0.19 (0.02), 0.21 (0.03) and 0.24 (0.04), at PCC, M1 and V1, respectively. E/I ratios were 6.45 (0.74), 5.30 (0.64) and 4.67 (0.69), respectively. In all of glutamate, GABA and E/I ratios were found to be different with statistical significance (All: p < 0.001). In the post-hoc Scheffe test, glutamate and E/I ratios were significantly higher at PCC than M1 and V1 (p < 0.05), whereas GABA was significantly higher at V1 than PCC and M1 (p < 0.05). See Figure 1. From the region-wise correlation analysis, glutamate and GABA were shown to be correlated only at M1 (See Fig. 2; r = 0.69, p = 0.0005).DISCUSSION
Regional and hemispheric differences in GABA concentration measured by MEGA-PRESS at 3T have been reported for frontal, parietal and occipital cortex in 21 healthy young subjects6. They found a significant regional dependence in GABA levels in that frontal cortex showed lower concentration than both parietal and occipital cortex, while no significant difference was found between parietal and occipital cortex. In our study, PCC, M1 and V1 were selected and measured as a key area of the default-mode network, primary motor and primary visual areas. As for GABA, V1 was higher than the other 2 areas, whereas glutamate was significantly higher than the other 2 areas. In our study, the subjects lay still with their eyes closed. In such a condition, PCC as demonstrating the default mode is active with significantly high glutamate and low GABA concentration, whereas the opposite was the case for non-functioning M1 and V1. Such a difference resulted in difference in E/I ratios. As for the correlation between GABA and glutamate, a significantly high correlation was found only in M1 (r = 0.69) and not in PCC and V1. These differences will require further investigation to clarify their reasons.CONCLUSION
Regional differences in glutamate, GABA and E/I ratios were evaluated and their clinical implication may need to warrant further investigations.Acknowledgements
A research grant from Siemens Healthcare K.K.References
1. Mescher, M., Merkle, H., Kirsch, J., Garwood, M. & Gruetter, R. Simultaneous in vivo spectral editing and water suppression. NMR Biomed 11, 266–272 (1998). 2. Tkáč, I., Öz, G., Adriany, G., Uğurbil, K. & Gruetter, R. In vivo 1H NMR spectroscopy of the human brain at high magnetic fields: Metabolite quantification at 4T vs. 7T. MRM 62, 868–879 (2009). 3. Marjańska, M. et al. Localized 1H NMR spectroscopy in different regions of human brain in vivo at 7 T: T2 relaxation times and concentrations of cerebral metabolites. NMR Biomed 25, 332–339 (2012). 4. Shibata, K. et al. Overlearning hyperstabilizes a skill by rapidly making neurochemical processing inhibitory-dominant. Nat Neurosci (2017) doi:10.1038/nn.4490 . 5. Provencher, S. Estimation of metabolite concentrations from localized in vivo proton NMR spectra. MRM 30, 672–9 (1993). 6. Grewal, M. et al. GABA quantitation using MEGA‐PRESS: Regional and hemispheric differences. JMRI 44, 1619–1623 (2016).Figures
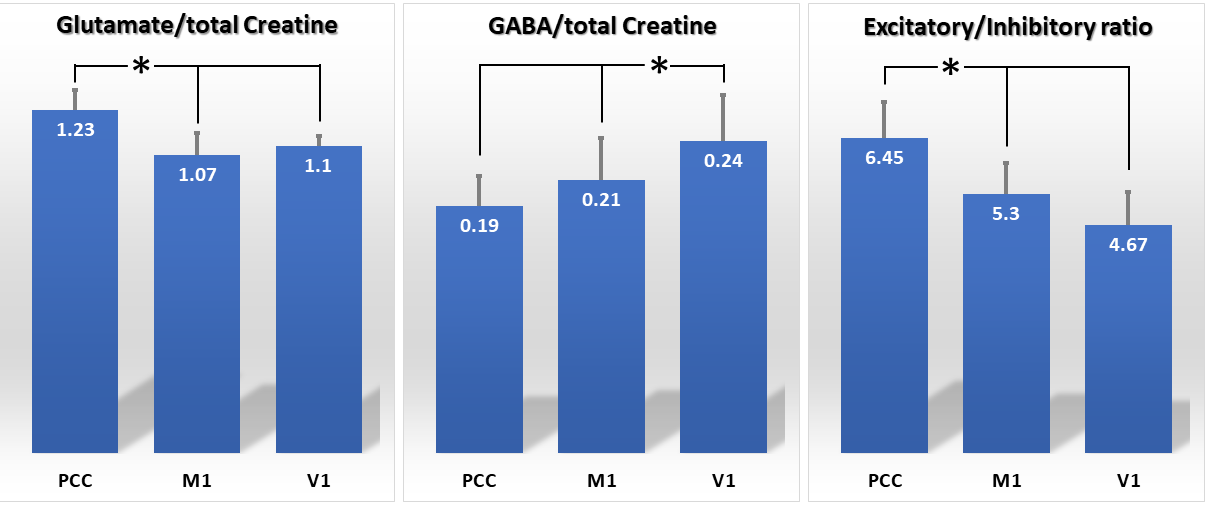
Figure 1. Concentrations of Glutamate and GABA were presented as ratios
compared with total Creatine. Their mean values are indicated at the top of
each bar. Error bars indicate standard
deviations. Excitatory/Inhibitory (E/I)
ratio is the ratio of Glutamate over GABA. *p < 0.05 by post-hoc Scheffe test. PCC: posterior cingulate cortex, M1: primary
motor area and V1: primary visual area.
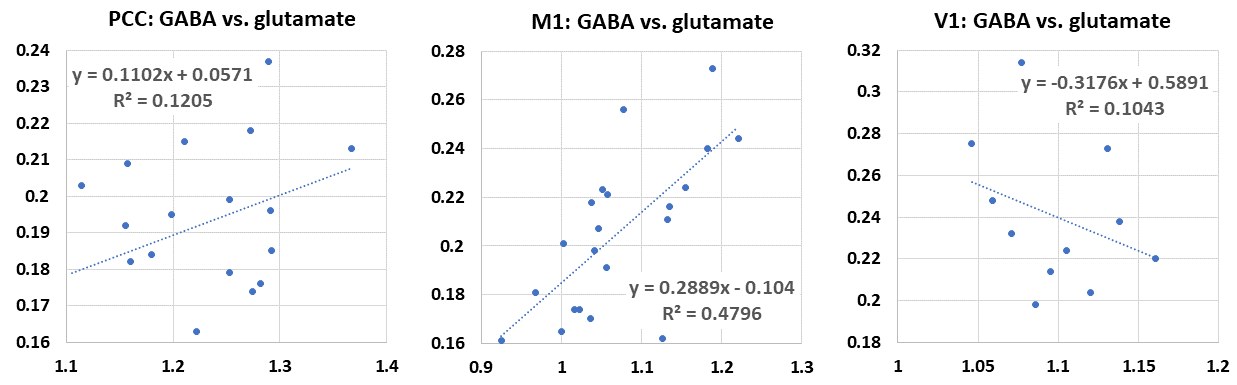
Figure 2. Correlation between Glutamate (X-axis) and GABA (Y-axis)
concentration ratios compared with total Creatine. Significant correlation was found only in M1 (r
= 0.69, p = 0.0005). PCC: posterior cingulate cortex, M1: primary motor area
and V1: primary visual area.