2933
Detection of metabolic abnormalities in different genotypes of Shank3 deficiency in mice using MRS at 11.7T
Ying Liu1,2, Lei Wei1,2, and Xiaoyong Zhang1,2
1Institute of Science and Technology for Brain-Inspired Intelligence, Fudan University, Shanghai, China, 2Key Laboratory of Computational Neuroscience and Brain-Inspired Intelligence (Fudan University), Ministry of Education, Shanghai, China
1Institute of Science and Technology for Brain-Inspired Intelligence, Fudan University, Shanghai, China, 2Key Laboratory of Computational Neuroscience and Brain-Inspired Intelligence (Fudan University), Ministry of Education, Shanghai, China
Synopsis
Shank3 plays an important role in the functioning of glutamatergic synapses. In this work, we investigated whether Shank3 deficiency could induce neuroimaging changes in a transgenic autism mouse model using structural MRI and MRS at 11.7T. Our data showed that the neurochemical metabolites in medial prefrontal cortex (mPFC) are significantly changed in Shank3 deficiency models of heterozygous and homozygous genotypes, relative to wildtype controls. However, the volume of mPFC does not show significant alteration among three groups. We concluded that metabolic abnormalities are closely related to different phenotypes of Shank3 deficiency in mice.
Introduction
The SH3 and multiple ankyrin repeat domains 3 (Shank3) is a synaptic scaffolding protein, which interacts with various synaptic molecules and influence glutamatergic metabolism in mammalian brain. Deletions of the Shank3 have been found associated with neuropathology of autism spectrum disorder (ASD), which is a neurodevelopmental disorder with phenotypic heterogeneity in its etiopathogenesis1–3 . Recent neuroimaging studies have revealed the critical role of Shank3 in ASD development using structural and functional magnetic resonance imaging (MRI) modalities4. Abnormalities in neurotransmitters have also been hypothesized to underlie ASD symptoms in the human5,6, but it remains unclear whether these metabolic abnormalities are associated with different genotypes of rodent Shank3 models of ASD. In the present work, using magnetic resonance spectroscopy (MRS), a powerful noninvasive tool for measurement of neurochemical information, we aimed to identify Shank3 deficiency ASD genotypes by measuring metabolic levels in the medial prefrontal cortex (mPFC) in mice at 11.7T.Materials and Methods
Animal model: All experimental protocols were approved by the Animal Ethics Committee of Fudan University. A total of 21 C57BL/6J Shank3 deficiency mice (male, 8 weeks old) and 8 age-control wildtype (WT) C57BL/6J mice were obtained from Slac Laboratory (Shanghai, China). Animals were divided into three groups: n = 8 for WT, n = 11 for heterozygous (HET) and n = 10 for homozygous (HOMO). To establish Shank3 deficiency rodent models, mice were injected with the SAD_G-mCherry-RV virus in mouse brain with a Nanofil syringe mounted on an UltraMicroPump UMP3 with a four channel Micro4 controller (World Precision Instruments, FL, USA). MRI was performed 4 weeks after virus injection.Data Acquisition: MRI experiments were performed at a 11.7T BioSpec 117/16 USR MRI system equipped with a CryoProbe (Bruker BioSpin, Ettlingen, Germany). T2-weighted images of the whole brain were acquired using a Rapid Acquisition with Relaxation Enhancement (RARE) sequence with the following parameters: TR/TE, 4000/30 ms; RARE factor, 8; spatial resolution, 80 × 80 × 400 μm3. 1H-MRS data was acquired using a stimulated echo acquisition Mode (STEAM) sequence with the following parameters: TR/TM/TE, 2000/10/3 ms; number of averages, 256; voxel size, 2 × 2 × 1 mm3 located in the medial prefrontal cortex (mPFC). An isoflurane dose, ranging from 1% to 1.5 %, was used for anesthesia in all imaging runs.
Data analysis: The T2-weighted images were used to generate the specific template and the prior tissue probability maps. Then a voxel-based morphometry (VBM) method was used to measure the volume of brain regions based on a mouse atlas7. 1H-MRS spectra were analyzed using LCModel software (Version 6.3-1L; http://s-provencher.com/pages/lcmodel.shtml). Only metabolites with Cramér–Rao bounds < 15% were considered for statistical analysis. One-way ANOVA with a Fisher's Least Significant Difference (LSD) post-hoc test was performed using SPSS 22.0 for Windows (SPSS Inc., USA) with p<0.05 as the significance criterion.
Results and Discussion
Figure 1 shows a voxel located in mPFC superimposed on the T2-weighted images, a representative LCModel fit and a subtracted residual, which reveal that the gamma-aminobutyric acid (GABA) peak at 2.28 ppm was resolved well. As shown in Figure 2, compared with WT group, the glutamine (Gln) exhibits a significant increase in both HET (p=0.019) and HOMO group (p=0.002); the glutamate (Glu) shows a significant increase only in HOMO group (p=0.036), while the GABA signal does not show any significant difference between groups. We further measured the balance of GABA/GLx and found significant decreases of GABA /Gln ratio (p=0.007) , GABA/Glu ratio (p=0.046) and GABA/Glx ratio (p=0.021) in HET group (Figure 3), which may reflect inhibition/excitation imbalance in cortex, or a disruption in synaptic mechanisms that contribute to ASD psychopathology6,8. Moreover, relative to the HOMO and WT group, the concentrations of myo-Inositol (Ins) and choline are significantly lower in HET group, p<0.05 and p<0.0001 respectively, indicating abnormalities in cellular membrane metabolism and reduction in cell signaling in heterozygous mice6,9. To further investigate the relationship between morphometric change and metabolic activities, we measured the volume of mPFC using VBM. Our data show that compared with the WT group, no significant changes were observed in mPFC either in the HET or HOMO group (Figure 4).Conclusion
With MRS, our data showed that neurochemical profile of mPFC is significantly changed in different phenotypes of SHANK3 deficiency ASD. Moreover, the heterozygous genotype shows significant abnormalities in excitation/inhibition neurotransmitter cycle, as well as lower levels of Ins and tCho. However, the volume of mPFC does not show significant alteration between different groups. We concluded that metabolic abnormalities are closely related to different phenotypes of SHANK3 deficiency in mice.Acknowledgements
This work was supported by grants from the National Natural Science Foundation of China (81873893), the key project of Shanghai Science & Technology (16JC1420402), and Shanghai Municipal Science and Technology Major Project (2018SHZDZX01) and ZJlab.References
- Durand, C. M. et al. Mutations in the gene encoding the synaptic scaffolding protein SHANK3 are associated with autism spectrum disorders. Nat. Genet. 39, 25–27 (2007).
- Yang, M. et al. Reduced excitatory neurotransmission and mild Autism-Relevant phenotypes in adolescent shank3 null mutant mice. J. Neurosci. 32, 6525–6541 (2012).
- Peça, J. et al. Shank3 mutant mice display autistic-like behaviours and striatal dysfunction. Nature 472, 437–442 (2011).
- Pagani, M. et al. Deletion of Autism Risk Gene Shank3 Disrupts Prefrontal Connectivity. J. Neurosci. 39, 5299–5310 (2019).
- Horder, J. et al. Glutamate and GABA in autism spectrum disorder-a translational magnetic resonance spectroscopy study in man and rodent models. Transl. Psychiatry 8, 1–11 (2018).
- Ford, T. C. & Crewther, D. P. A Comprehensive Review of the 1H-MRS Metabolite Spectrum in Autism Spectrum Disorder. Front. Mol. Neurosci. 9, (2016).
- Ullmann, J. F. P., Watson, C., Janke, A. L., Kurniawan, N. D. & Reutens, D. C. A segmentation protocol and MRI atlas of the C57BL/6J mouse neocortex. Neuroimage 78, 196–203 (2013).
- Bak, L. K., Schousboe, A. & Waagepetersen, H. S. The glutamate/GABA-glutamine cycle: aspects of transport, neurotransmitter homeostasis and ammonia transfer. J. Neurochem. 98, 641–653 (2006).
- Rae, C. D. A Guide to the Metabolic Pathways and Function of Metabolites Observed in Human Brain 1H Magnetic Resonance Spectra. Neurochem. Res. 39, 1–36 (2014).
Figures
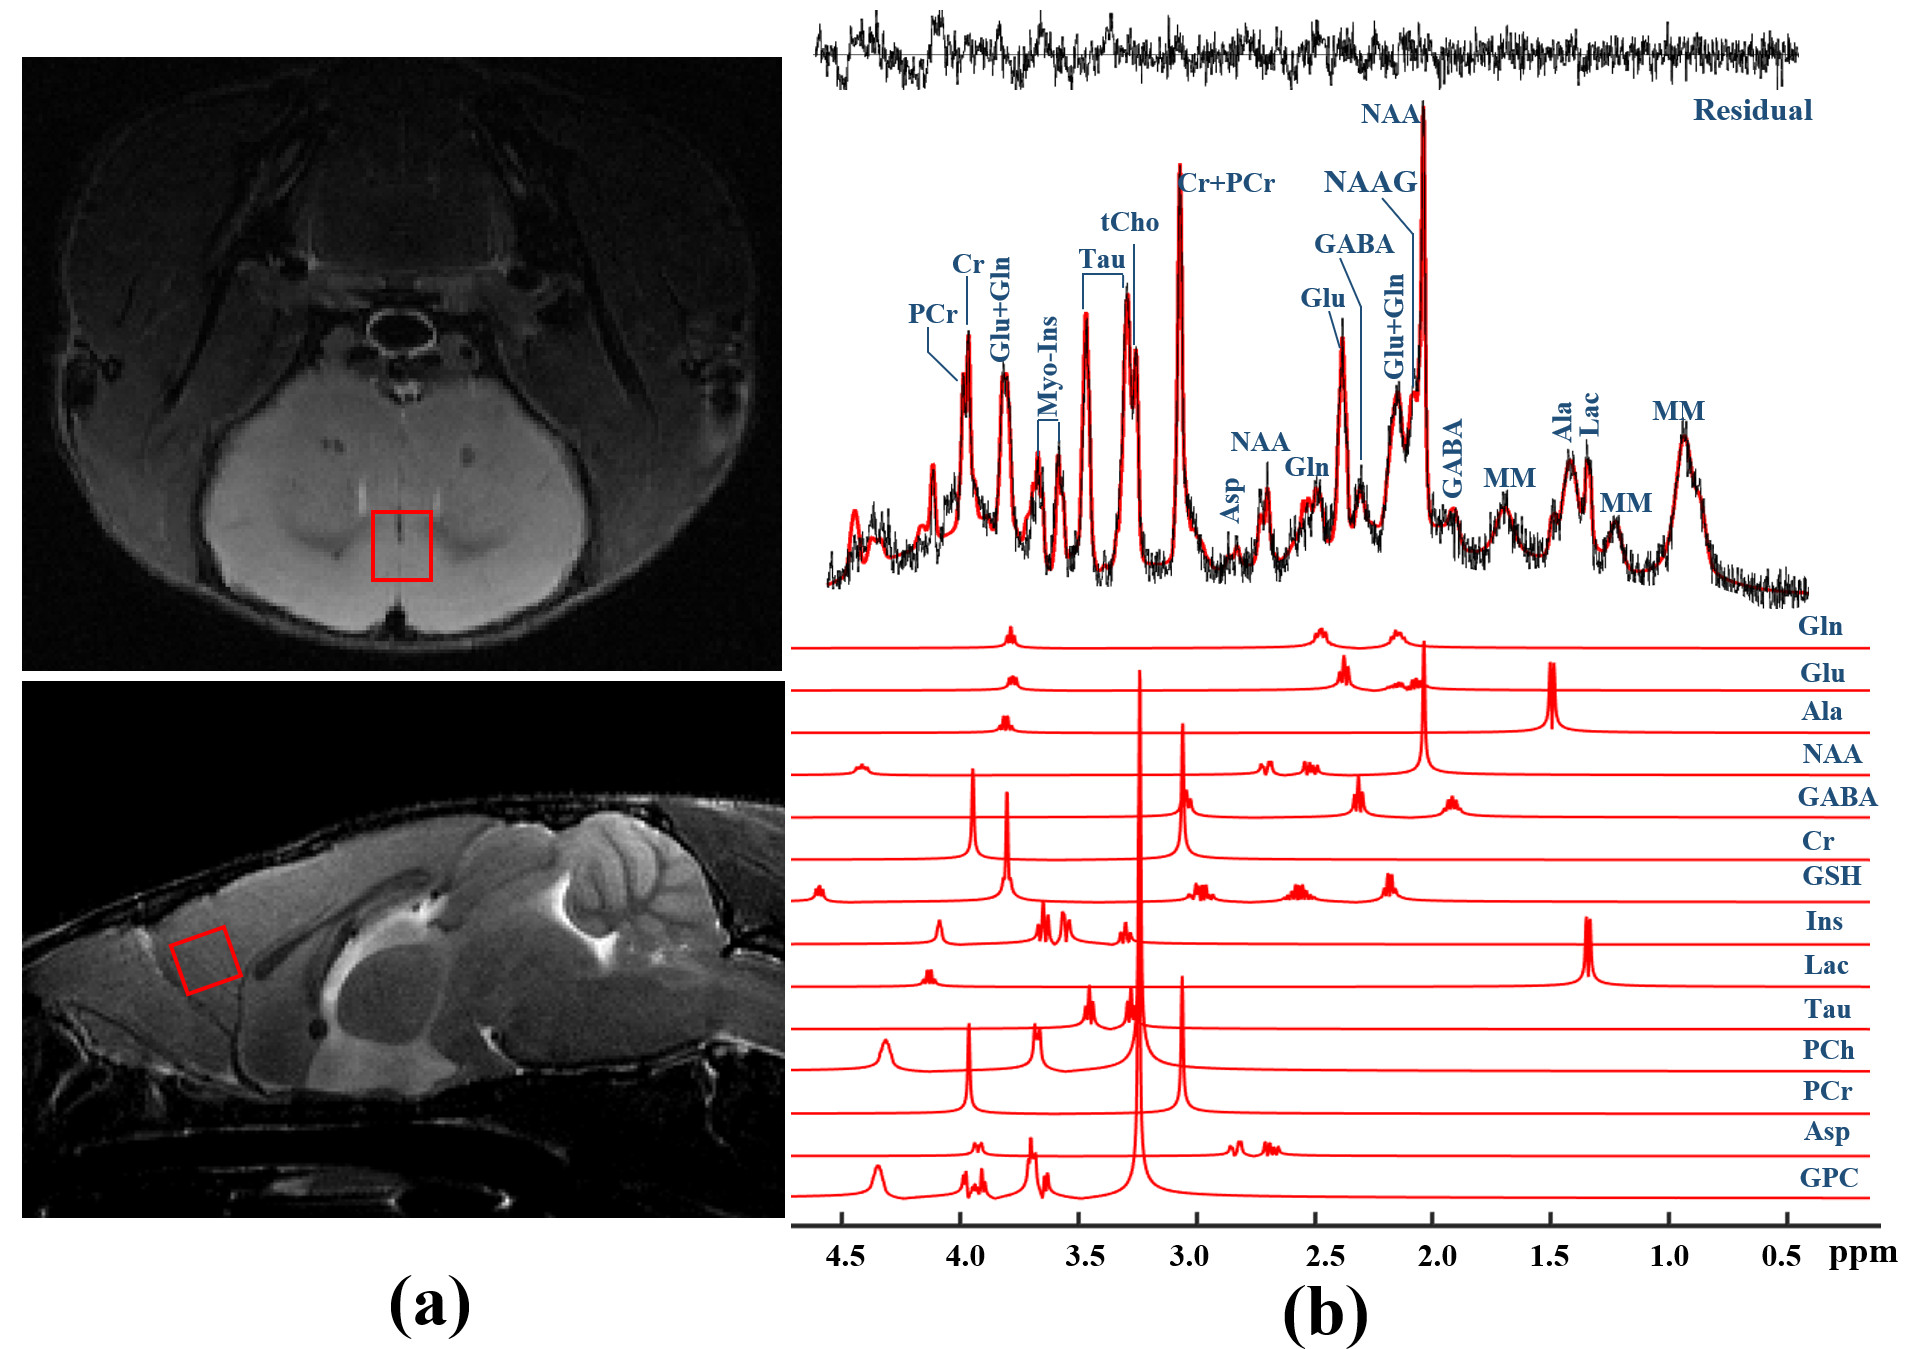
Figure 1. Representative 1H-MRS spectrum
acquired from mPFC in mouse brain. (a) The region of interest is indicated
by the red rectangles superimposed on T2W images and (b) corresponding
raw spectrum (black line), superimposed LCModel fit (red line), the fit
residual, and the spectra of selected metabolic individuals included in the
basis sets are shown.
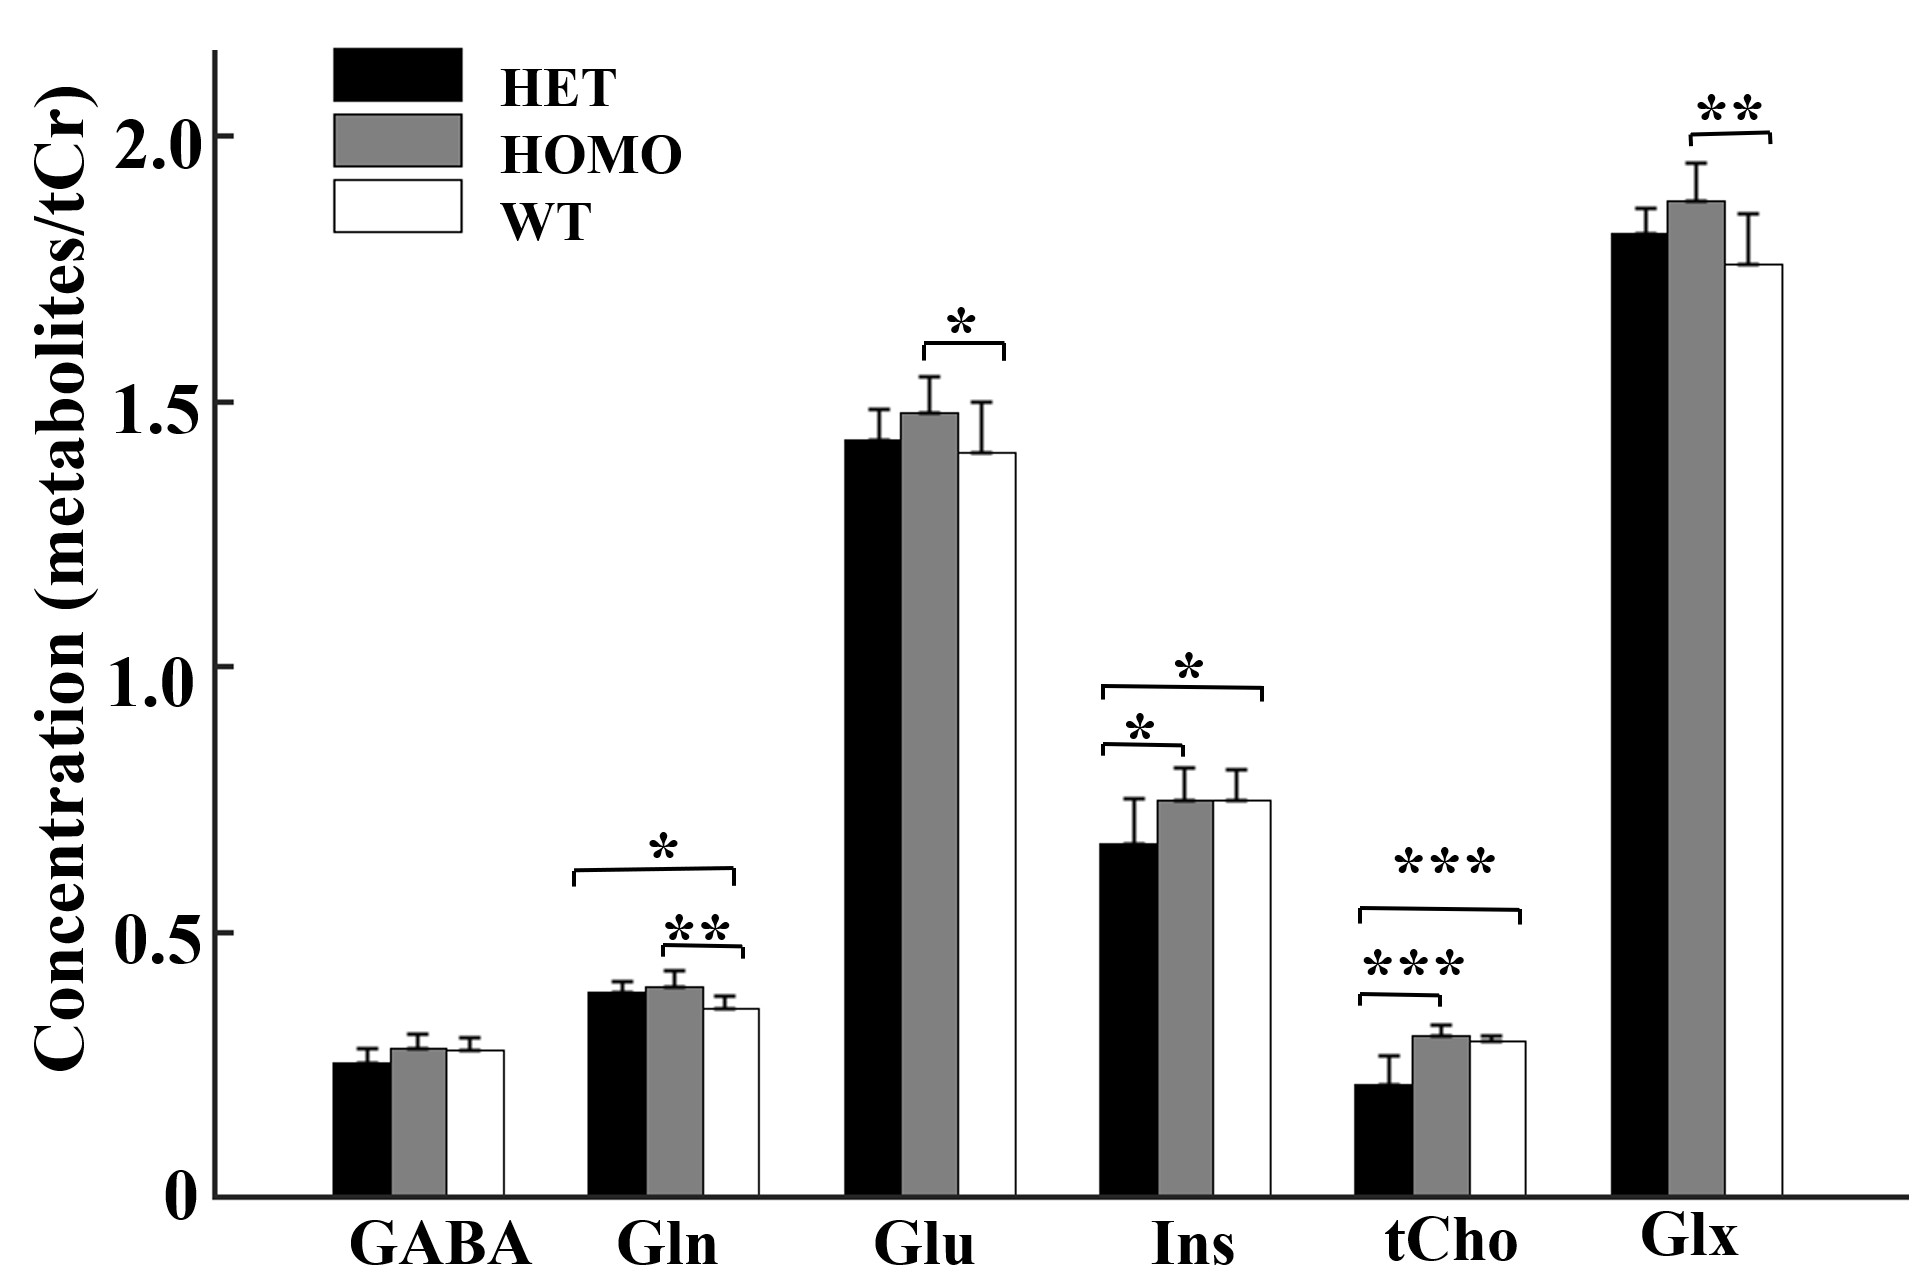
Figure 2. Comparison of metabolites observed by 1H-MRS
in the mPFC of heterozygous, homozygous and wildtype mice. Statistical
analysis was performed by one-way ANOVA (factorial analysis, significant
threshold set to 0.05) with Fisher's LSD post-hoc test (***p < 0.001; **p
< 0.01; *p < 0.05).
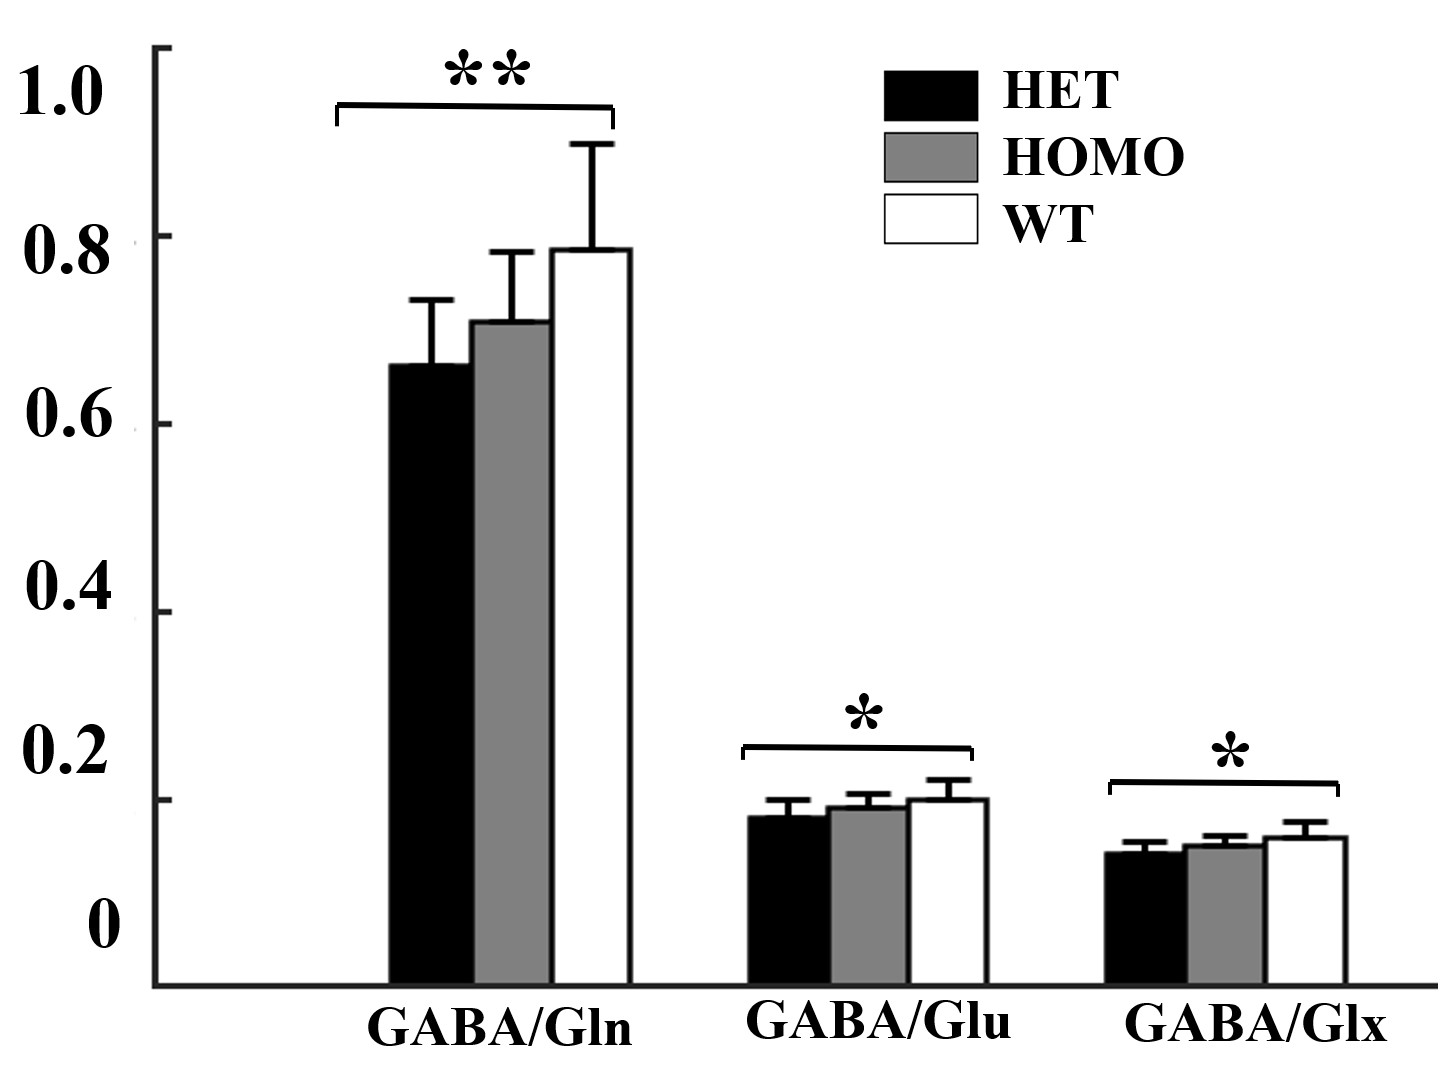
Figure 3. Comparison of GABA/Gln ,GABA/Glu and GABA/Glx
ratios in the mPFC among three groups. Statistical analysis was performed by
one-way ANOVA (factorial analysis, significant threshold set to 0.05) with
Fisher's LSD post-hoc test (**p < 0.01; *p < 0.05).
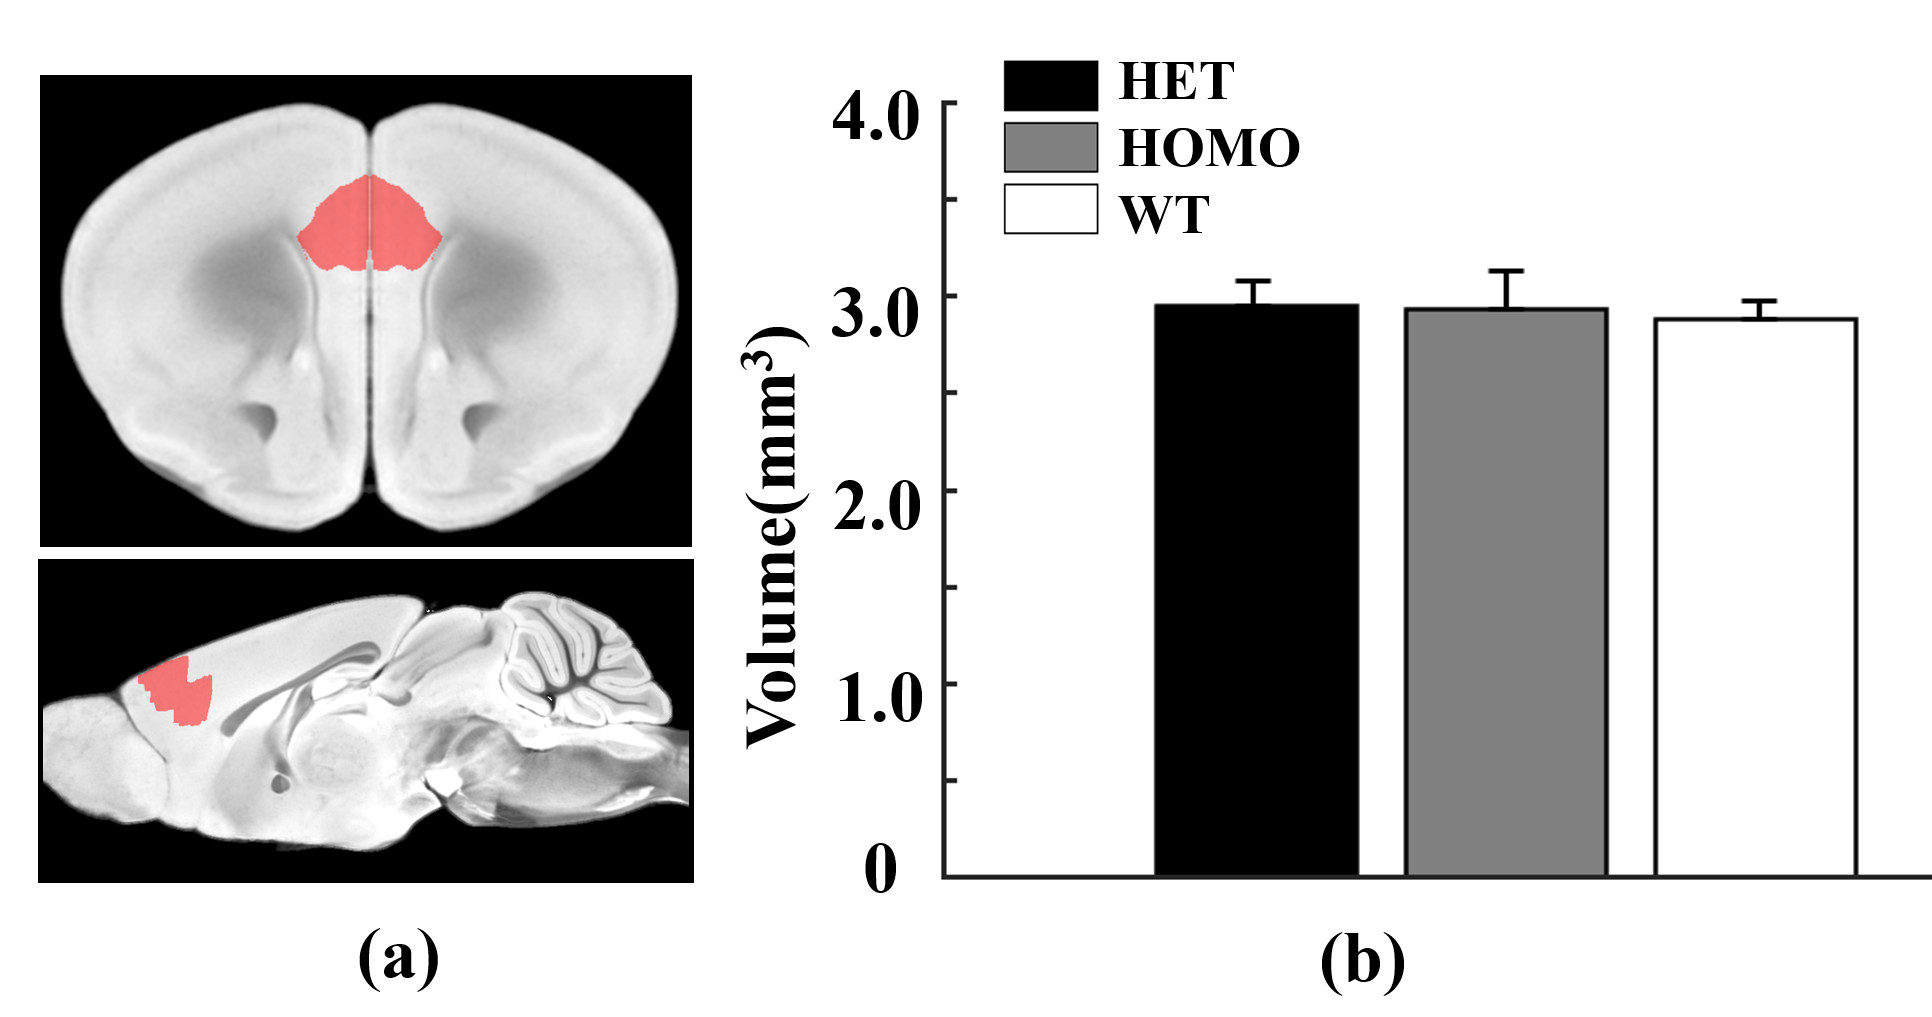
Figure 4 Morphometry analysis of mPFC using VBM in heterozygous,
homozygous and wildtype mice. (a) The region of interest (red mask) on
the AMBMC template. (b) Corresponding volume for three groups. Statistical analysis was performed by one-way ANOVA.