2931
Metabolic Profile Differences in Serum of Sepsis Patients may Identify Survivors and Non-Survivors
Virendra Kumar1, Naveen Kumar MS2, sujeet kumar mewar1, Pradeep Kumar1, Naveet Wig2, Prayas Sethi2, and Sanjeev Sinha2
1Department of NMR, All India Institute of Medical Sciences, New Delhi, India, 2Department of Medicine, All India Institute of Medical Sciences, New Delhi, India
1Department of NMR, All India Institute of Medical Sciences, New Delhi, India, 2Department of Medicine, All India Institute of Medical Sciences, New Delhi, India
Synopsis
The present study reported the differences in metabolic profile of serum samples from patient with sepsis to identify survivor and non-survivor (day 0) using NMR metabolomics. A significantly higher concentration of tyrosine, histidine, methionine, betaine, creatine, phosphocreatine and choline in the serum of sepsis patients who did not survive septic shock compared to survivors. These findings suggest that metabolic alterations at day 0 may predict the survival of the septic patients.
Introduction
Sepsis is a life-threatening organ dysfunction caused by a deregulated host response to infection. Septic shock is a subset of sepsis with underlying circulatory cellular and metabolic abnormalities associated with higher mortality rates1-2. Early supportive therapy with fluid resuscitation and vasopressors to restore hemodynamics and reduce tissue hypo-perfusion is decisive for the patient’s outcome and has figured in treatment guidelines for decades. However, mortality rates for septic shock may reach about 60% even with early treatment and poor prognosis mainly related to multi-organ dysfunction or MOF3. One of the most accepted organic dysfunction scores in sepsis management is the Sequential Organ Failure Assessment score (SOFA)4. The present study was carried to investigate the metabolic profile of serum sample of sepsis patients who were survivor at day 7.Methods
Sepsis Patients admitted in Medicine ICU with proven sepsis were included in the study. Blood sample collected from sepsis patients at 0 day. Sepsis patients survival was taken at day 7. Proton spectra of serum samples were carried out at 700 MHz spectrometer (Agilent, USA). One dimensional 1D CPMG with water pre-saturation was acquired at 25°C with following parameters: spectral width: 9124.1 Hz; scans: 64; relaxation delays: 70s. Two dimensional (2D) total correlation spectroscopy (TOCSY) experiments were carried out for assignments of resonances. The data was processed using the Vnmrj 2.3A software (Agilent technologies). For comparison between two groups, unpaired Mann–Whitney U test was used. A p-value < 0.05 was considered significant. Statistical analysis was carried out using SPSS software (SPSS Inc. Chicago, IL, USA) and MetaboAnalyst4.0. In order to analyze the data obtained in the performed studies, the univariate (receiver operating characteristics (ROC) curve analysis) and multivariate (orthogonal partial least squares–discriminant analysis (OPLS-DA), variable importance to projection (VIP) score, statistical analyses were applied in serum samples of non-survivor and survivor sepsis patients.Results
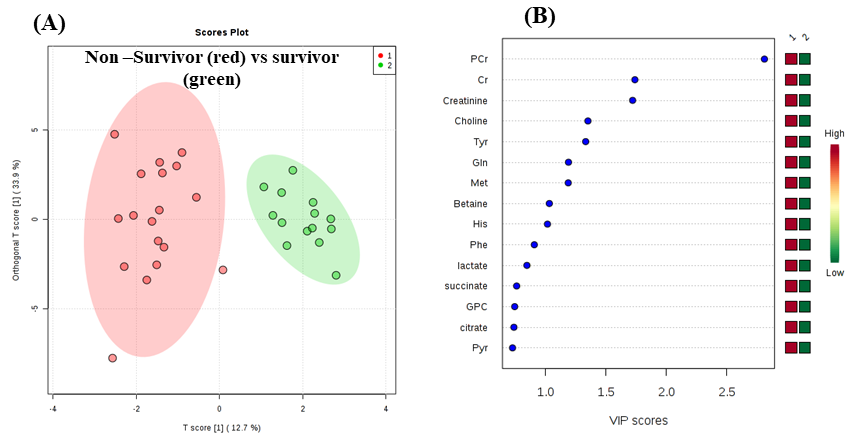
In all, 30 metabolite were assigned using 1D and 2D NMR. Figure 1 shows the representative aliphatic region of 1D proton NMR spectrum of serum sample of a sepsis patient day 0 non- survivor (A) and a sepsis patient day 0 survivor (B). The concentration [mM (mean (range)] of 7 metabolites that showed significant (p< 0.05) difference, AUC values and VIP score (>1) between sepsis patient non- survivor and sepsis patient survivor is presented in Table 1. A significantly higher concentration of tyrosine (Tyr), histidine (His), methionine (Met), betaine, creatine (Cr), phosphocreatine (PCr) and Choline (Cho) in the serum of non-survivor sepsis patients compared to survivor sepsis patients. Figure 2 shows the OPLS -DA score plot clearly discriminating non-survivor from survivor sepsis patients.Discussion
The present study revealed significantly higher concentration of aromatic amino acids like Tyr, His and other amino acid likes Met in serum sample of non-survivor sepsis patients compared to survivor patients. This may be due to mitochondrial dysfunction, altered tricarboxlylic acid or TCA cycle5, which results in dampened aerobic respiration as well abnormal energy supply. Severe disorders in energy supply should be an import factor inducing organ failure6. Furthermore, a significantly higher concentration of Cr and PCr in non-survivor patients was seen compared to survivor patients may be due to altered energy related metabolism6. Cho is a precursor of betaine, the increased concentration of both betaine and Cho in serum of non-survivor and survivors sepsis patients. Cho and betaine also have involvement in pro-inflammatory cytokines induce inflammation and amplify oxidative stress by stimulating the production of reactive oxygen and nitrogen species7. The univariate ROC curve analyses indicated that in serum, the metabolites such as PCr and Cr showed an AUC with high value (0.953 and 0.877, respectively). Those metabolites with VIP score (>1.0) were considered potential biomarker/s to discriminate between non-survivor sepsis patients and survivor at day 0. Figure 2 shows a PLS-DA classification score plot that depicts the differentiation of non-survivors and survivor sepsis patients in separate quadrant.Conclusion
The significant difference in metabolite concentration of amino acids, lipid and energy may be a used as a measure to discriminate between non-survivors and survivors sepsis patients at day 0. Our findings indicate that metabolite alterations are associated with progression of the disease.Acknowledgements
No acknowledgement found.References
- Singer M, Deutschman CS, Seymour CW et al. JAMA. 2016 ;23;315(8):801-10.
- Dellinger RP, Levy MM, Rhodes A et al. Crit Care Med. 2013;41(2):580-637.
- Fleischmann C, Scherag A, Adhikari NK et la. Am J Respir Crit Care Med. 2016;1;193(3):259-72.
- Vincent JL, Moreno R, Takala J et al. Intensive Care Med. 1996;22(7):707-10.
- Rodriguez MC, MacDonald JR, Mahoney DJ et al . Muscle Nerve. 2007;35(2):235–42.
- Liu Z, Triba MN, Amathieu R et al. Crit Care. 2019; 14;23(1):169.
- Veskovic M, Mladenovic D, Milenkovic M et al. Eur J Pharmacol. 2019; 5;848:39-48.
Figures
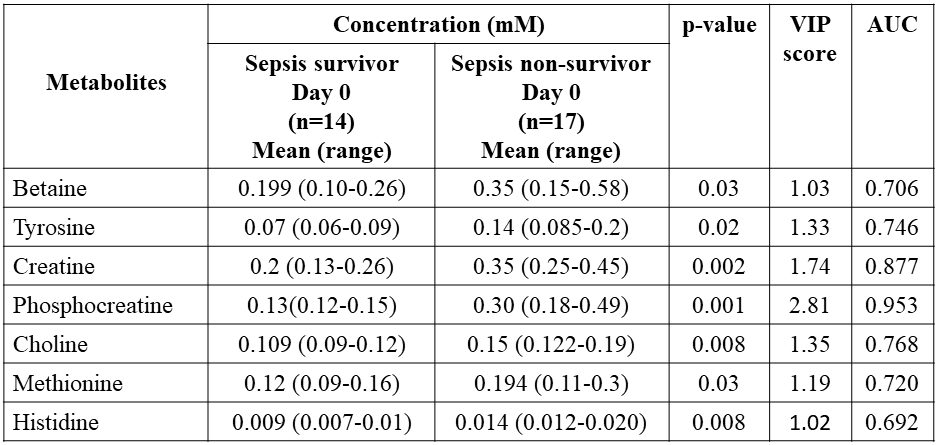
Concentration of metabolites (mM) in serum sample
of non-survivors and survivors sepsis patients at day 0. AUC values were obtained
from univariate ROC curve analyses and VIP scores.
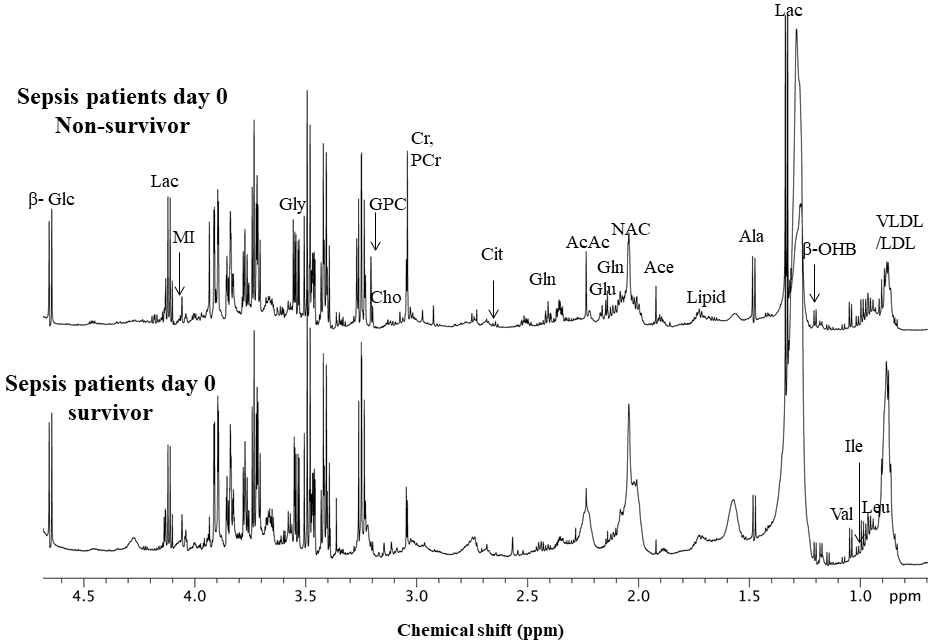
Representative one
dimensional (1D) aliphatic region of 1H NMR (700MHz) spectrum of
serum of (A) a non-survivor and (B) a survivor sepsis
patients
at day 0.
(A)
OPLS-DA score plot showing clear discrimination of non-survivor sepsis patients
from survivors patients. (B) Variable Importance in Projection (VIP) score plot
indicating most discriminating 15 metabolites in serum samples of sepsis
patients day 0, non-survivor and survivor.