2928
Respiratory-triggered quantitative MR spectroscopy of the human spinal cord at 7 T1Aix-Marseille Univ, CNRS, CRMBM, Marseille, France, 2APHM, Hôpital Universitaire Timone, CEMEREM, Marseille, France
Synopsis
1H MR spectroscopy (MRS) is of great interest to help characterizing human spinal cord pathologies. However, few studies have been reported so far because of challenging experimental difficulties caused by the small size of the structure, static and radiofrequency field heterogeneities, as well as physiological motion and especially breathing. In this work, we demonstrate the necessity of respiratory-gated acquisition to collect robust 1H MRS data from the cervical spinal cord at 7T. We also present dedicated post-processing and quantitative approaches for SC metabolic assessment.
Introduction
While most of the 1H MR spectroscopy (MRS) studies of the central nervous system have been conducted in the brain,1 1H MRS is of great interest in the study of several pathologies affecting the spinal cord2 (SC) including multiple sclerosis, amyotrophic lateral sclerosis, SC ischemia, SC tumors and SC injury. Few studies have been however reported so far in humans3-5 and rodents,6,7 mainly explained by the challenging experimental difficulties8 caused by the small size and curved shape of the SC, static and radiofrequency field heterogeneities, physiological motion such as cardiac beating, cerebrospinal fluid pulsation and breathing. In this work, in line with recent developments to strengthen 1H SC MRS feasibility,9,10 and benefiting from the improved SNR provided by ultra-high field system, we demonstrate the necessity of respiratory-gated acquisition and present original post-processing and quantitative approaches dedicated to robust 1H human cervical SC MRS at 7T.Methods
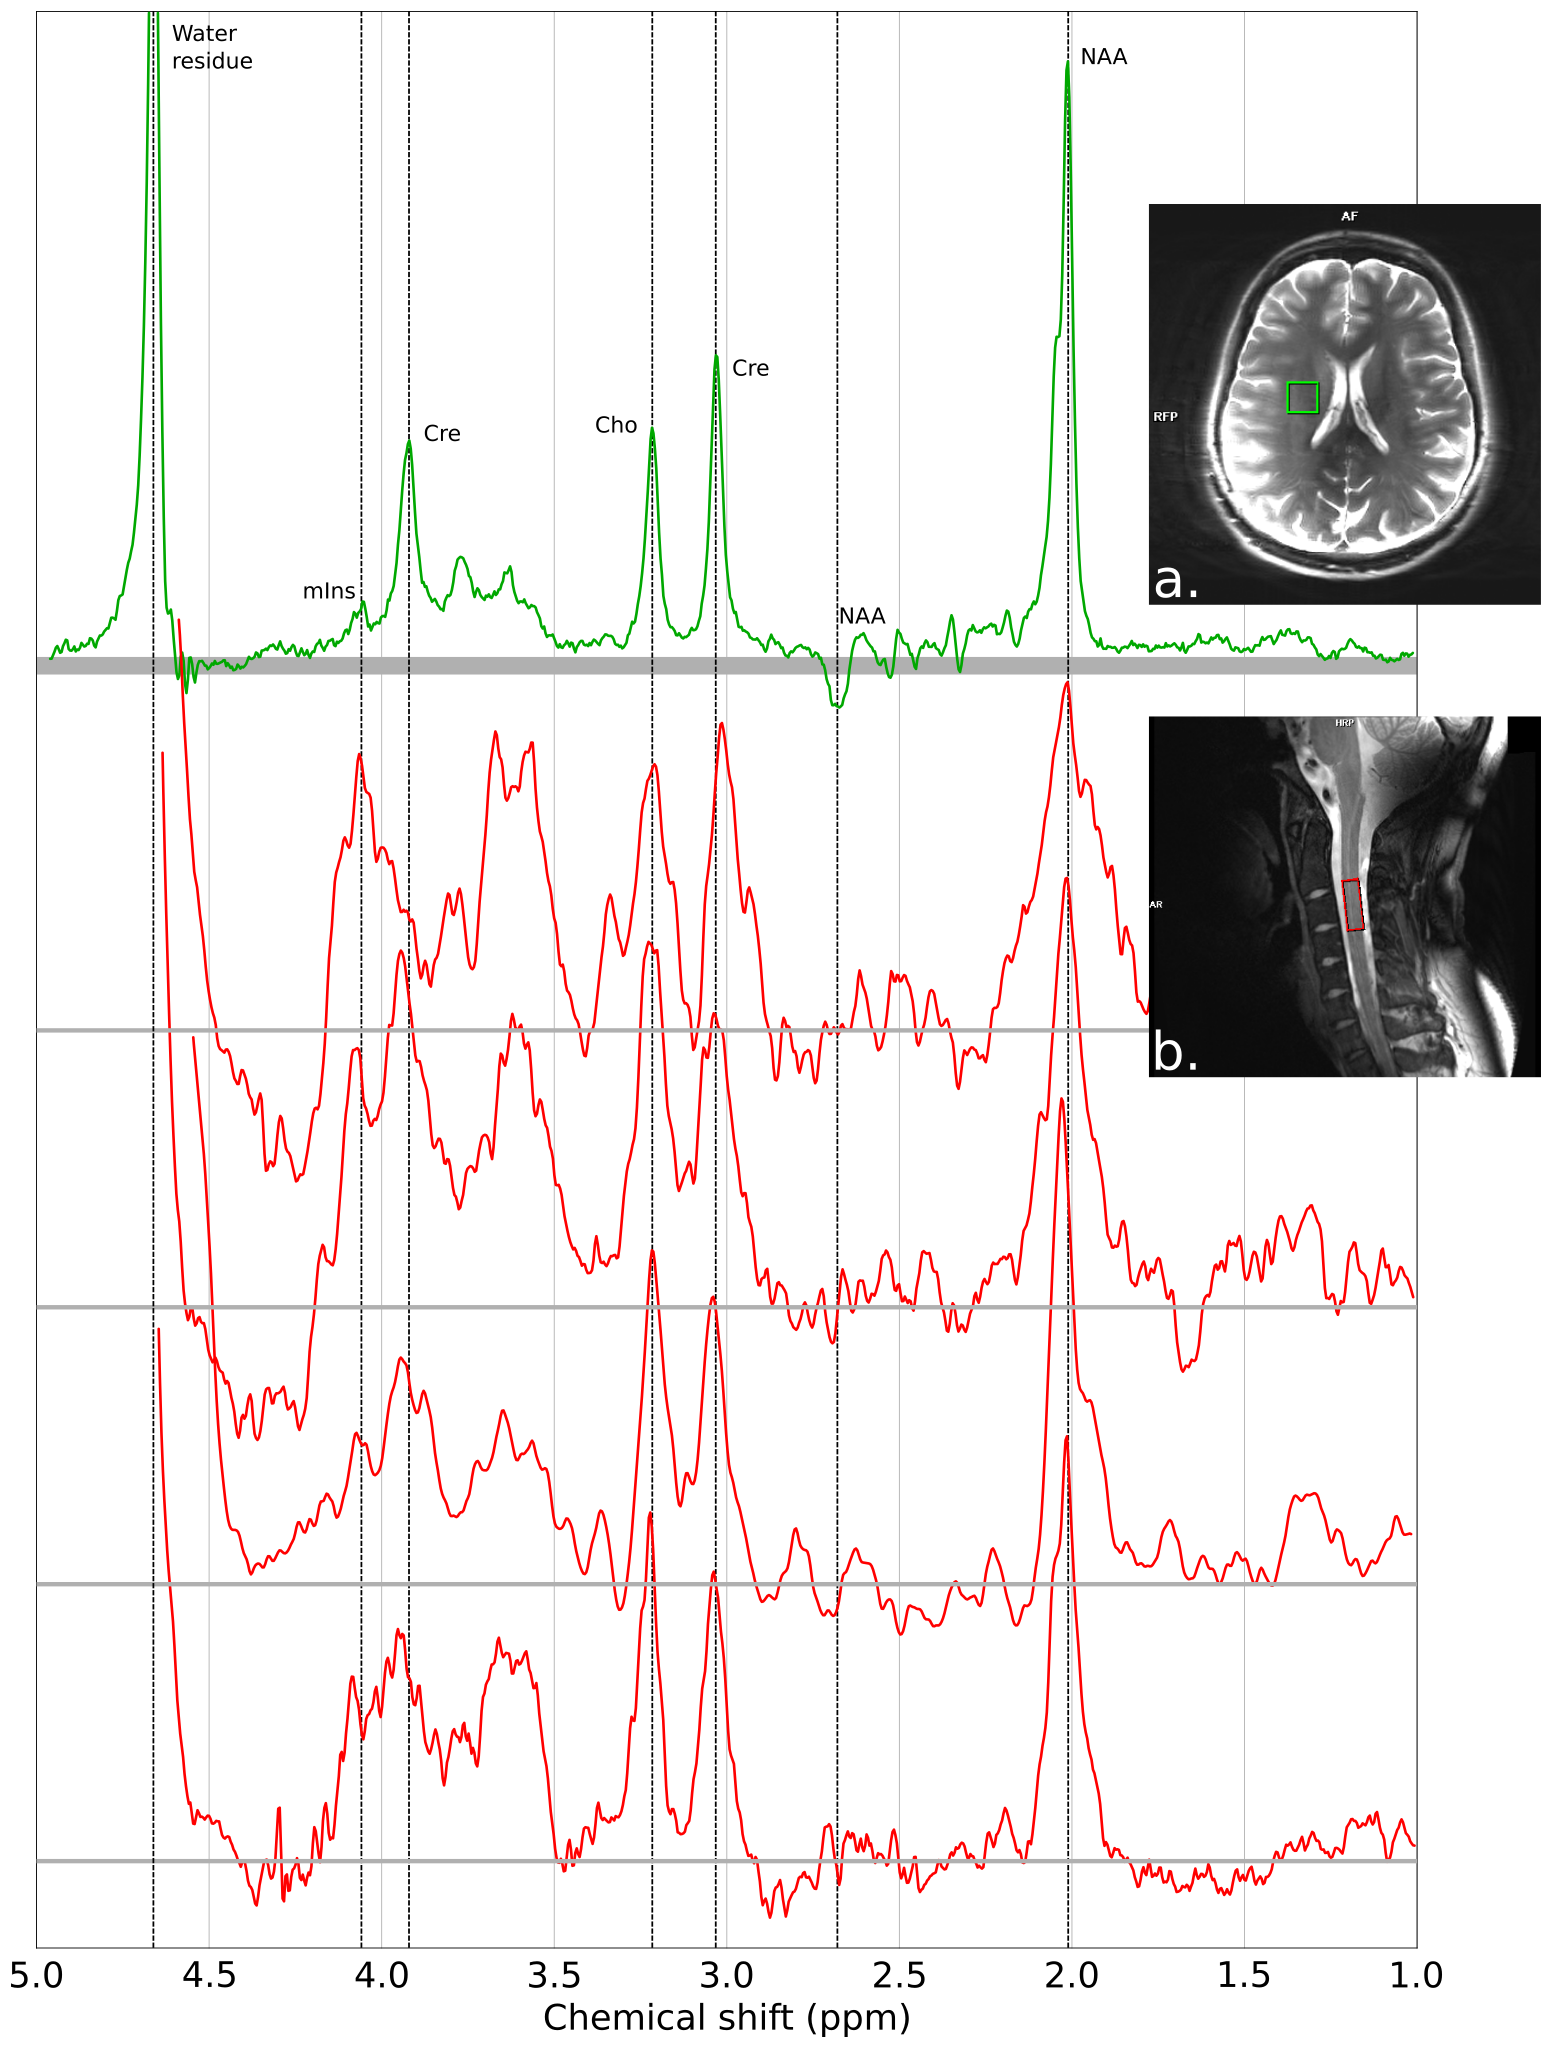
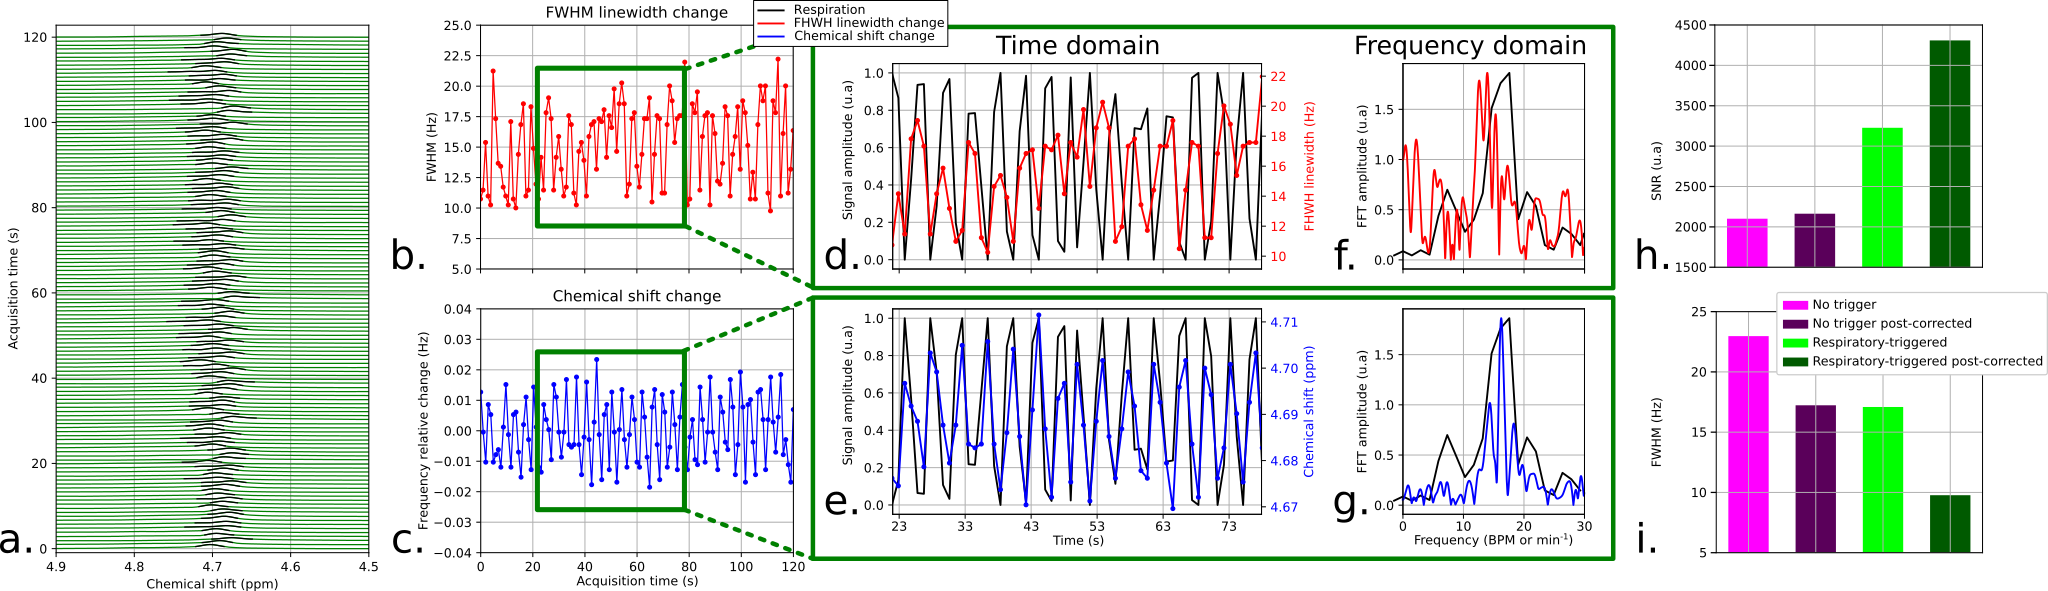
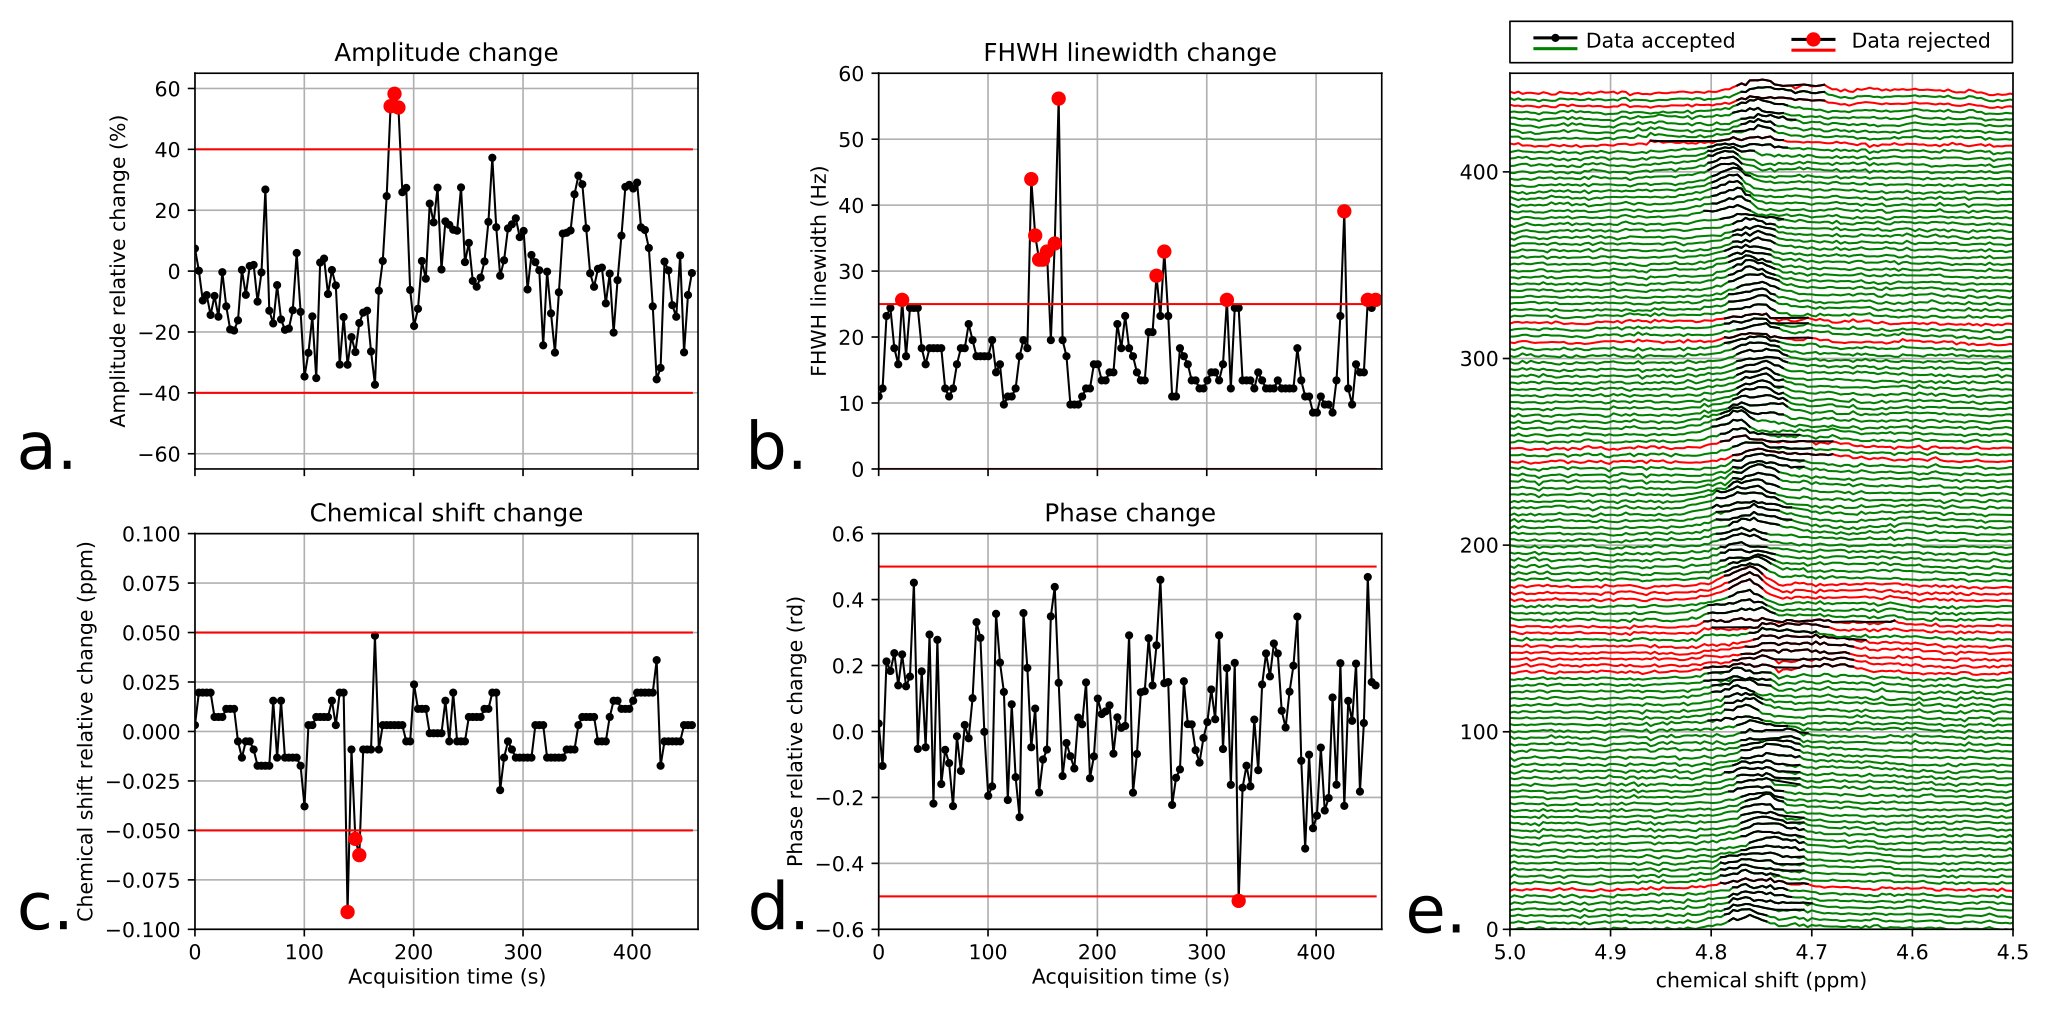
MRS acquisitions. Experiments were performed on a 7T system (MAGNETOM, Siemens Healthcare, Erlangen, Germany) on 7 healthy subjects (3 males and 4 females, mean age 25.9±2.5 y) using a 8-channel RF transmit/receive neck coil array (Rapid Biomedical, Rimpar, Germany). Respiratory-triggered single-voxel MRS was performed using a semi-LASER (Semi-adiabatic localization by adiabatic selective refocusing) sequence.11 The RF pulse duration and adiabaticity parameters were previously optimized in vitro. The sequence therefore consisted of a 2-ms excitation pulse followed by two pairs of 9-ms adiabatic full passage pulses (R=20-30) resulting in a TE of ca. 40ms. 128 averages were collected from a 8x8x20mm3 voxel placed in the SC at a C3 vertebral level (Fig.1a) with a minimum TR of 3.5-4.5s; the effective TR was influenced by the respiratory cycle. Non-water-suppressed data was also acquired for later use during post-processing. B0 field homogenization was performed using a respiratory-gated FASTESTMAP sequence.12 Using the same VOI, additional acquisitions were performed to evaluate the influence of respiration using a non water-suppressed STEAM sequence with a TR of 900ms during 1-2min without any triggering (TE=3.5ms). The respiration signal was recorded using an elastic bellow belt.Data processing. The raw MRS data were post-processed using a home-made Python software. The signal processing included: channel-by-channel signal 0th and 1st order phasing, Single Value Decomposition (SVD) channel recombination, average-by-average frequency realignment and apodization. Individual acquired MR spectra were analyzed by estimating the amplitude, linewidth, chemical shift and phase variations of the residual water peak. Based on thresholds specified by the user, individual MR acquisitions were discarded in order to improve final SNR and resolution (Fig.3). In order to evaluate the effects of breathing on the acquired MRS data, the latter MR signal distortions and the respiration signal were compared in time- and frequency-domain (Fig.2a-g). Additionally, non-water-suppressed MR data w/o respiratory-triggering and w/o post-processing were compared in terms of SNR and resolution (Fig.2h-i).
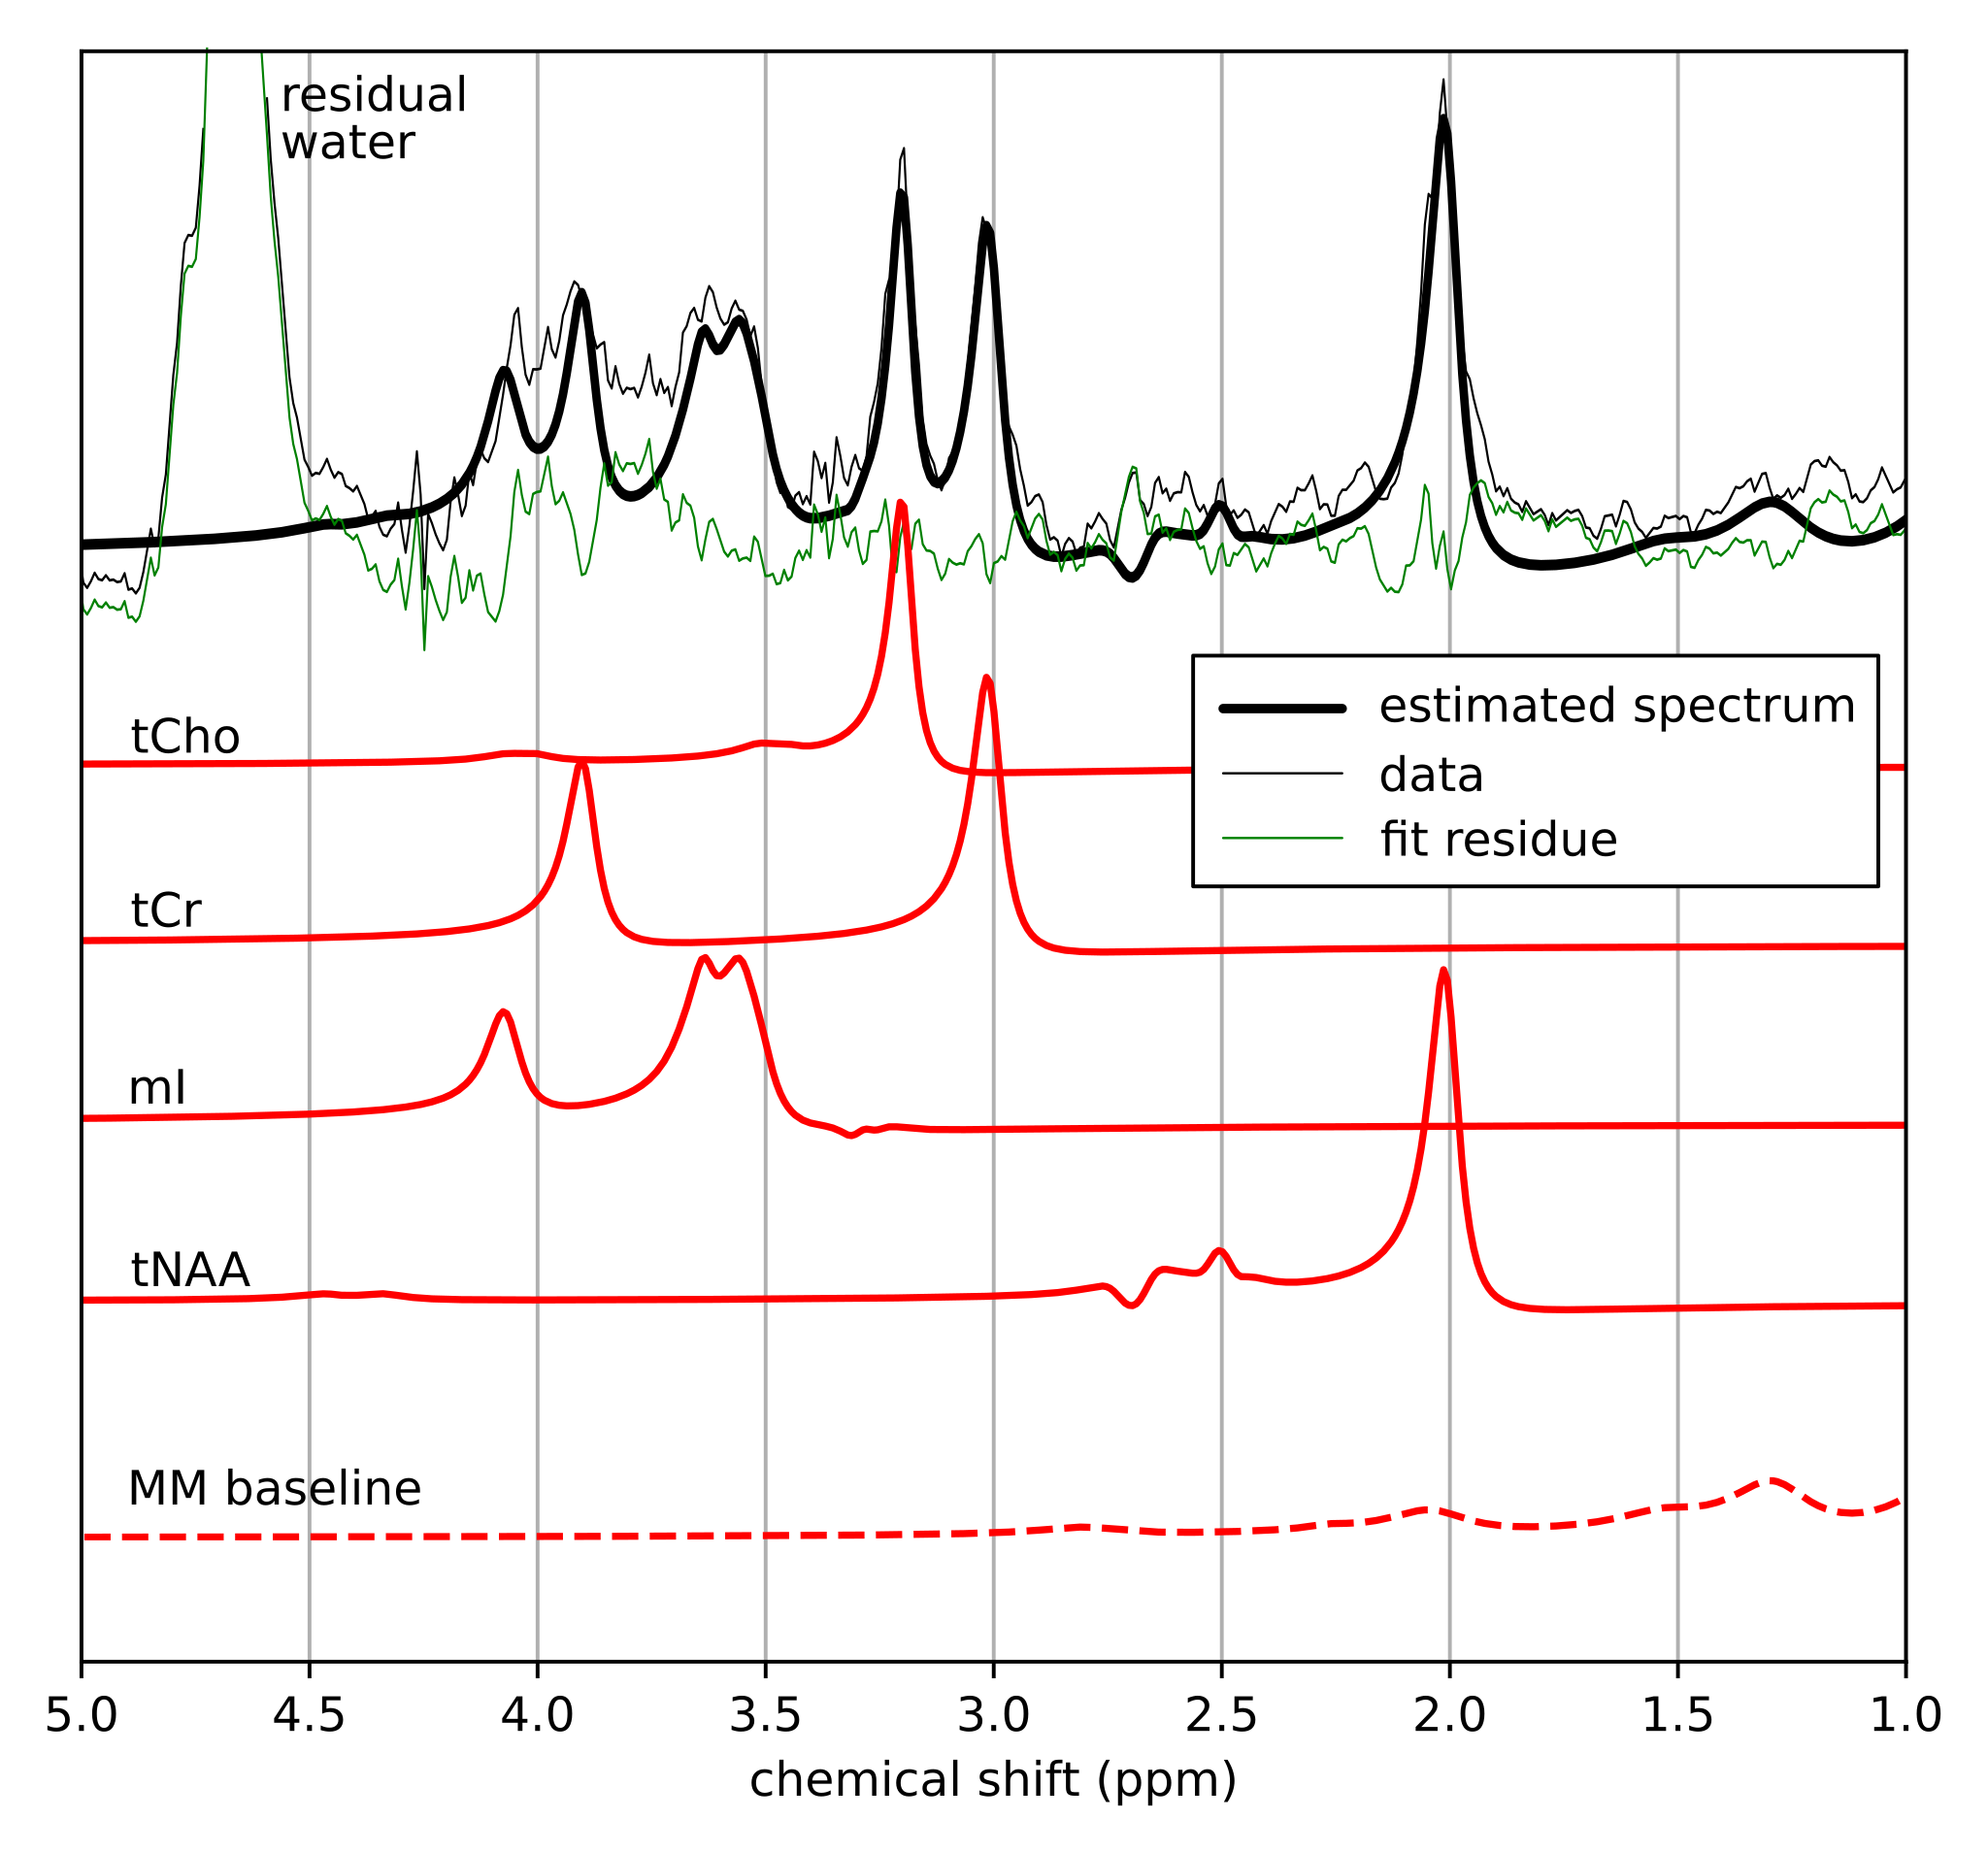
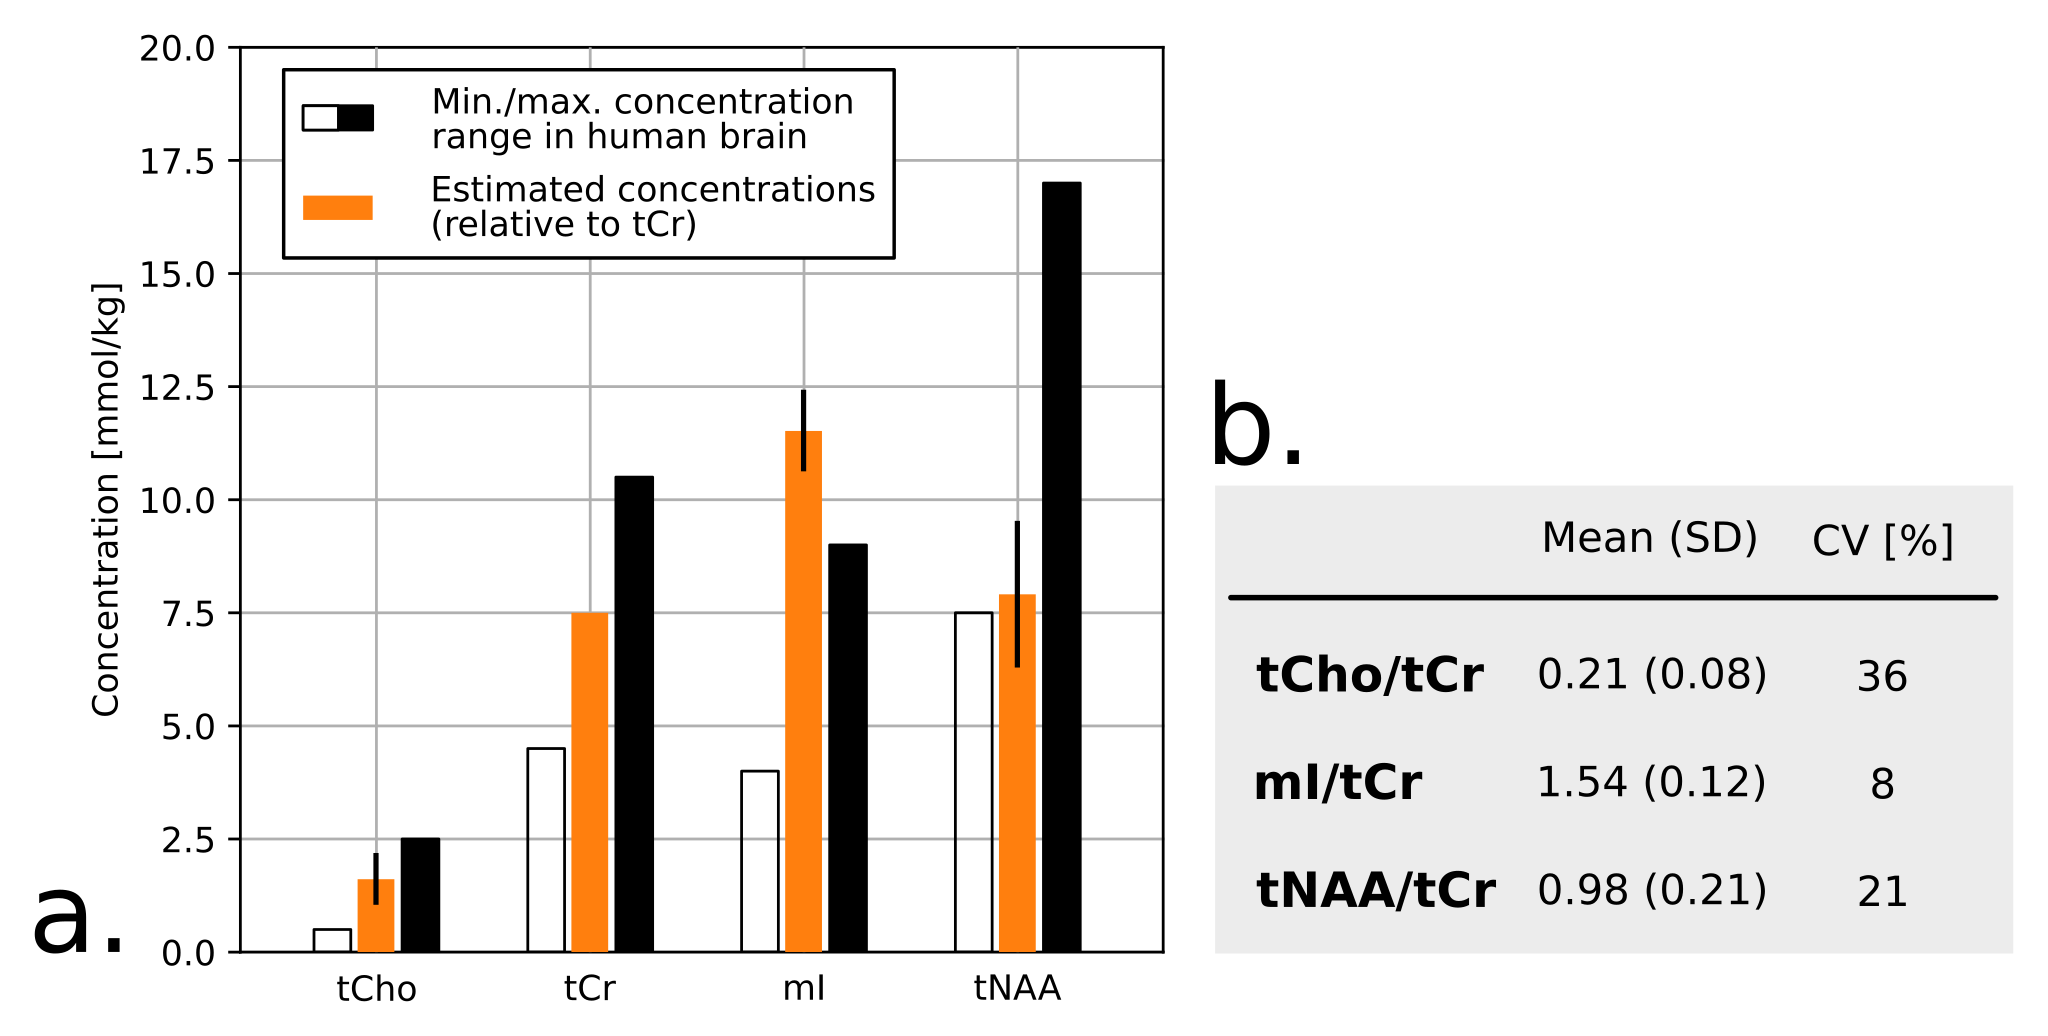
Data quantification. Processed MRS data were quantified using a home-made Python software based on a fitting algorithm originally developed for 2D MRS time-domain quantification13 and relying on the GAMMA simulation library.14 As a first quantification attempt, tCho, tCr, tNAA and mI were included in the basis set.1 To handle the macromolecular (MM) baseline, 9 gaussian components were incorporated to the model.15
Results
Fig.1 shows a set of 4 SC and 1 brain MR semi-LASER spectra acquired on different healthy volunteers. During non-triggered MRS acquisitions, the water resonance was impacted by linewidth and chemical shift changes (Fig.2b-c) and the recorded respiration signal showed a clear correlation in time-domain (Fig.2d-e) and frequency-domain (Fig.2f-g). Fig.2i-h illustrates the gain in SNR and spectral resolution (ca. 2-fold) when employing respiratory-gating in combination with our post-processing approach. Fig.3 shows an example of data post-processing based on individual spectra analysis and rejection; On average, this approach resulted in a SNR for the NAA singlet of 30.6±8.8 and a water peak linewidth of 12.0±2.8Hz. A representative respiratory-triggered MR spectrum and its fitting results are shown in Fig.4. Quantification results for n=5 subjects are displayed in Fig.5.Discussion
MRS of human SC remains challenging in a number of technical aspects.8 Recent reports have however shown great methodological improvements with for example the use of navigator for motion correction9 or non-water-suppressed MRS techniques to improve spectral quality.16 In line with those works, we demonstrate here the substantial effects of breathing on acquired SC MRS data at 7T and propose an approach to compensate them. Respiration-induced susceptibility effects can cause resonance amplitude, phase and more importantly substantial linewidth and chemical shift oscillations resulting in low SNR and resolution. We show that respiratory-triggering in combination with a dedicated data post-processing approach can improve the quality of MRS data acquired at high cervical levels (Fig.2,3). Using a home-made quantification algorithm, we were able to extract tCho, tCr and tNAA concentrations in agreement with previous reports (Fig.4,5). However, the limited number of quantified metabolites and the strong variability (>20%) reveals that further work is needed concerning the acquisition (shorter TE) and the absolute quantification (reproducibility, estimation error, MM modelization). 1H MRS is of great interest for better understanding and diagnosis of SC pathologies such as multiple sclerosis: we are aiming for a clinical application in the near future.Acknowledgements
The MRS package was developed by Gülin Öz and Dinesh Deelchand (semi-LASER sequence) and provided by the University of Minnesota under a C2P agreement. This work was performed on the platform 7T-AMI, a French “Investissements d’Avenir” programme” (grant ANR-11-EQPX-0001). The project leading to this publication has received funding from Excellence Initiative of Aix-Marseille University - A*MIDEX, a French “Investissements d’Avenir” programme”. This work was performed by a laboratory member of France Life Imaging network (grant ANR-11-INBS-0006). The authors would like to thank Thomas Troalen for MR sequence support (Siemens Healthcare) and Véronique Gimenez, Claire Costes and Lauriane Pini for study logistics.References
1. de Graaf RA. In Vivo NMR Spectroscopy: Principles and Techniques Wiley-Interscience; 2007. 592 p.
2. Wyss PO, Hock A, Kollias S. The Application of Human Spinal Cord Magnetic Resonance Spectroscopy to Clinical Studies: A Review. Seminars in ultrasound, CT, and MR 2017;38:153-162 doi: 10.1053/j.sult.2016.07.005 SMASH.
3. Hock A, Henning A, Boesiger P et al. (1)H-MR spectroscopy in the human spinal cord. AJNR. American journal of neuroradiology 2013;34:1682-1689 doi: 10.3174/ajnr.A3342 SMASH.
4. Stroman PW, Wheeler-Kingshott C, Bacon M et al. The current state-of-the-art of spinal cord imaging: methods. Neuroimage 2014;84:1070-1081 doi: 10.1016/j.neuroimage.2013.04.124 SMASH.
5. Wyss PO, Huber E, Curt A et al. MR Spectroscopy of the Cervical Spinal Cord in Chronic Spinal Cord Injury. Radiology 2019;291:131-138 doi: 10.1148/radiol.2018181037 SMASH.
6. Erschbamer M, Oberg J, Westman E et al. 1H-MRS in spinal cord injury: acute and chronic metabolite alterations in rat brain and lumbar spinal cord. The European journal of neuroscience 2011;33:678-688 doi: 10.1111/j.1460-9568.2010.07562.x SMASH.
7. Tachrount M, Duhamel G, Laurin J et al. In vivo short TE localized 1H MR spectroscopy of mouse cervical spinal cord at very high magnetic field (11.75 T). Magnetic resonance in medicine 2013;69:1226-1232 doi: 10.1002/mrm.24360 SMASH.
8. Lin AP. Overcoming Technical Challenges of MR Spectroscopy in Chronic Spinal Cord Injury. Radiology 2019;291:139-140 doi: 10.1148/radiol.2019190067 SMASH.
9. Hock A, Henning A. Motion correction and frequency stabilization for MRS of the human spinal cord. NMR Biomed. 2016;29:490-498 doi: 10.1002/nbm.3487 SMASH.
10. Henning A, Koning W, Fuchs A et al. (1) H MRS in the human spinal cord at 7 T using a dielectric waveguide transmitter, RF shimming and a high density receive array. NMR Biomed. 2016;29:1231-1239 doi: 10.1002/nbm.3541 SMASH.
11. Öz G, Tkáč I. Short-echo, single-shot, full-intensity proton magnetic resonance spectroscopy for neurochemical profiling at 4 T: validation in the cerebellum and brainstem. Magn. Reson. Med. 2011;65:901-910 doi: 10.1002/mrm.22708 SMASH.
12. Gruetter R, Tkáč I. Field mapping without reference scan using asymmetric echo-planar techniques. Magn. Reson. Med. 2000;43:319-323 doi: .
13. Roussel T, Cavassila S, Ratiney H. Sampling strategy effects on in vivo 2D J-Resolved spectroscopy quantification. ISMRM-ESMRMB Joint Annual Meeting, Stockholm, Sweden 2010.
14. Smith SA, Levante TO, Meier BH et al. Computer simulations in magnetic resonance An object-oriented programming approach. Journal of Magnetic Resonance, Series A 1994;106:75-105 doi: 10.1006/jmra.1994.1008 SMASH.
15. Seeger U, Klose U, Mader I et al. Parameterized evaluation of macromolecules and lipids in proton MR spectroscopy of brain diseases. Magn. Reson. Med. 2003;49:19-28 doi: 10.1002/mrm.10332 SMASH.
16. Hock A, MacMillan EL, Fuchs A et al. Non-water-suppressed proton MR spectroscopy improves spectral quality in the human spinal cord. Magn. Reson. Med. 2013;69:1253-1260 doi: 10.1002/mrm.24387 SMASH.
Figures