2927
Neurometabolic Mapping of RRMS patients using multi-slice Spiral-MRSI and support vector machine techniques1School of Health Sciences, University of Newcastle, Newcastle, Australia, 2Hunter Medical Research Institute (HMRI), Newcastle, Australia, 3School of Medicine and Public Health, University of Newcastle, Newcastle, Australia, 4Department of Neurology, John Hunter Hospital, Newcastle, Australia, 5Faculty of Medicine, University of Queensland, Herston, Australia, 6Harvard Medical School, Massachusetts General Hospital, Boston, MA, United States
Synopsis
The study designed a novel neurometabolic mapping using multi-slice Spiral-MRSI with multi-voxel segmentation and support vector machine(SVM) techniques to demonstrate the true nature of NAWM and WML of RRMS patients, compared to HCs. 3D-Spiral-MRSI covering 75% of the brain on 16 RRMS and 9 HCs were used. Multi-slice-MRSI was processed using novel pipeline with 3-model SVM classifications. Neurometabolic mapping revealed that (NAA/tCr) in WM-lesions was significantly lower than NAWM-MS and HCs with HCs vs WML model achieving highest sensitivity and specificity. Multi-slice-spiral-MRSI may enhance diagnosis and clinical monitoring of RRMS patients, and is sensitive in diagnosing RRMS even in NAWM.
Background
Multiple sclerosis (MS) is an immune-mediated disorder where inflammatory cells attack the myelin which affects the brain and spinal cord.1,2Conventional MRI has been the main imaging tool for diagnosis and monitoring for MS. However, MRI features of MS are not specific to its pathology which contribute to the development of permanent disability. H-MRS3 and multi-voxel MRS imaging (MRSI)4 can differentiate between these pathological processes within MS lesions, and normal-appearing white matter (NAWM), which improves the specificity of the diagnosis and aids clinical management.5 Studies have used MRS to evaluate neurometabolic changes within NAWM in MS compared to healthy controls (HCs)6,7. The challenge for these methods were to perform metabolic mapping of the majority of the brain in multi-dimension with high spatial resolution, improved localization and short acquisition times, and to measure white matter lesion (WML) and NAWM in small multi-voxel slices in large volume of interest (VOI). We designed a novel post-processing analysis pipeline for multi-voxel segmentation of multi-slice MRSI and three binary support vector machine (SVM) classification that allowed individual voxel analysis to demonstrate the true nature of NAWM and WML of RRMS patients, compared to HCs. A multi-dimensional metabolic map was developed to distinguish tissue subtypes.Materials and Methods
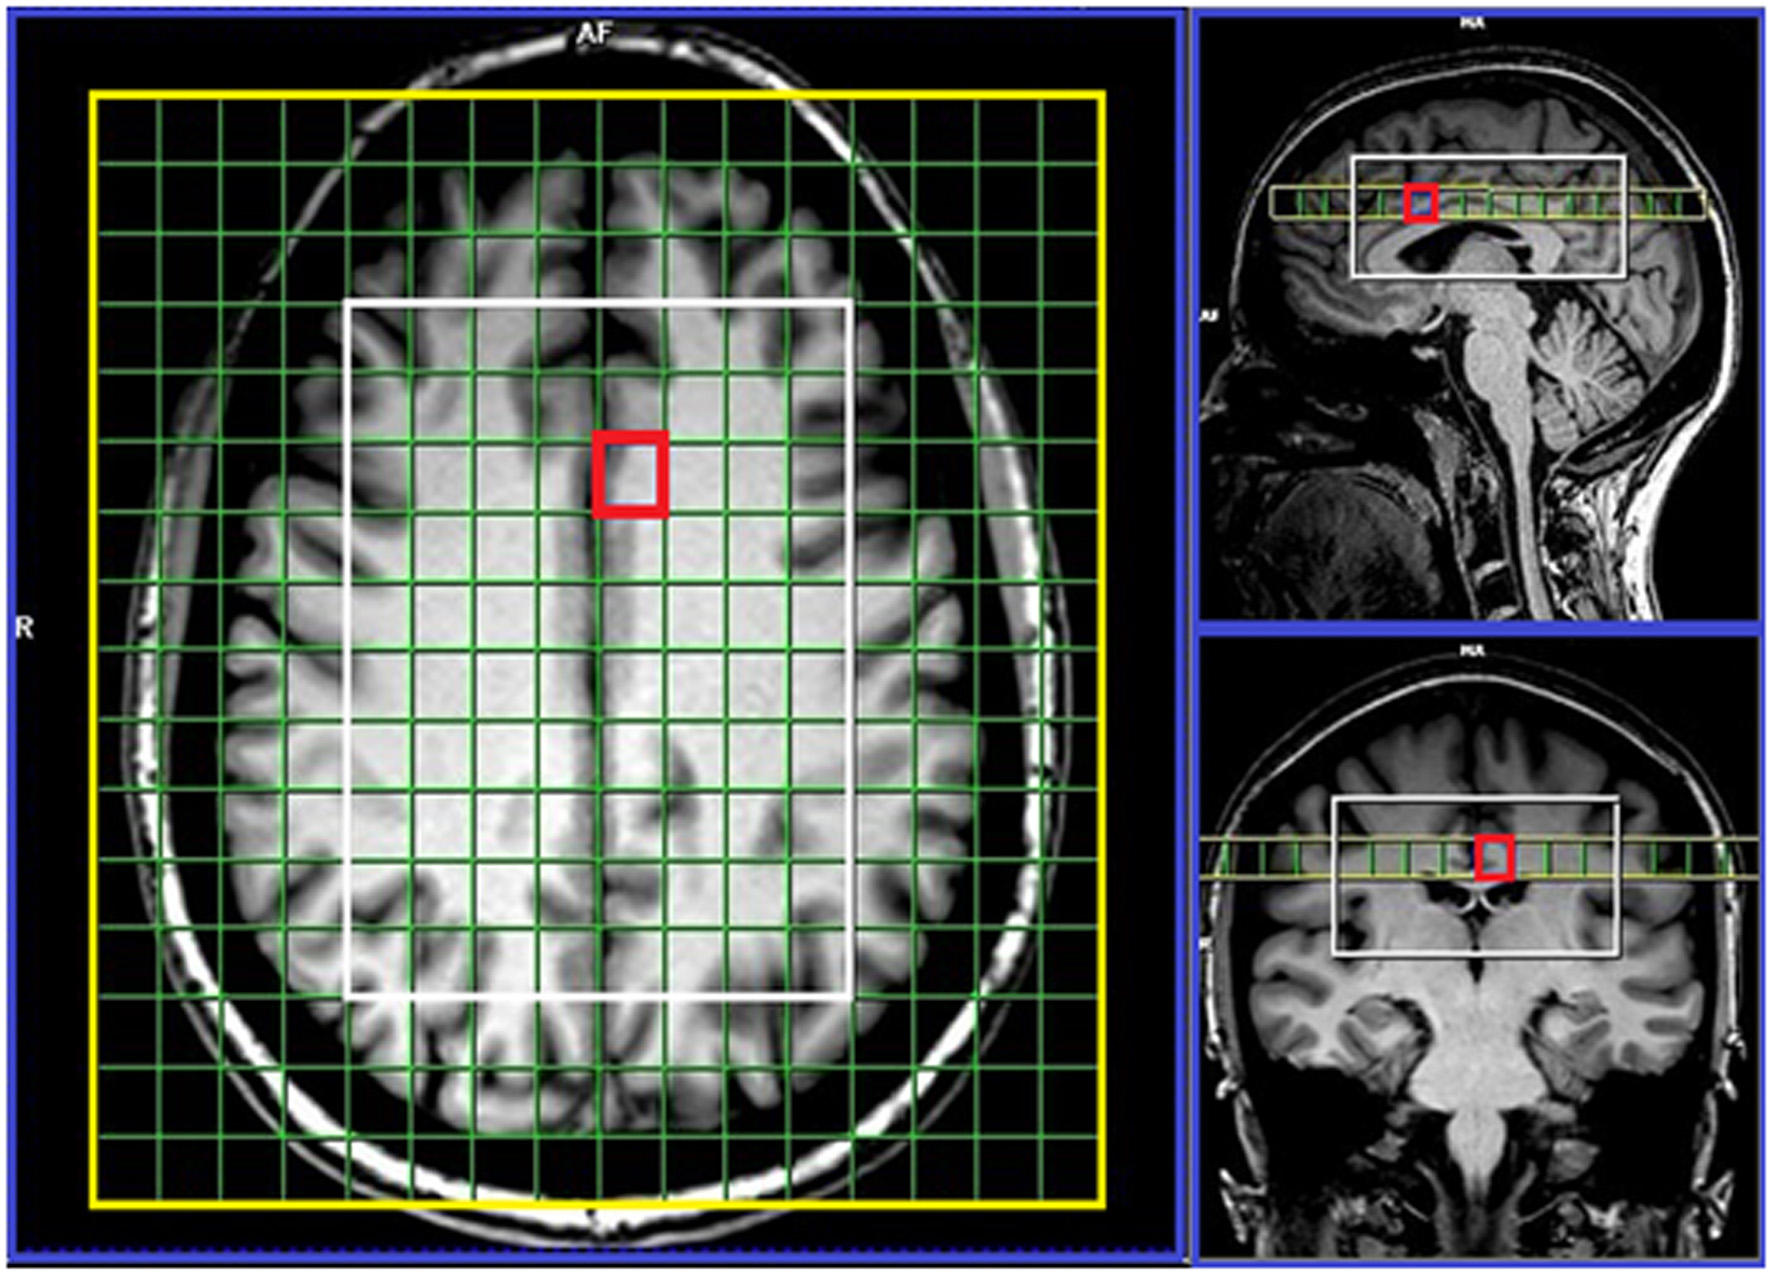
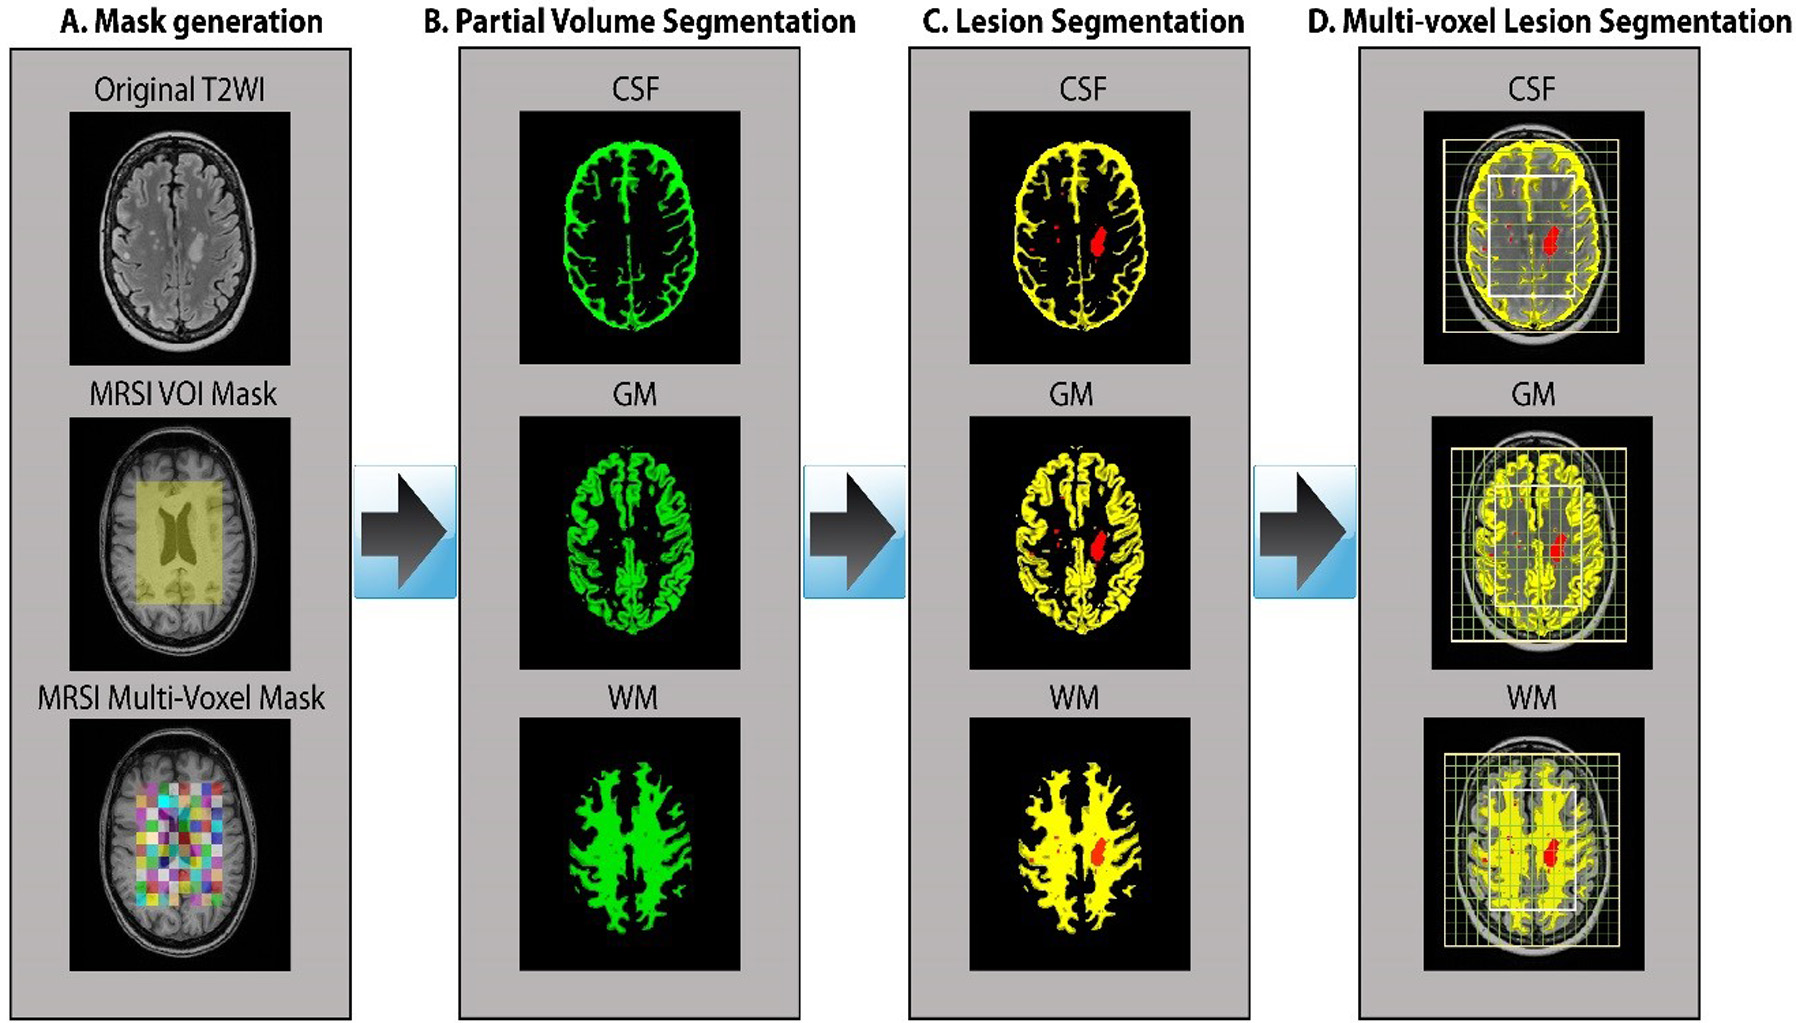
Sixteen MS patients aged 20 to 55yrs, diagnosed with RRMS according to the McDonald criteria were involved in this study with nine age and sex-matched HCs to the RRMS cohort. All MRI/MRS were undertaken on a 3T Prisma MRI equipped with a 64 channel coil at HMRI, Australia. Isotropic 1mm3 T1-MPRAGE (TR/TE/TI=2000/3.5/1100ms, FOV:256x256mm) and 3D 1mm3 T2-FLAIR (TR/TE/TI=5000/386/1800ms, FOV:256x256mm) were acquired. 3D-MRSI was applied using spiral phase-encoded LASER sequence with adiabatic RF pulses (GOIA-W)[16,4]8. MRSI data were acquired with: TR/TE:2800/30ms, 6 averages, spiral phase encoding, isotropic voxel:1cm3, delta frequency:3.2ppm, VOI in (AP-RL-HF):10x8x4cm and acquisition time 13.38 minutes. 75% of the brain above corpus callosum was evaluated using 80 voxels (Figure 1). A novel post-processing pipeline was built for multi-voxel segmentation for each voxel along four slices within VOI, using custom made matlab code and SPM12 into CSF, GM, WM and T2 lesion load (Figure 2). Lesions within the MRS voxel were segmented using the lesion growth algorithm.9 3D MRSI voxel was analysed using LCmodel with a basis set matching the magnetic field and pulse sequence parameters. Comparisons of mean neurometabolite/tCr between groups for each voxel were undertaken using independent and paired-samples T-tests, using SSPS. Three binary SVM classifications with a radial basis function (RBF) kernel (RBF SVM), HCs vs NAWM, NAWM vs WML and HCs vs WML were built using a leave-one-out cross-validation method. A receiver operating characteristic (ROC) curve was used to evaluate and compare the diagnostic performance of metabolites with a statistically significant difference between the two groups (p<0.05).Results
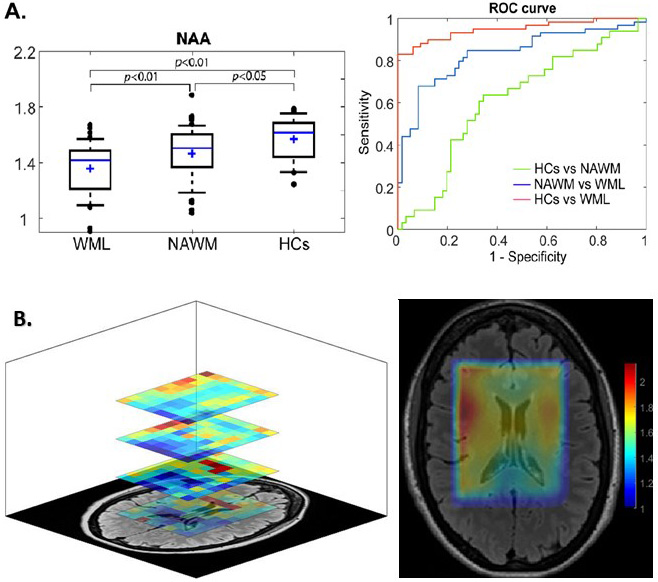
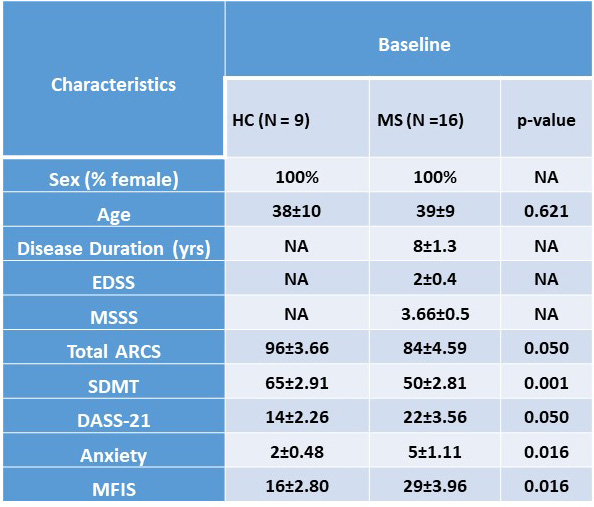
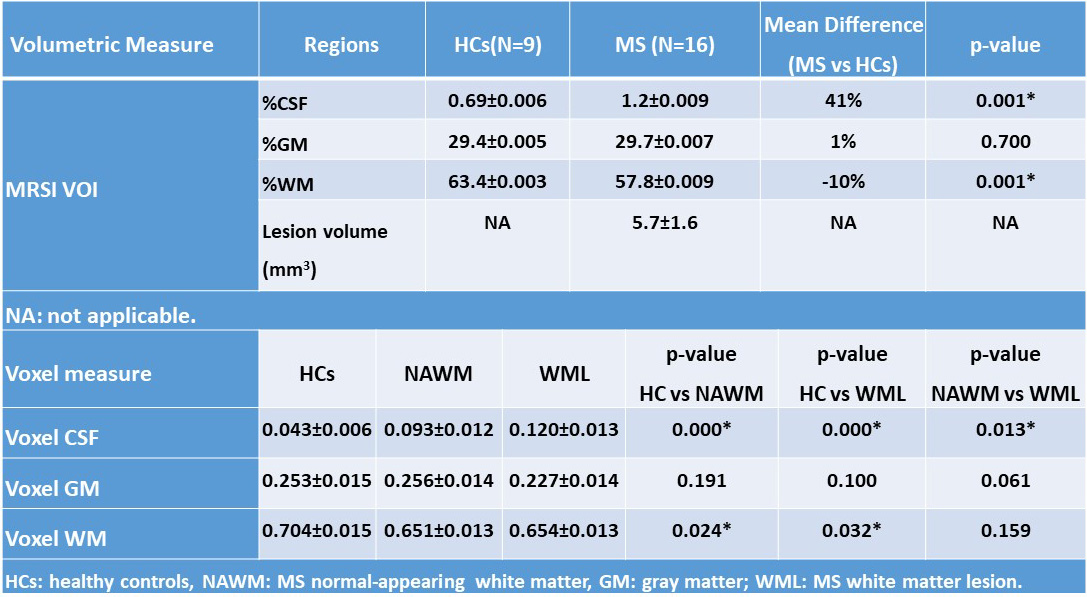
Demographic and clinical parameters of the cohorts are shown in Table 1. Spectroscopic data within the VOI of the four 10mm-slices revealed that N-acetylaspartate/tCr (NAA/tCr) in WML were significantly lower than NAWM-MS (-8%) and HCs (-15) within deep cortical white matter in both posterior parietal lobes (Figure 3A), while myo-inositol (m-Ins)/tCr in WML were significantly higher than NAWM-MS (12%) and HCs (10%). Mapping of NAA/tCr in single slice and multi-slices within 320 cm3 VOI overlayed with structural image is shown in Figure 3B. RBF SVM method for three different classification models showed the HCs vs WML model achieved highest area under the curve (AUC), accuracy, sensitivity and specificity (94%, 86%, 95%, and 70% respectively) compared to NAWM vs WML (84%, 76%, 73%, and 77% respectively) and HCs vs NAWM (63%, 62%, 79%, and 40% respectively) models, as summarized in Figure 3A. Tissue segmentation data within MRSI VOI for RRMS and HCs are summarised in Table 2A. MRSI voxels volume fractions within WML and NAWM voxels of RRMS patients compared to HCs is shown in Table 2B.Discussion
Our observation confirmed the importance of NAA and m-Ins as indicators of axonal loss and gliosis in NAWM and WML using a spiral MRSI at short TE 10. We found a significant reduction in NAA and an increase in m-Ins in WML11 in comparison to NAWM 12and HCs, within VOI. The RBF SVM model suggests that the highest predictive performance was found in the HCs vs WML model and reasonable performance to (NAWM vs WML) models .This performance corresponded to a significant decrease in NAA/tCr and increased m-Ins/tCr with higher percentage change between WML and HCs voxels within VOI13. Our novel analysis pipeline allowed individual small voxel analysis which demonstrated the true nature of NAWM and WML and distinguished tissue types.Conclusions
Spiral-MRSI can be used to assess neurometabolite changes at short TE and at 3T. MRSI may enhance the detection of NAWM and WML damages which plays a critical role in MS pathology, which were confirmed by voxel segmentation within a large VOI (320 cm3). SVM of MRSI data may be suited for clinical monitoring and progression of MS patients. Longitudinal studies are important to evaluate the effectiveness of Spiral-MRSI with progression of MS.14 The metabolic map can be used to evaluate different tissue subtypes to understand their changes over time.Acknowledgements
This research was supported by the Imaging Centre of the University of Newcastle and Hunter Medical Research Institute.References
1. Rovira A, Auger C, Alonso J. Magnetic resonance monitoring of lesion evolution in multiple sclerosis. Therapeutic advances in neurological disorders 2013;6(5):298-310.
2. Sajja BR, Wolinsky JS, Narayana PA. Proton magnetic resonance spectroscopy in multiple sclerosis. Neuroimaging clinics of North America 2009;19(1):45-58.
3. Obert D, Helms G, Sattler MB, et al. Brain Metabolite Changes in Patients with Relapsing-Remitting and Secondary Progressive Multiple Sclerosis: A Two-Year Follow-Up Study. PloS one 2016;11(9):e0162583.
4. Kapeller P, McLean MA, Griffin CM, et al. Preliminary evidence for neuronal damage in cortical grey matter and normal appearing white matter in short duration relapsing-remitting multiple sclerosis: a quantitative MR spectroscopic imaging study. Journal of neurology 2001;248(2):131-138.
5. De Stefano N, Bartolozzi ML, Guidi L, Stromillo ML, Federico A. Magnetic resonance spectroscopy as a measure of brain damage in multiple sclerosis. Journal of the neurological sciences 2005;233(1-2):203-208.
6. Brief EE, Vavasour IM, Laule C, Li DK, Mackay AL. Proton MRS of large multiple sclerosis lesions reveals subtle changes in metabolite T(1) and area. NMR in biomedicine 2010;23(9):1033-1037.
7. Tiberio M, Chard DT, Altmann DR, et al. Metabolite changes in early relapsing-remitting multiple sclerosis. A two year follow-up study. Journal of neurology 2006;253(2):224-230.
8. Andronesi OC, Gagoski BA, Sorensen AG. Neurologic 3D MR spectroscopic imaging with low-power adiabatic pulses and fast spiral acquisition. Radiology 2012;262(2):647-661.
9. Quadrelli S, Mountford C, Ramadan S. Hitchhiker's Guide to Voxel Segmentation for Partial Volume Correction of In Vivo Magnetic Resonance Spectroscopy. Magn Reson Insights 2016;9:1-8.
10. Rahimian N, Saligheh Rad H, Firouznia K, et al. Magnetic resonance spectroscopic findings of chronic lesions in two subtypes of multiple sclerosis: primary progressive versus relapsing remitting. Iranian journal of radiology : a quarterly journal published by the Iranian Radiological Society 2013;10(3):128-132.
11. Marshall I, Thrippleton MJ, Bastin ME, et al. Characterisation of tissue-type metabolic content in secondary progressive multiple sclerosis: a magnetic resonance spectroscopic imaging study. Journal of neurology 2018;265(8):1795-1802.
12. Aboul-Enein F, Krssak M, Hoftberger R, Prayer D, Kristoferitsch W. Reduced NAA-levels in the NAWM of patients with MS is a feature of progression. A study with quantitative magnetic resonance spectroscopy at 3 Tesla. PloS one 2010;5(7):e11625.
13. Donadieu M, Le Fur Y, Lecocq A, et al. Metabolic voxel-based analysis of the complete human brain using fast 3D-MRSI: Proof of concept in multiple sclerosis. Journal of magnetic resonance imaging : JMRI 2016;44(2):411-419.
14. Rovira À, Alonso J. 1H Magnetic Resonance Spectroscopy in Multiple Sclerosis and Related Disorders. Neuroimaging Clinics 2013;23(3):459-474.
Figures