2925
Ultrashort-TE Liver 1H MR Spectroscopy in Alcohol Use Disorder at 3 T1Department of Biomedical Engineering, Columbia University, New York City, NY, United States, 2Department of Psychiatry, Columbia University Irving Medical Center, New York City, NY, United States, 3New York State Psychiatric Institute, New York City, NY, United States, 4Department of Psychiatry, New York State Psychiatric Institute, New York City, NY, United States, 5Department of Radiology, Columbia University College of Physicians and Surgeons, New York City, NY, United States
Synopsis
Accurate detection of hepatocellular lipid content (HLC) in individuals with alcohol use disorder (AUD) is needed for early diagnosis of hepatic steatosis, a harbinger of serious liver diseases such as cirrhosis. Using a standard clinical 3T system and ultrashort-TE liver MRS, the proposed sequence employed asymmetric RF pulses with spoiler gradient cycling to achieve minimal TE of 5ms and minimal T2 errors for reliable signal quantification. No difference was found in HCL and choline levels between controls and AUD subjects. After a 3-week abstinence period, changes in hepatic fat and choline levels were observed in subjects with AUD.
Introduction
The development of alcoholic liver disease in patients with alcohol use disorder (AUD) begins with alcohol-induced fatty liver (AFL), a harbinger of more severe liver diseases such as steatohepatitis, fibrosis, and cirrhosis. Thus, early and accurate detection of the hepatocellular lipid content (HLC) is needed.Liver in vivo 1H-MR spectroscopy (MRS) is currently one of the most accurate and non-invasive methods used to diagnose hepatic steatosis (1,2). In addition to lipids, MRS can detect choline-containing compounds (CCC). Choline is a cell membrane component and is associated with increased cell turnover often related to malignancy. Accurate quantification of liver compounds critically relies on the sequence relative to the compounds’ T2 relaxation times and the echo time (TE) (3). The shorter TE, the less the dependence of signal amplitudes on T2 relaxation times thereby reducing the potential for inaccurate quantification. Although TE of 1ms was achieved with STEAM in rodent brain (4) and an ultrashort-TE STEAM was demonstrated previously in human liver at 7T (5), there is a lack of ultrashort-TE sequences for clinical scanners.
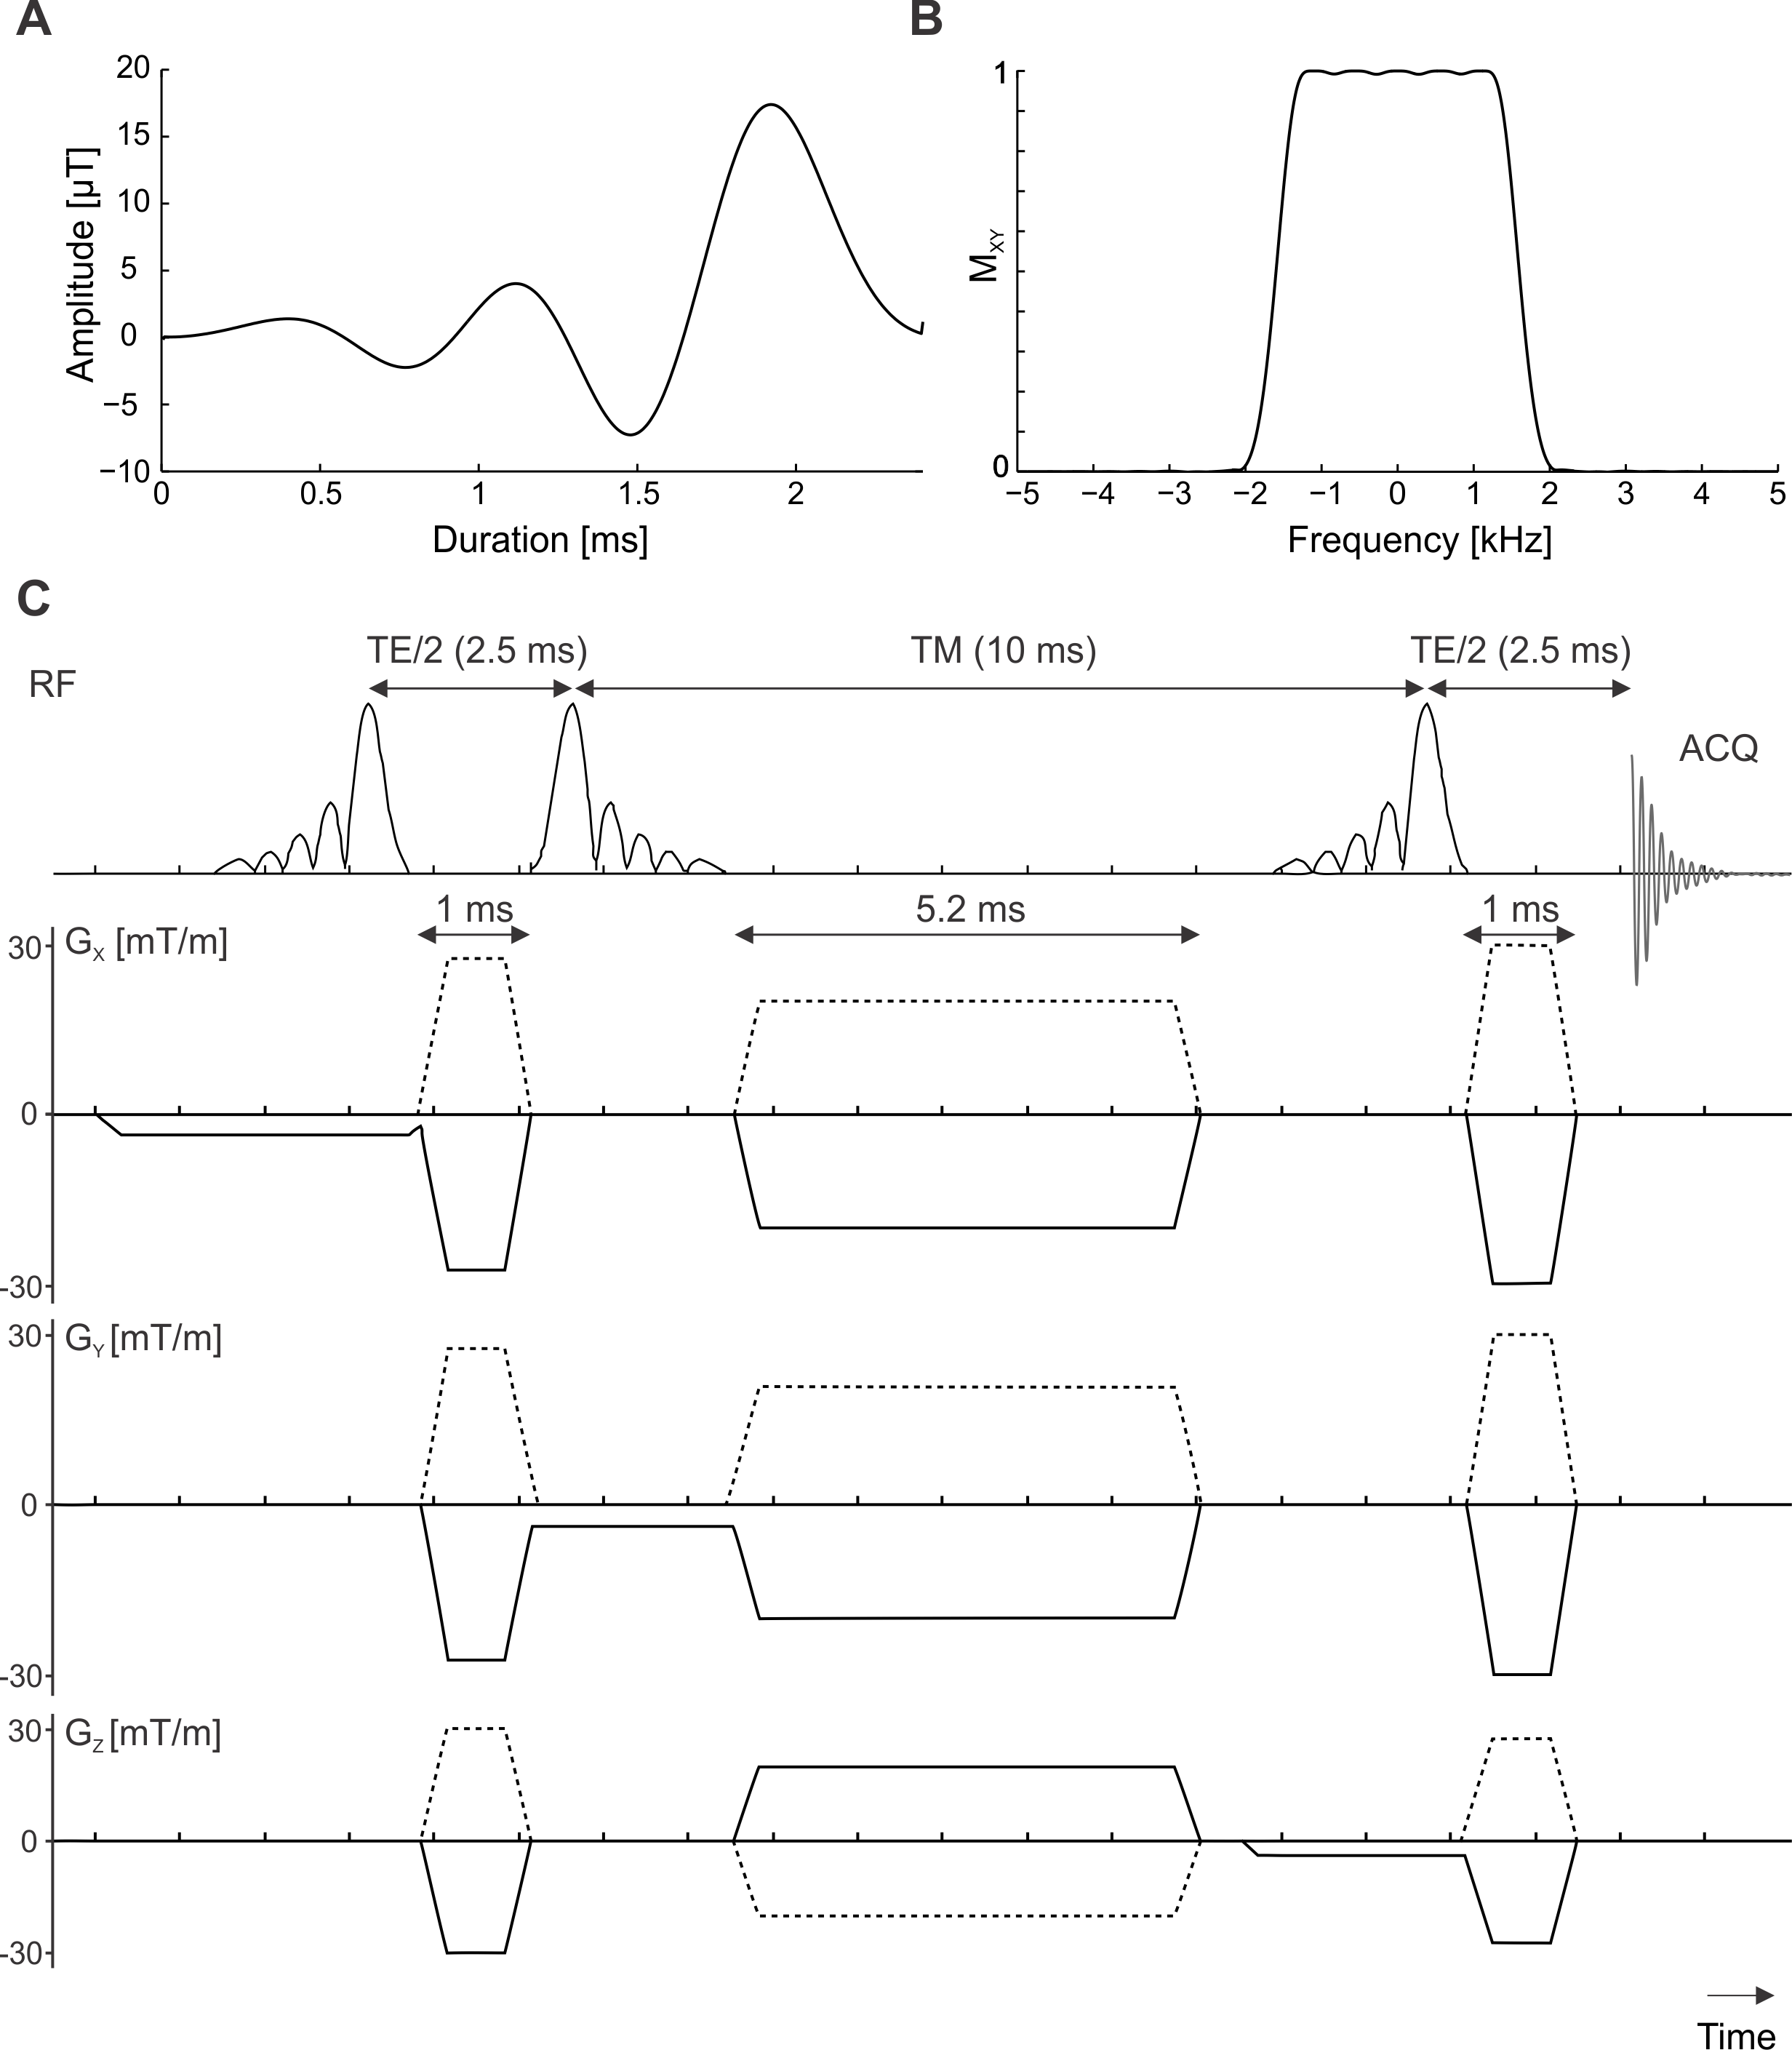
In this work, STEAM implementation employing asymmetric RF pulses, optimized spoiler gradient, and phase cycling for ultrashort-TE liver MRS at 3T is presented. The main aim was to obtain high-quality spectra of the human liver on a standard clinical 3T system with fast T2 relaxation assessment for the reliable quantification of HCL and CCC in subjects with AUD before and after an observed 3-week abstinence period. HCL and CCC levels were compared to healthy controls.
Methods
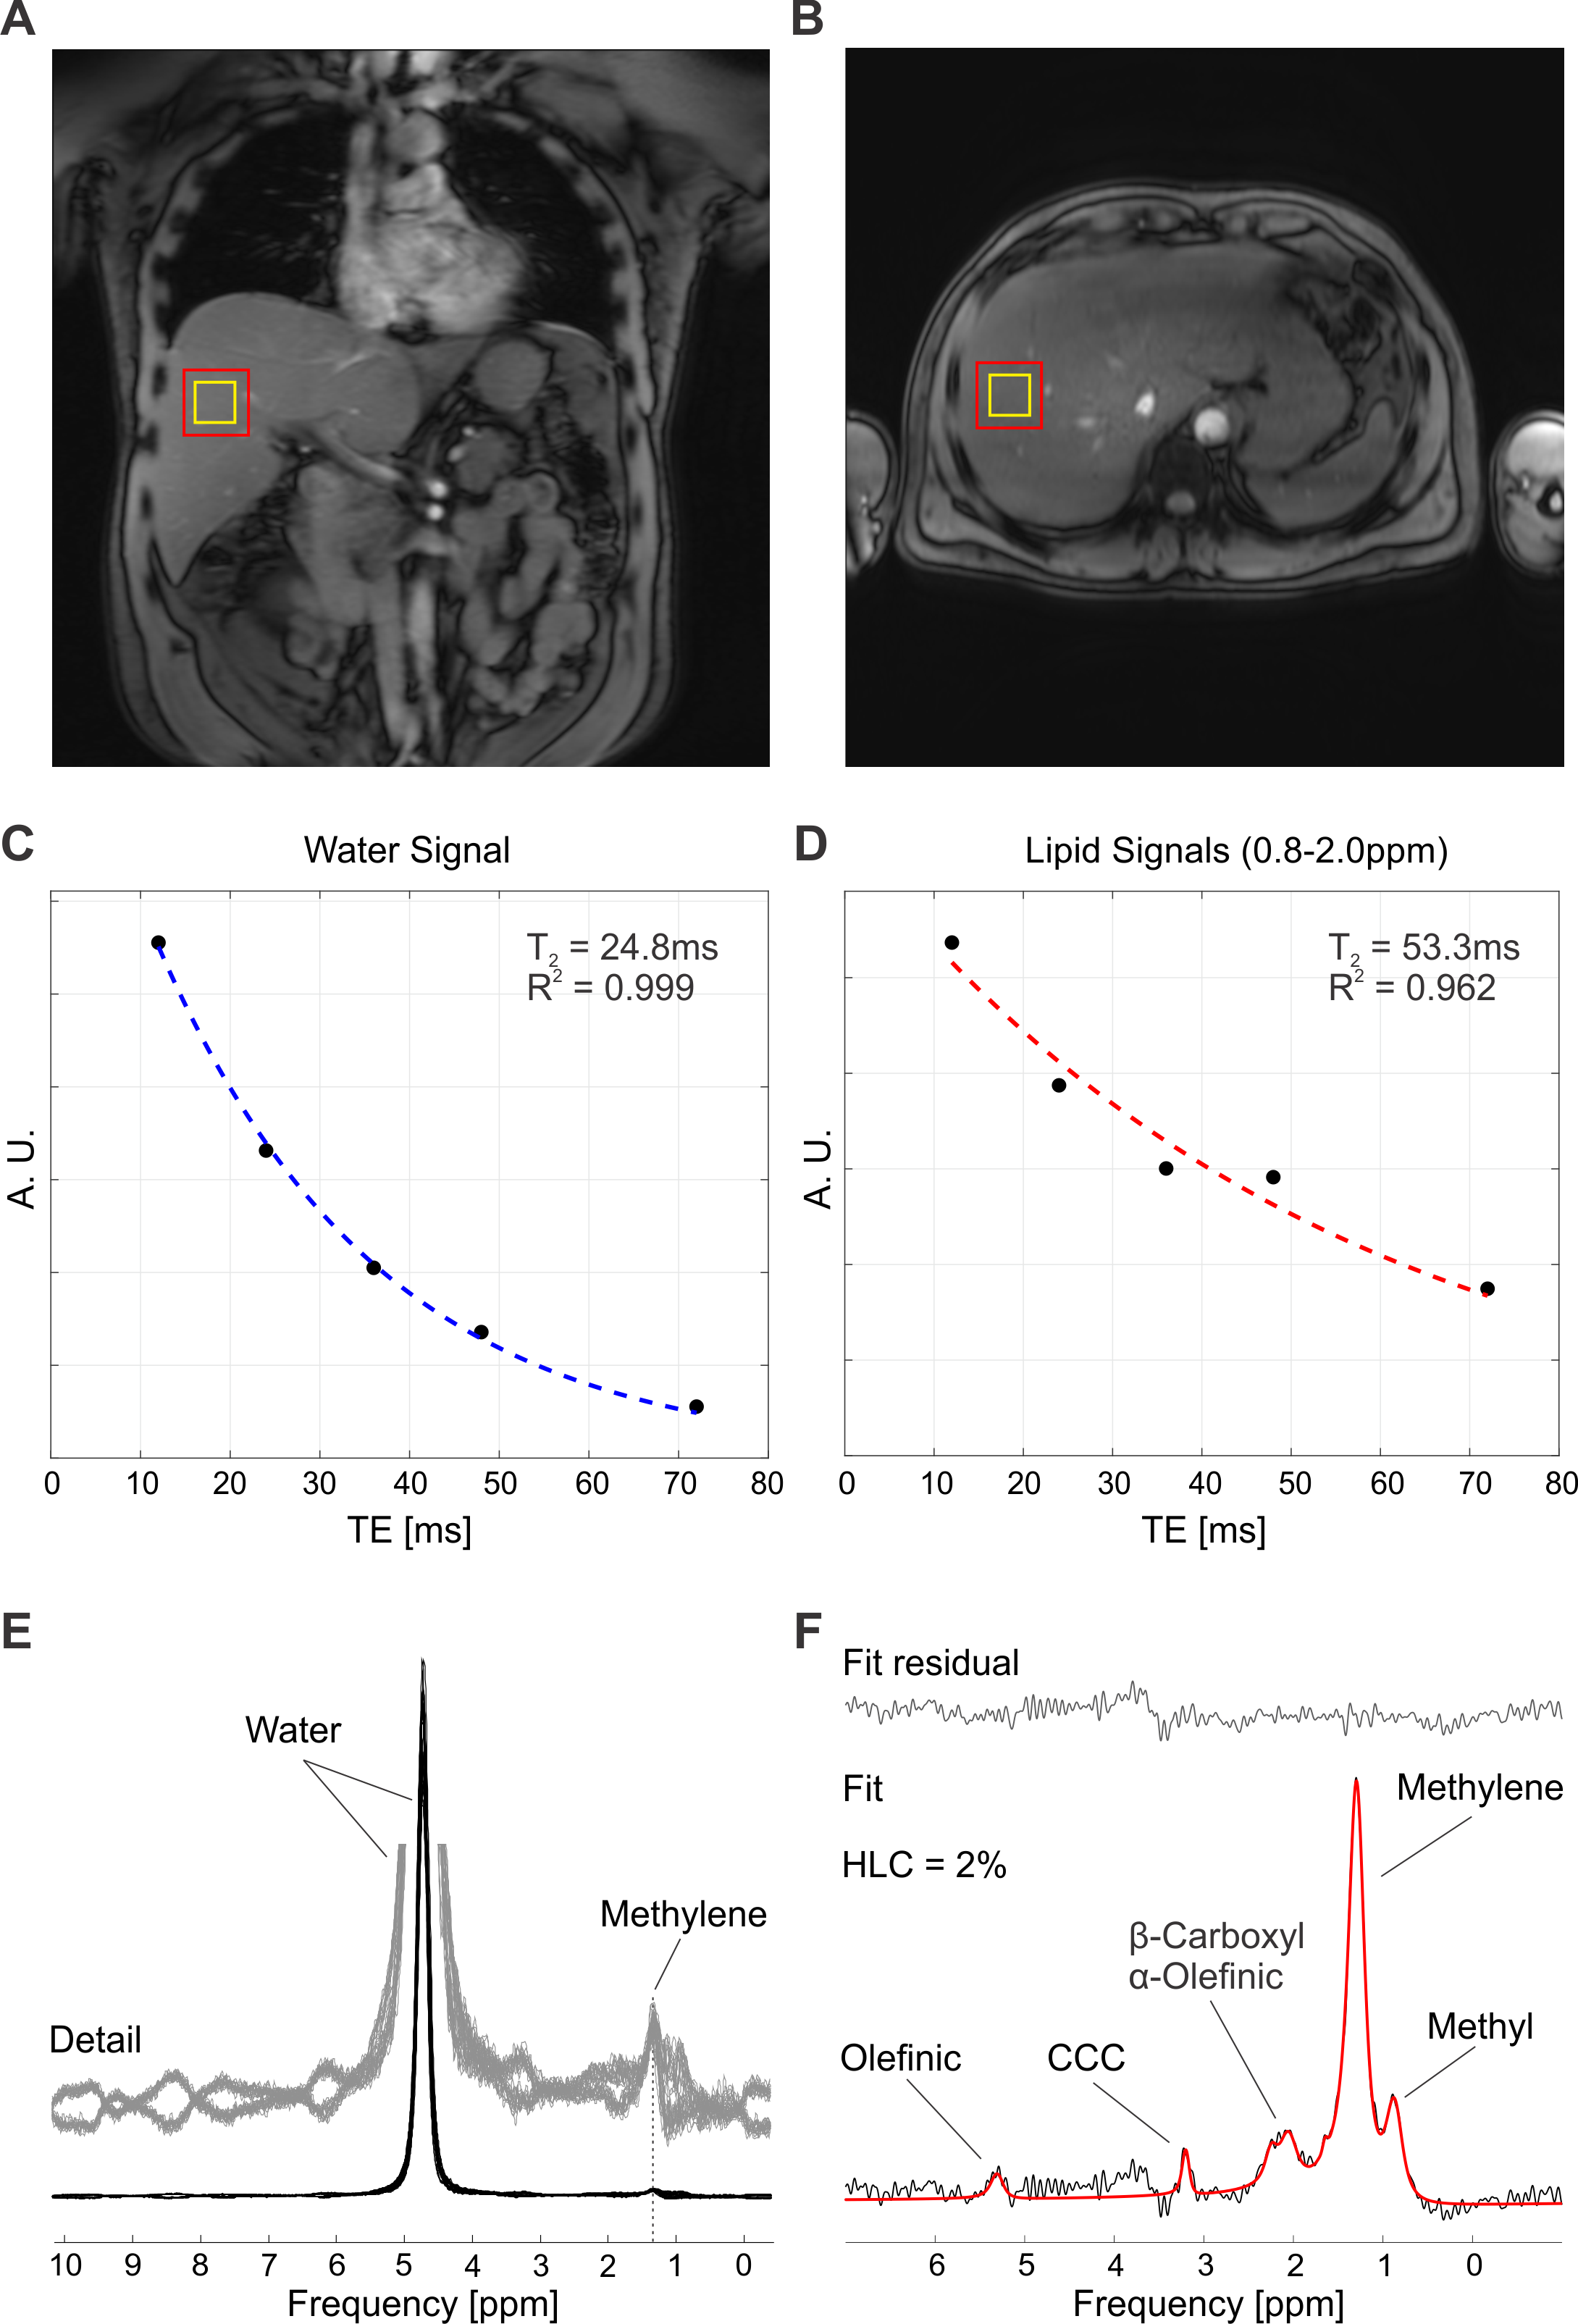
Five healthy controls (age: 31±2y, BMI: 23±2kg/m2, M/F=3/2) and five subjects with AUD (age: 40±7y, BMI: 28±3kg/m2, M/F=4/1) were measured on a MAGNETOM Prisma 3T MR system at Columbia University’s Zuckerman Institute with an 18-channel body array coil (Siemens, Erlangen, Germany). The AUD group was recruited from the Division on Substance Use Disorders at the New York State Psychiatric Institute and was high risk according to the Alcohol Use Disorders Identification Test (AUDIT). Subjects were measured in supine position and were fasting at least 4 hours prior to the scan. The AUD group was measured again after 3 weeks of abstinence.Liver MRS employed a single-voxel ultrashort-TE STEAM sequence in free breathing with TE=5ms, TM=10ms, TR=5s, VOI=8mL, transients=32, and spectral bandwidth=2000Hz. Minimum-phase Shinnar-Le Roux RF pulses (6) were used with a duration of 2.4ms and a bandwidth of 3300Hz. Phase cycling and spoiler gradient schemes were optimized with DOTCOPS (7). Fast T2 relaxation measurements were performed with a multi-TE scheme in breath hold with 5 TEs (7-72 ms), TR=3s and VOI=27mL (other parameters identical to the ultrashort-TE scan).
Data were processed in MATLAB (MathWorks, Natick, MA, USA). Water was removed using the fast Hankel–Lanczos singular value decomposition method (8). Basis functions were simulated in MARSS (9,10) and data were fitted with INSPECTOR (11,12). Water and lipids were corrected with measured T2 relaxation times and HCL in % was calculated as water/(water+lipids), where lipids refer to the sum of all lipid signals. The CCC were corrected with T2 values from literature (13) and calculated as water/(water+CCC). Data were compared with the Pearson correlation coefficient and Student’s t-test.
Results
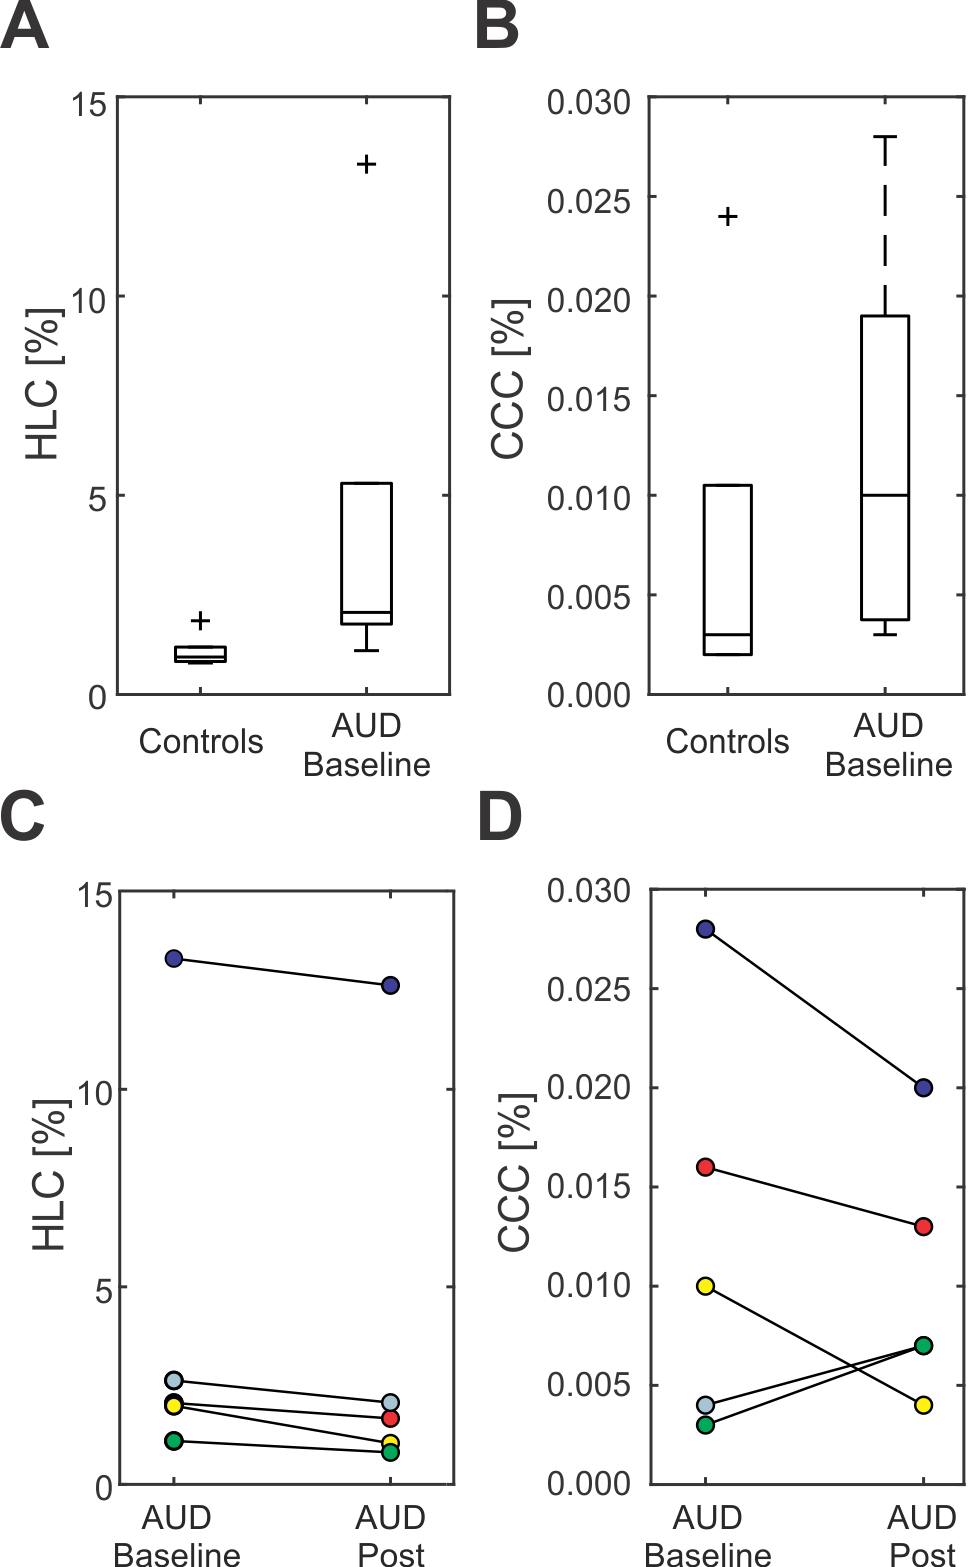
The amplitude profiles of the employed asymmetric RF pulse together with the scheme of the ultrashort-TE sequence are shown in Fig.1A,B and C. The prescribed VOIs were placed into right lobe of the liver avoiding veins and bile ducts (Fig.2A,B). Spoiler gradient cycling efficiently eliminated spurious signals from water, allowing for quantification of liver compounds (Fig.2E). A representative processed and fitted spectrum measured with TE of 5ms is shown in Fig.2F.No difference in mean T2 relaxation times between controls and the AUD group was found neither for water (21±4 ms vs 21±2 ms) nor for lipids (43±6 vs 45±8 ms). Although the mean value of HCL and CCC was increased in subjects with AUD (HCL: 1.1±0.4 vs 4.2±5.1%, CCC: 0.008±0.009 vs 0.012±0.010%)(Fig.3A,B), this difference was not found to be significant. HCL correlated with CCC in both groups (controls: r=0.98, subjects with AUD: r=0.87). HCL and CCC levels did not correlate with the AUDIT score. A decrease in HCL was observed in all subjects with AUD after the abstinence (3.6±5.0%) and lower mean value of CCC as well (0.010±0.006%)(Fig.3C,D).
Discussion
The presented novel STEAM sequence implementation achieved a minimal TE of 5ms on a standard clinical 3T system. This is the shortest TE used in liver MRS to date, thereby effectively minimizing the potential for T2-related quantification errors and precise monitoring of levels of liver compounds. Direct measurement of compound-specific lipid T2s in this study furthermore allowed explicit subject-specific T2 correction.HCL of the AUD group was unexpectedly low despite high risk and heavy drinking. Elevated CCC levels in subjects with AUD could reflect the detrimental metabolic processes related to long term exposure to alcohol.
Conclusion
This work presents a novel (5ms) ultrashort-TE single-voxel MRS implementation for measurement of fast-relaxing liver compounds on a standard clinical 3T system. Application of this sequence detected no differences in HCL and CCC levels between healthy controls and subjects with AUD, however, a decrease of HCL and CCC levels was observed after a 3-week abstinence period.Acknowledgements
This work was supported by NIDA grant T32- DA007294 (JMW) and a pilot award from the Christopher D. Smithers Foundation (JMW).References
1. Lee SS, Park SH. Radiologic evaluation of nonalcoholic fatty liver disease. World J. Gastroenterol. 2014;20:7392–402 doi: 10.3748/wjg.v20.i23.7392.
2. Georgoff P, Thomasson D, Louie A, et al. Hydrogen-1 MR Spectroscopy for Measurement and Diagnosis of Hepatic Steatosis. Am. J. Roentgenol. 2012;199:2–7 doi: 10.2214/AJR.11.7384.
3. Pineda N, Sharma P, Xu Q, Hu X, Vos M, Martin DR. Measurement of Hepatic Lipid: High-Speed T2-Corrected Multiecho Acquisition at 1 H MR Spectroscopy—A Rapid and Accurate Technique. Radiology 2009;252:568–576 doi: 10.1148/radiol.2523082084.
4. Tkác I, Starcuk Z, Choi IY, Gruetter R. In vivo 1H NMR spectroscopy of rat brain at 1 ms echo time. Magn. Reson. Med. 1999;41:649–56.
5. Gajdošík M, Chadzynski GL, Hangel G, et al. Ultrashort-TE stimulated echo acquisition mode (STEAM) improves the quantification of lipids and fatty acid chain unsaturation in the human liver at 7 T. NMR Biomed. 2015;28:1283–1293 doi: 10.1002/nbm.3382.
6. Pauly J, Le Roux P, Nishimura D, Macovski A. Parameter relations for the Shinnar-Le Roux selective excitation pulse design algorithm (NMR imaging). IEEE Trans. Med. Imaging 1991;10:53–65 doi: 10.1109/42.75611.
7. Landheer K, Juchem C. Simultaneous optimization of crusher and phase cycling schemes for magnetic resonance spectroscopy: an extension of dephasing optimization through coherence order pathway selection. Magn. Reson. Med. 2019;In press:mrm.27952 doi: 10.1002/mrm.27952.
8. de Beer R, van Ormondt D, Pijnappel WWF. Quantification of 1-D and 2-D magnetic resonance time domain signals. Pure Appl. Chem. 1992;64:815–823 doi: 10.1351/pac199264060815.
9. Landheer K, Swanberg KM, Juchem C. Magnetic resonance Spectrum simulator (MARSS), a novel software package for fast and computationally efficient basis set simulation. NMR Biomed. 2019:1–13 doi: 10.1002/nbm.4129.
10. Landheer K, Juchem C. Magnetic Resonance Spectrum Simulator - MARSS. innovation.columbia.edu/technologies/cu19215_MARSS.
11. Prinsen H, de Graaf RA, Mason GF, Pelletier D, Juchem C. Reproducibility measurement of glutathione, GABA, and glutamate: Towards in vivo neurochemical profiling of multiple sclerosis with MR spectroscopy at 7T. J. Magn. Reson. Imaging 2017;45:187–198 doi: 10.1002/jmri.25356.
12. Juchem C. INSPECTOR: Magnetic resonance spectroscopy software for optimized data extraction. innovation.columbia.edu/technologies/cu17130_inspector.
13. Ouwerkerk R, Pettigrew RI, Gharib AM. Liver metabolite concentrations measured with 1H MR spectroscopy. Radiology 2012;265:565–75 doi: 10.1148/radiol.12112344.
Figures