2922
Effect of age on in vivo GABA and glutathione levels in a pediatric sample1Russell H. Morgan Department of Radiology and Radiological Science, The Johns Hopkins University School of Medicine, Baltimore, MD, United States, 2Department of Psychiatry and Behavioral Sciences, The Johns Hopkins University School of Medicine, Baltimore, MD, United States
Synopsis
GABA is the primary inhibitory neurotransmitter in the human brain and is implicated in several neuropathologies. Glutathione is a major antioxidant in the brain and is considered a marker of oxidative stress. Several studies have reported age-related declines in GABA levels in adulthood, but the aging dynamics of both GABA and glutathione have not been well explored in childhood. We demonstrate increases in GABA and no differences in glutathione with age in a healthy pediatric sample (5.7-13.9 years). This study provides insight into neuronal maturation in children and may facilitate better understanding of the pathophysiology of developmental disorders.
Introduction
γ-aminobutyric acid (GABA) is the primary inhibitory neurotransmitter in the human brain, involved in several (patho)-physiological functions1. A few studies have demonstrated a decline in GABA levels as a result of healthy aging in adults (20+ years)2,3. A small number of cross-sectional studies (6-53.3 years) have reported GABA increases in late development into adulthood4,5. However, it remains unclear how GABA levels vary through early development. Glutathione (GSH) is a major antioxidant in the brain and is considered a marker of oxidative stress, which has potential implications on cognitive function. To our knowledge, age-related differences in GSH have not been reported in either adulthood or childhood. Understanding normative neuronal maturation is essential in order to investigate neurodevelopmental disorders. The aim of this study was, therefore, to establish how GABA and glutathione vary with age in a pediatric sample.Methods
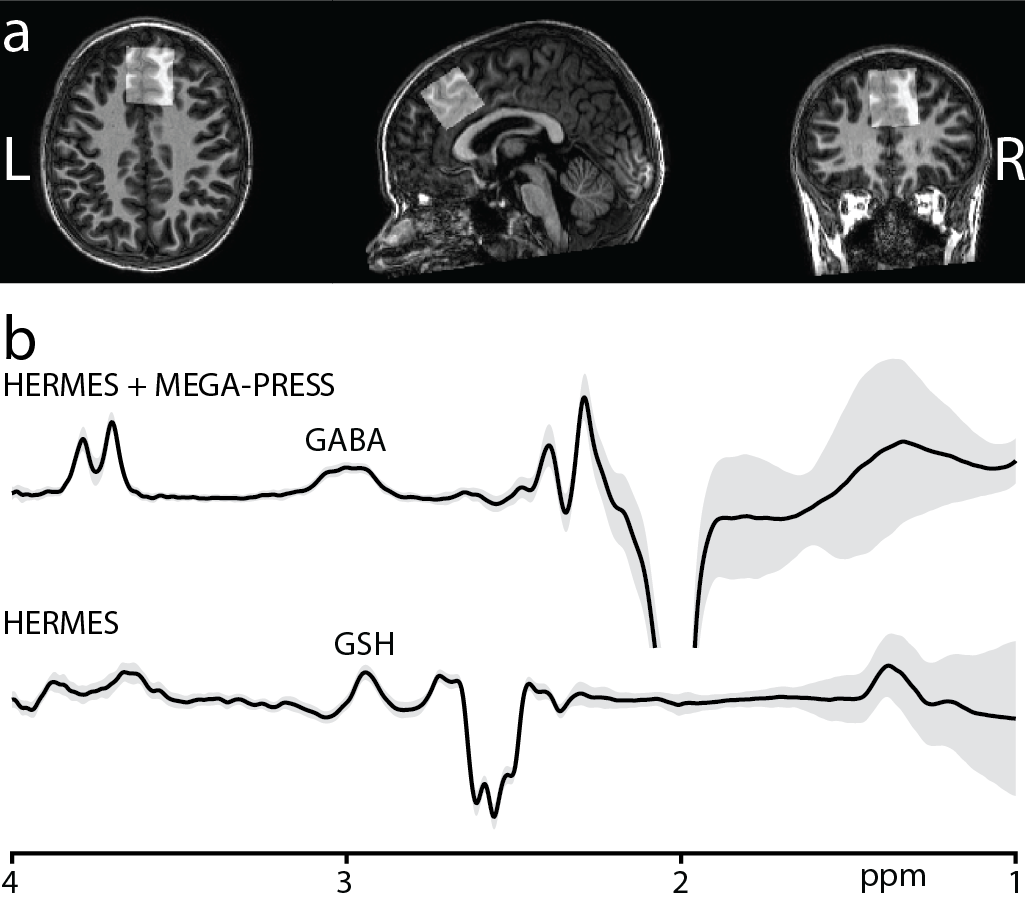
Subjects: A total of 21 healthy subjects (11 female, age range: 5.7-13.9 years) were scanned on a Philips 3T MRI scanner using a 32-channel head coil. A whole-brain MPRAGE acquisition was performed for each subject to allow placement of MRS voxels.Acquisition Protocol: Two subjects were scanned using the MEGA-PRESS sequence6 for measurement of GABA+ (ONGABA at 1.9 ppm and OFFGABA at 7.5 ppm). 19 subjects were scanned using the HERMES sequence7 for the simultaneous measurement of GABA+ (GABA+Macromolecules) at 3.0 ppm and GSH at 2.95 ppm. The HERMES sequence consisted of four sub-experiments: A) a dual-lobe editing pulse (ONGABA at 1.9 ppm; ONGSH at 4.56 ppm); B) a single-lobe editing pulse (ONGABA); C) a single-lobe editing pulse (ONGSH); and D) a single-lobe editing pulse at 7.5 ppm (OFFGABA/GSH). GABA- and GSH-edited spectra were generated using the Hadamard combinations A+B–C–D and A–B+C–D, respectively. For both sequences, unsuppressed water reference data were acquired for each subject. Data were acquired from a voxel positioned in the frontal lobe (Figure 1a), with the following acquisition parameters: 30 × 30 × 30 mm3 voxel size; TE/TR 80/2000 ms; 20-ms editing pulse duration; 2048 data points; 2 kHz spectral width; 304 transients; and VAPOR water suppression8.
Data Processing: In vivo data were analyzed using Gannet9. A modified multi-step frequency-and-phase correction was applied to the data to reduce subtraction artifacts10, followed by a 3-Hz exponential filter and zero-padding by a factor of 16. Finally, the fully processed HERMES and MEGA-PRESS sub-spectra were combined to generate GABA- and GSH-edited spectra. The GABA+, GSH, and 3.0 ppm Cr (from OFFGABA/GSH and OFFGABA) signals were modeled to calculate GABA+/Cr and GSH/Cr integral ratios. MPRAGE images were segmented using SPM1211 to calculate gray matter (fGM), white matter (fWM), and cerebrospinal fluid voxel tissue fractions. Absolute concentrations were also calculated in institutional units (i.u.), correcting for tissue-dependent signal attenuation12.
Analysis: In order to assess data quality, B0 drift and water signal linewidth at full-width half-maximum (FWHM) were quantified. The Cr signal at 3 ppm and the water signal at 4.68 ppm were used to estimate B0 drift in the in vivo HERMES and MEGA-PRESS data, respectively, before frequency/phase alignment. Also, the GABA and GSH fit errors (FitErr) from Gannet were used for assessing modelling errors. Pearson correlation coefficients (r) were calculated to examine the association between age and GABA+ (and GSH), between age and GABA+/Cr (and GSH/Cr), and between age and GMratio (fGM/fGM+fWM). p-values of less than 0.05 were considered significant. Statistical analyses were conducted in R13. Unless otherwise stated, values are presented as mean or mean ± SD.
Results
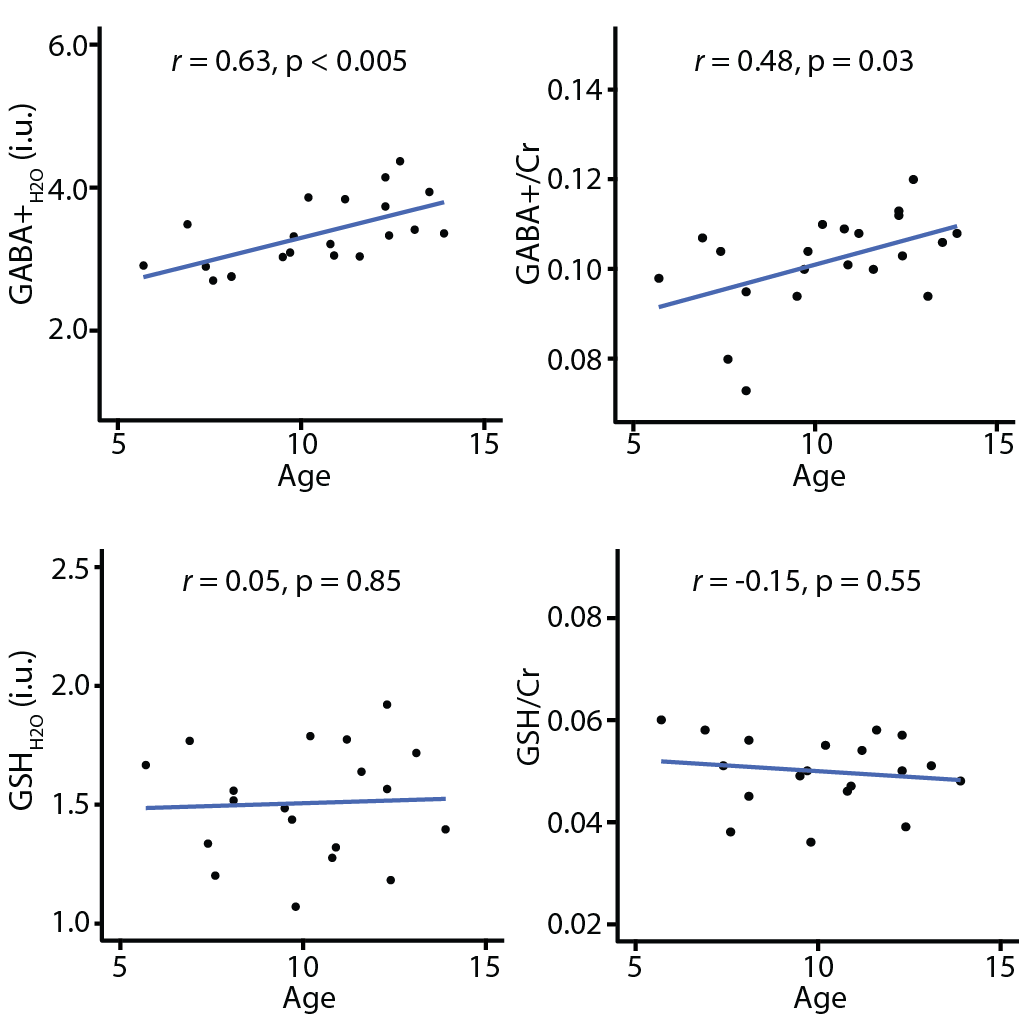
Figure 1b shows the average edited difference spectra for all subjects. B0 drift during the 10-minute edited MRS acquisitions were 2.52 ± 0.78 Hz, and water linewidth was 8.15 ± 0.40 Hz, respectively, indicating excellent frequency stability and B0 homogeneity. FitErr from Gannet were 5.84 ± 1.91% for GABA and 8.83 ± 1.44% for GSH, indicating low fit errors. Figure 2 shows the correlations between GABA (and GSH) measurements and age. Both GABA+H2O (r = 0.63, p < 0.005) and GABA+/Cr (r = 0.48, p < 0.03) significantly positively correlated with age, whereas GSH measurements and GMratio did not.Discussion
The qualitative analysis revealed excellent data quality, allowing a correlational analysis with age. To our knowledge, this is the first study to examine correlations of both GABA and GSH with age in a young pediatric cohort (~5–14 years), revealing a strong and significant correlation of age with GABA+, but not GSH. It remains unclear why GABA increases but GSH is stable. Increased GABA during development likely reflects neuronal maturation and proliferation of GABAergic neurons and is consistent with increased synaptic activity of inhibitory interneurons in development. Little is known about the role of GSH in development. However, the stability of GSH suggests that the ability of the CNS to cope with oxidative stress is stable. Future studies should use longitudinal designs to investigate age-related changes in GABA and GSH across multiple brain regions.Conclusion
To our knowledge, this is the first study to demonstrate GABA+ increases and no differences in GSH with age in a healthy pediatric sample.Acknowledgements
No acknowledgement found.References
1. Puts NA, Edden RA. In vivo magnetic resonance spectroscopy of GABA: a methodological review. Prog Nucl Magn Reson Spectrosc. 2012;60:29-41.
2. Gao F, Edden RA, Li M, Puts NA, Wang G, et al. Edited magnetic resonance spectroscopy detects an age-related decline in brain GABA levels. Neuroimage. 2013;78:75-82.
3. Porges EC, Woods AJ, Edden RA, Puts NA, Harris AD, et al. Frontal gamma-aminobutyric acid concentrations are associated with cognitive performance in older adults. Biological Psychiatry: Cognitive Neuroscience and Neuroimaging. 2017;2:38-44.
4. Ghisleni C, Bollmann S, Poil S-S, Brandeis D, Martin E, et al. Subcortical glutamate mediates the reduction of short-range functional connectivity with age in a developmental cohort. Journal of Neuroscience. 2015;35:8433-8441.
5. Port RG, Gaetz W, Bloy L, Wang DJ, Blaskey L, et al. Exploring the relationship between cortical GABA concentrations, auditory gamma‐band responses and development in ASD: Evidence for an altered maturational trajectory in ASD. Autism Research. 2017;10:593-607.
6. Mescher M, Merkle H, Kirsch J, Garwood M, Gruetter R. Simultaneous in vivo spectral editing and water suppression. NMR Biomed. 1998;11:266-272.
7. Saleh MG, Oeltzschner G, Chan KL, Puts NA, Mikkelsen M, et al. Simultaneous edited MRS of GABA and glutathione. Neuroimage. 2016;15:576-582.
8. Tkáč I, Starčuk Z, Choi I-Y, Gruetter R. In vivo 1H NMR spectroscopy of rat brain at 1 ms echo time. Magn Reson Med. 1999;41:649-656.
9. Edden RA, Puts NA, Harris AD, Barker PB, Evans CJ. Gannet: A batch‐processing tool for the quantitative analysis of gamma‐aminobutyric acid–edited MR spectroscopy spectra. J Magn Reson Imaging. 2014;40:1445-1452.
10. Mikkelsen M, Saleh MG, Near J, Chan KL, Gong T, et al. Frequency and phase correction for multiplexed edited MRS of GABA and glutathione. Magn Reson Med. 2018;80:21-28.
11. Ashburner J, Friston KJ. Unified segmentation. Neuroimage. 2005;26:839-851.
12. Gasparovic C, Song T, Devier D, Bockholt HJ, Caprihan A, et al. Use of tissue water as a concentration reference for proton spectroscopic imaging. Magnetic Resonance in Medicine: An Official Journal of the International Society for Magnetic Resonance in Medicine. 2006;55:1219-1226.
13. R Core Team, 2018. https://www.R-project.org. R: a Language and Environment for Statistical Computing. R Foundation for Statistical Computing, Vienna, Austria. https://www.R-project.org.
Figures