2920
Multi-site/Multi-vendor reproducibility of advanced MRS at 3T in a clinical cohort1CMRR/Radiology, University of Minnesota, Minneapolis, MN, United States, 2Division of Biostatistics, University of Minnesota, Minneapolis, MN, United States, 3Sir Peter Mansfield Imaging Centre, School of Physics and Astronomy, University of Nottingham, Nottingham, United Kingdom, 4Radiology and Radiological Science, Johns Hopkins University School of Medicine, Baltimore, MD, United States, 5A.A. Martinos Center for Biomedical Imaging / Radiology, Massachusetts General Hospital, Harvard Medical School, Charlestown, MA, United States, 6Neurology, University of Minnesota Medical School, Minneapolis, MN, United States, 7Psychiatry and Behavioral Sciences, Johns Hopkins University, Baltimore, MD, United States, 8Neurology, Massachusetts General Hospital, Harvard Medical School, Boston, MA, United States, 9Kennedy Krieger Institute, Johns Hopkins University School of Medicine, Baltimore, MD, United States
Synopsis
The reproducibility of an advanced single voxel MRS protocol was tested in a clinical cohort and control subjects at 3T in a multi-site setting. A standardized MRS protocol was implemented on two MR system vendors (Siemens, Philips) over three sites. This protocol utilized automated voxel placement and an sLASER pulse sequence with identical radiofrequency waveforms, pulse durations, interpulse delays and gradient spoilers. Spectral quality, metabolite concentrations and test-retest reproducibility results from three voxels are reported from both the healthy control group and subjects with genetically-confirmed spinocerebellar ataxia type 3 (SCA3), a hereditary movement disorder.
Introduction
MRS-based biomarkers provide access to early neurochemical abnormalities during neurodegeneration1,2 as well as potentially allowing the monitoring of response to therapy. Multisite studies that utilize advanced MRS technology are needed to fully take advantage of this capability and to allow pooling of data across sites to enable cohort studies of meaningful sizes for clinical trials. Recently, the sLASER sequence was recommended for use at high fields (≥3T)3 and its between-site reproducibility demonstrated in healthy cohorts4. Prior to utilizing an advanced MRS protocol in a multi-site clinical trial, demonstration of its reproducibility in clinical cohorts is essential. This abstract reports the reproducibility of a standardized sLASER-based MRS protocol across sites and vendors in subjects with spinocerebellar ataxia type 3 (SCA3) and matched control subjects. Specifically, spectral quality measures, metabolite concentrations and their test-retest reproducibility across sites were evaluated.Methods
Subjects with SCA3 at early-moderate disease stage (mean Scale for the Assessment and Rating of Ataxia (SARA): MN=8.4, HA=12.0, JH=13.2) and matched healthy controls were scanned twice at 3T, on the same or consecutive days.Collaborating sites: University of Minnesota, 'MN'; Massachusetts General Hospital, 'HA'; Johns Hopkins University,'JH'.
Site information and enrollment: MN (Siemens 3T Prisma Fit, Syngo software MR VE11C): 12 healthy control subjects (HC), 11 SCA3; HA: (Siemens 3T Prisma, Syngo MR VE11C): 7 HC, 5 SCA3; JH (Philips 3T Ingenia, software 5.5.2) 3 HC, 3 SCA3.
Protocol: VOIs (pons, putamen and cerebellar white matter (CBWM)) were automatically prescribed using AutoVOI5 based on 1mm isotropic 3D T1-weighted images. Single voxel MR spectra were acquired using a harmonized sLASER sequence [64 transients, TR=5000ms, TE=30ms]6. Unsuppressed water references were acquired for eddy current correction and LCModel water scaling. B0 field shimming was performed using voxel-localized projection approaches (FASTESTMAP, Siemens; 'Pencil beam', Philips).
Centralized data analysis: Single-shot spectra were eddy current, phase and frequency corrected before summing. Metabolite concentrations were estimated using LCModel (version 6.3-0G; Stephen Provencher Inc., Ontario, Canada) and corrected for CSF content of each VOI. A simulated basis set containing eighteen simulated metabolites and a measured macromolecule spectrum4 was used.
Statistical analysis: Hypotheses of interest were pairwise site differences (MN-HA, MN-JH, HA-JH). Linear mixed effect models were fitted for the most prominent metabolites (total N-Acetylaspartate (tNAA), total choline (tCho), total creatine (tCr), myo-inositol (Ins), glutamate (Glu)) and for spectral quality (linewidth and SNR) separately in each of the 3 VOIs. The patient vs. control group was considered a covariate in the model. Since each participant provided two measures for each measure in each VOI, within-subject variation was modeled as a random effect. The same method was used for detecting site effects for spectral quality (linewidth and SNR). Additionally, linear regression models were fit for the within-participant coefficient of variation (CV) (log-transformed to correct skewness) to test for pairwise site differences in reproducibility. Tukey’s method was applied within model to correct type I error for all pair-wise site comparisons. P-values were not adjusted for multiple testing across VOI or across metabolites.
Results
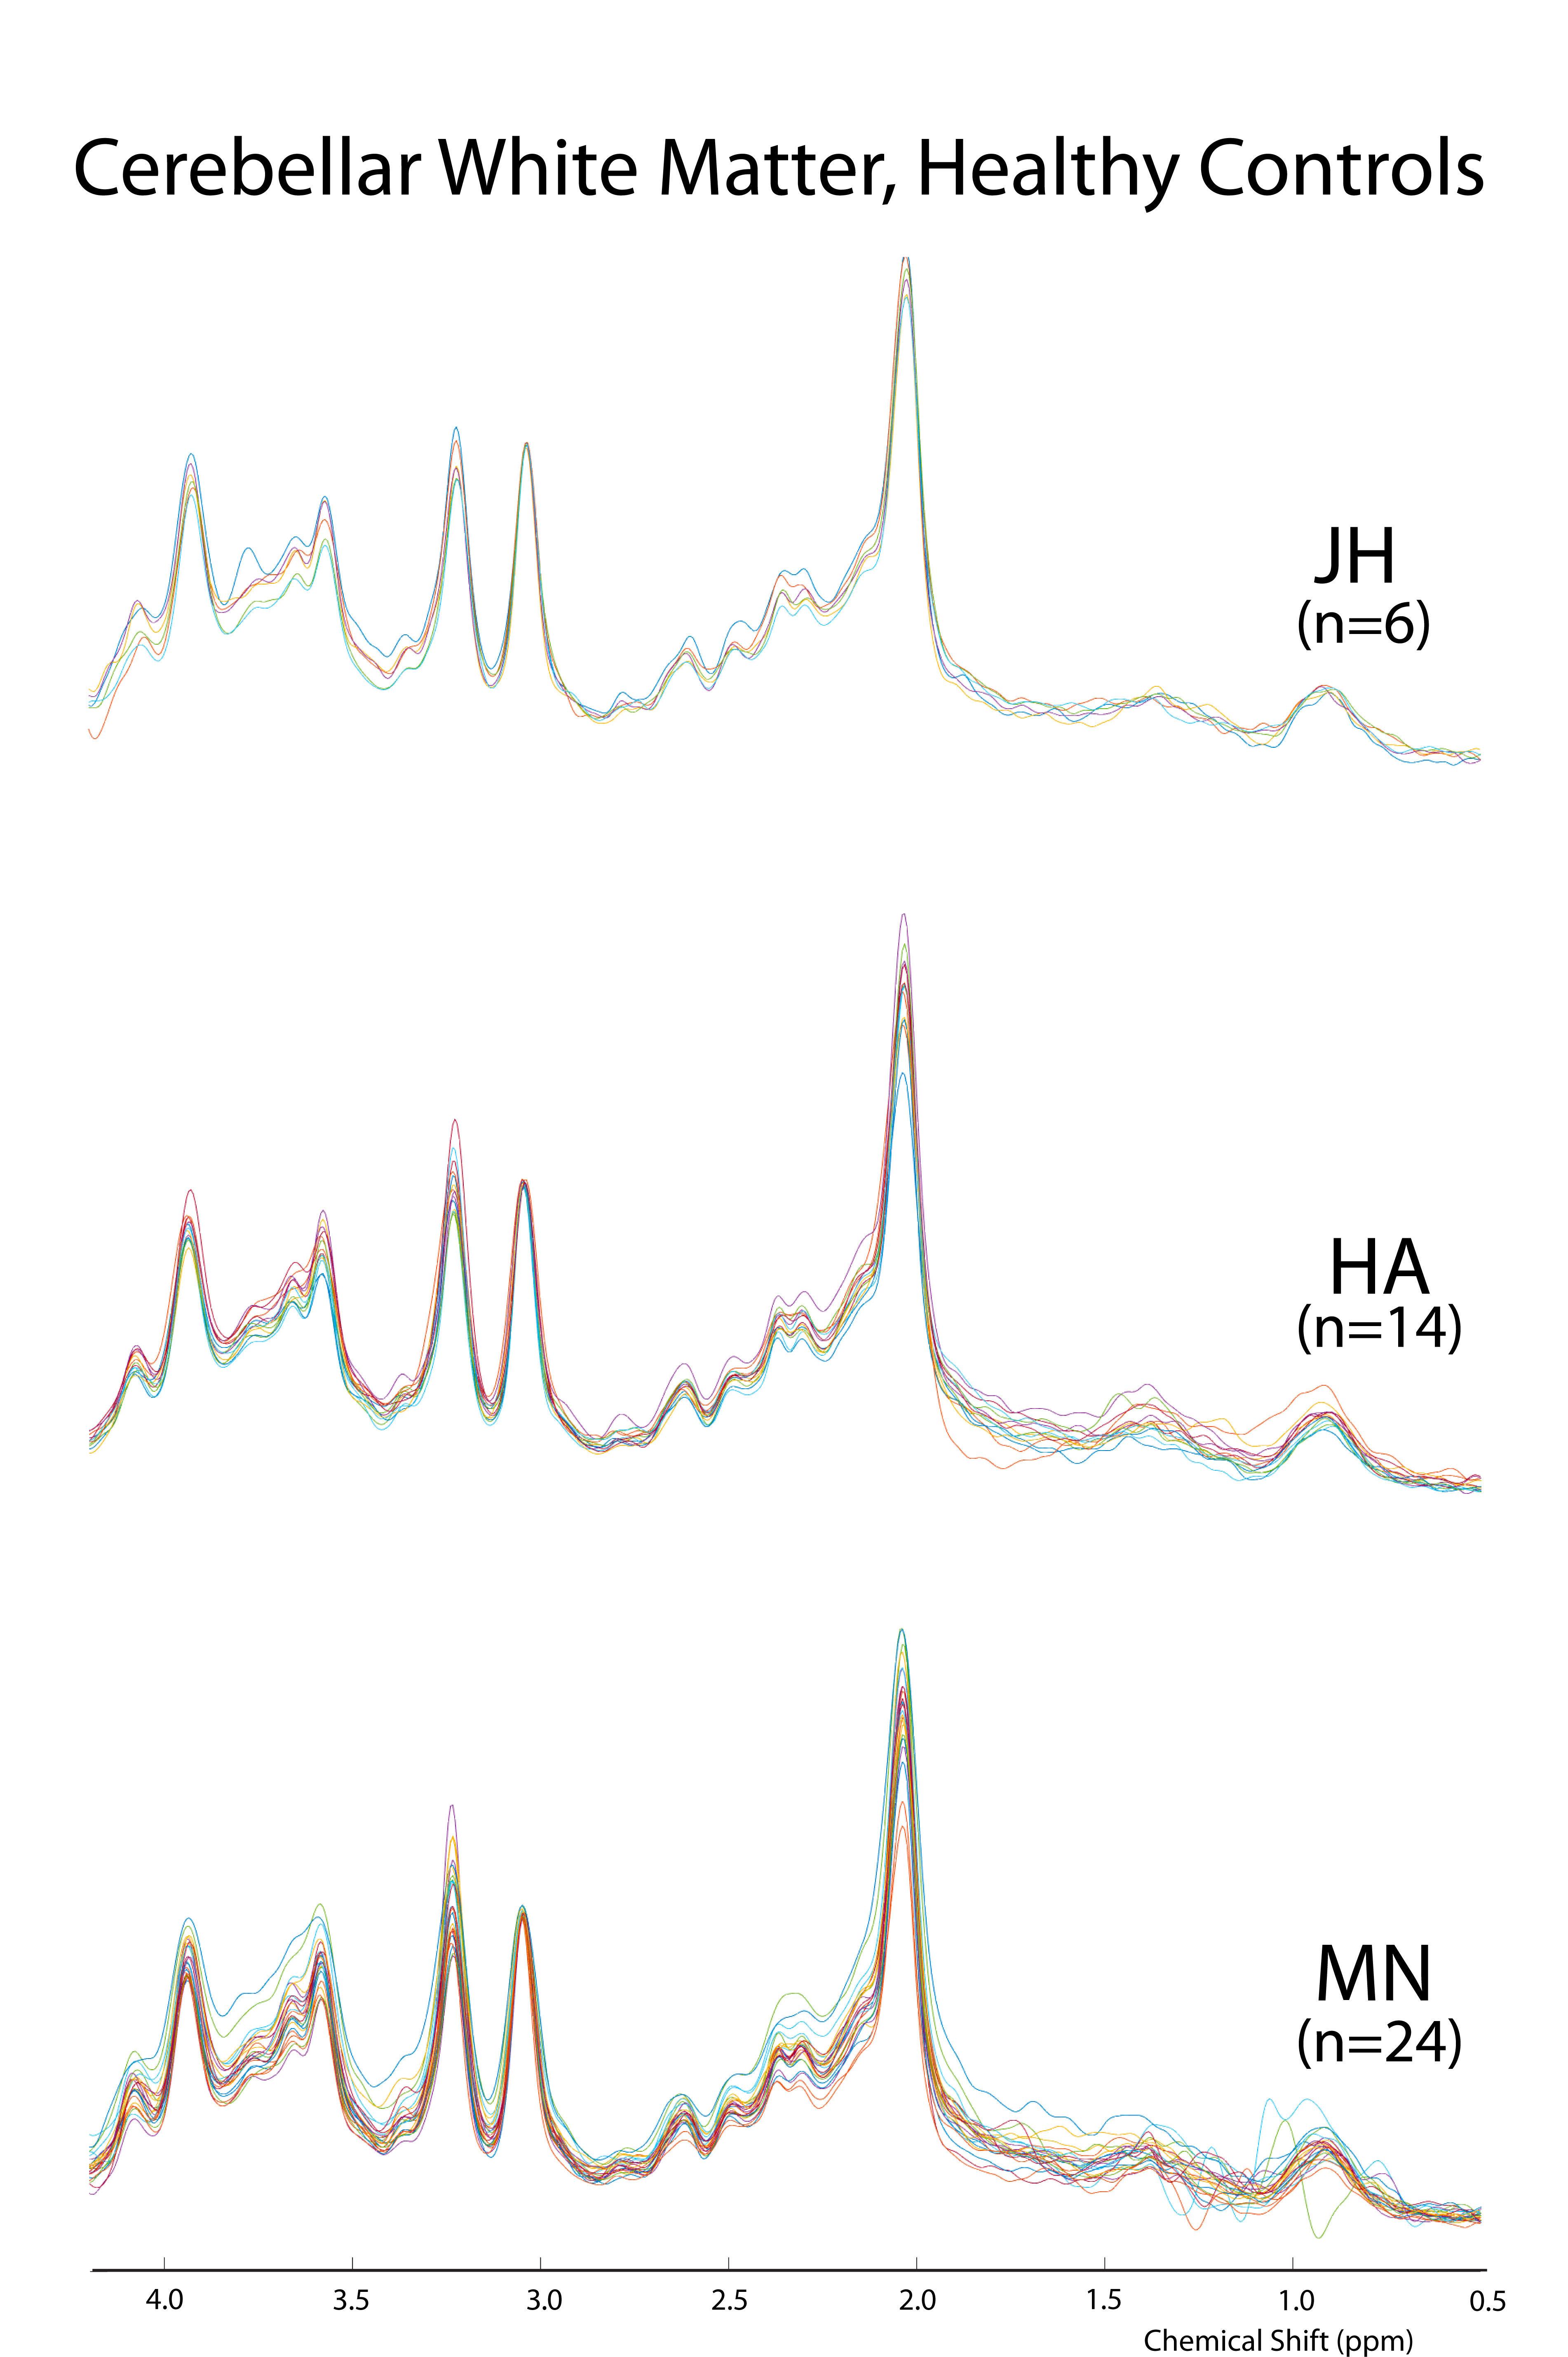
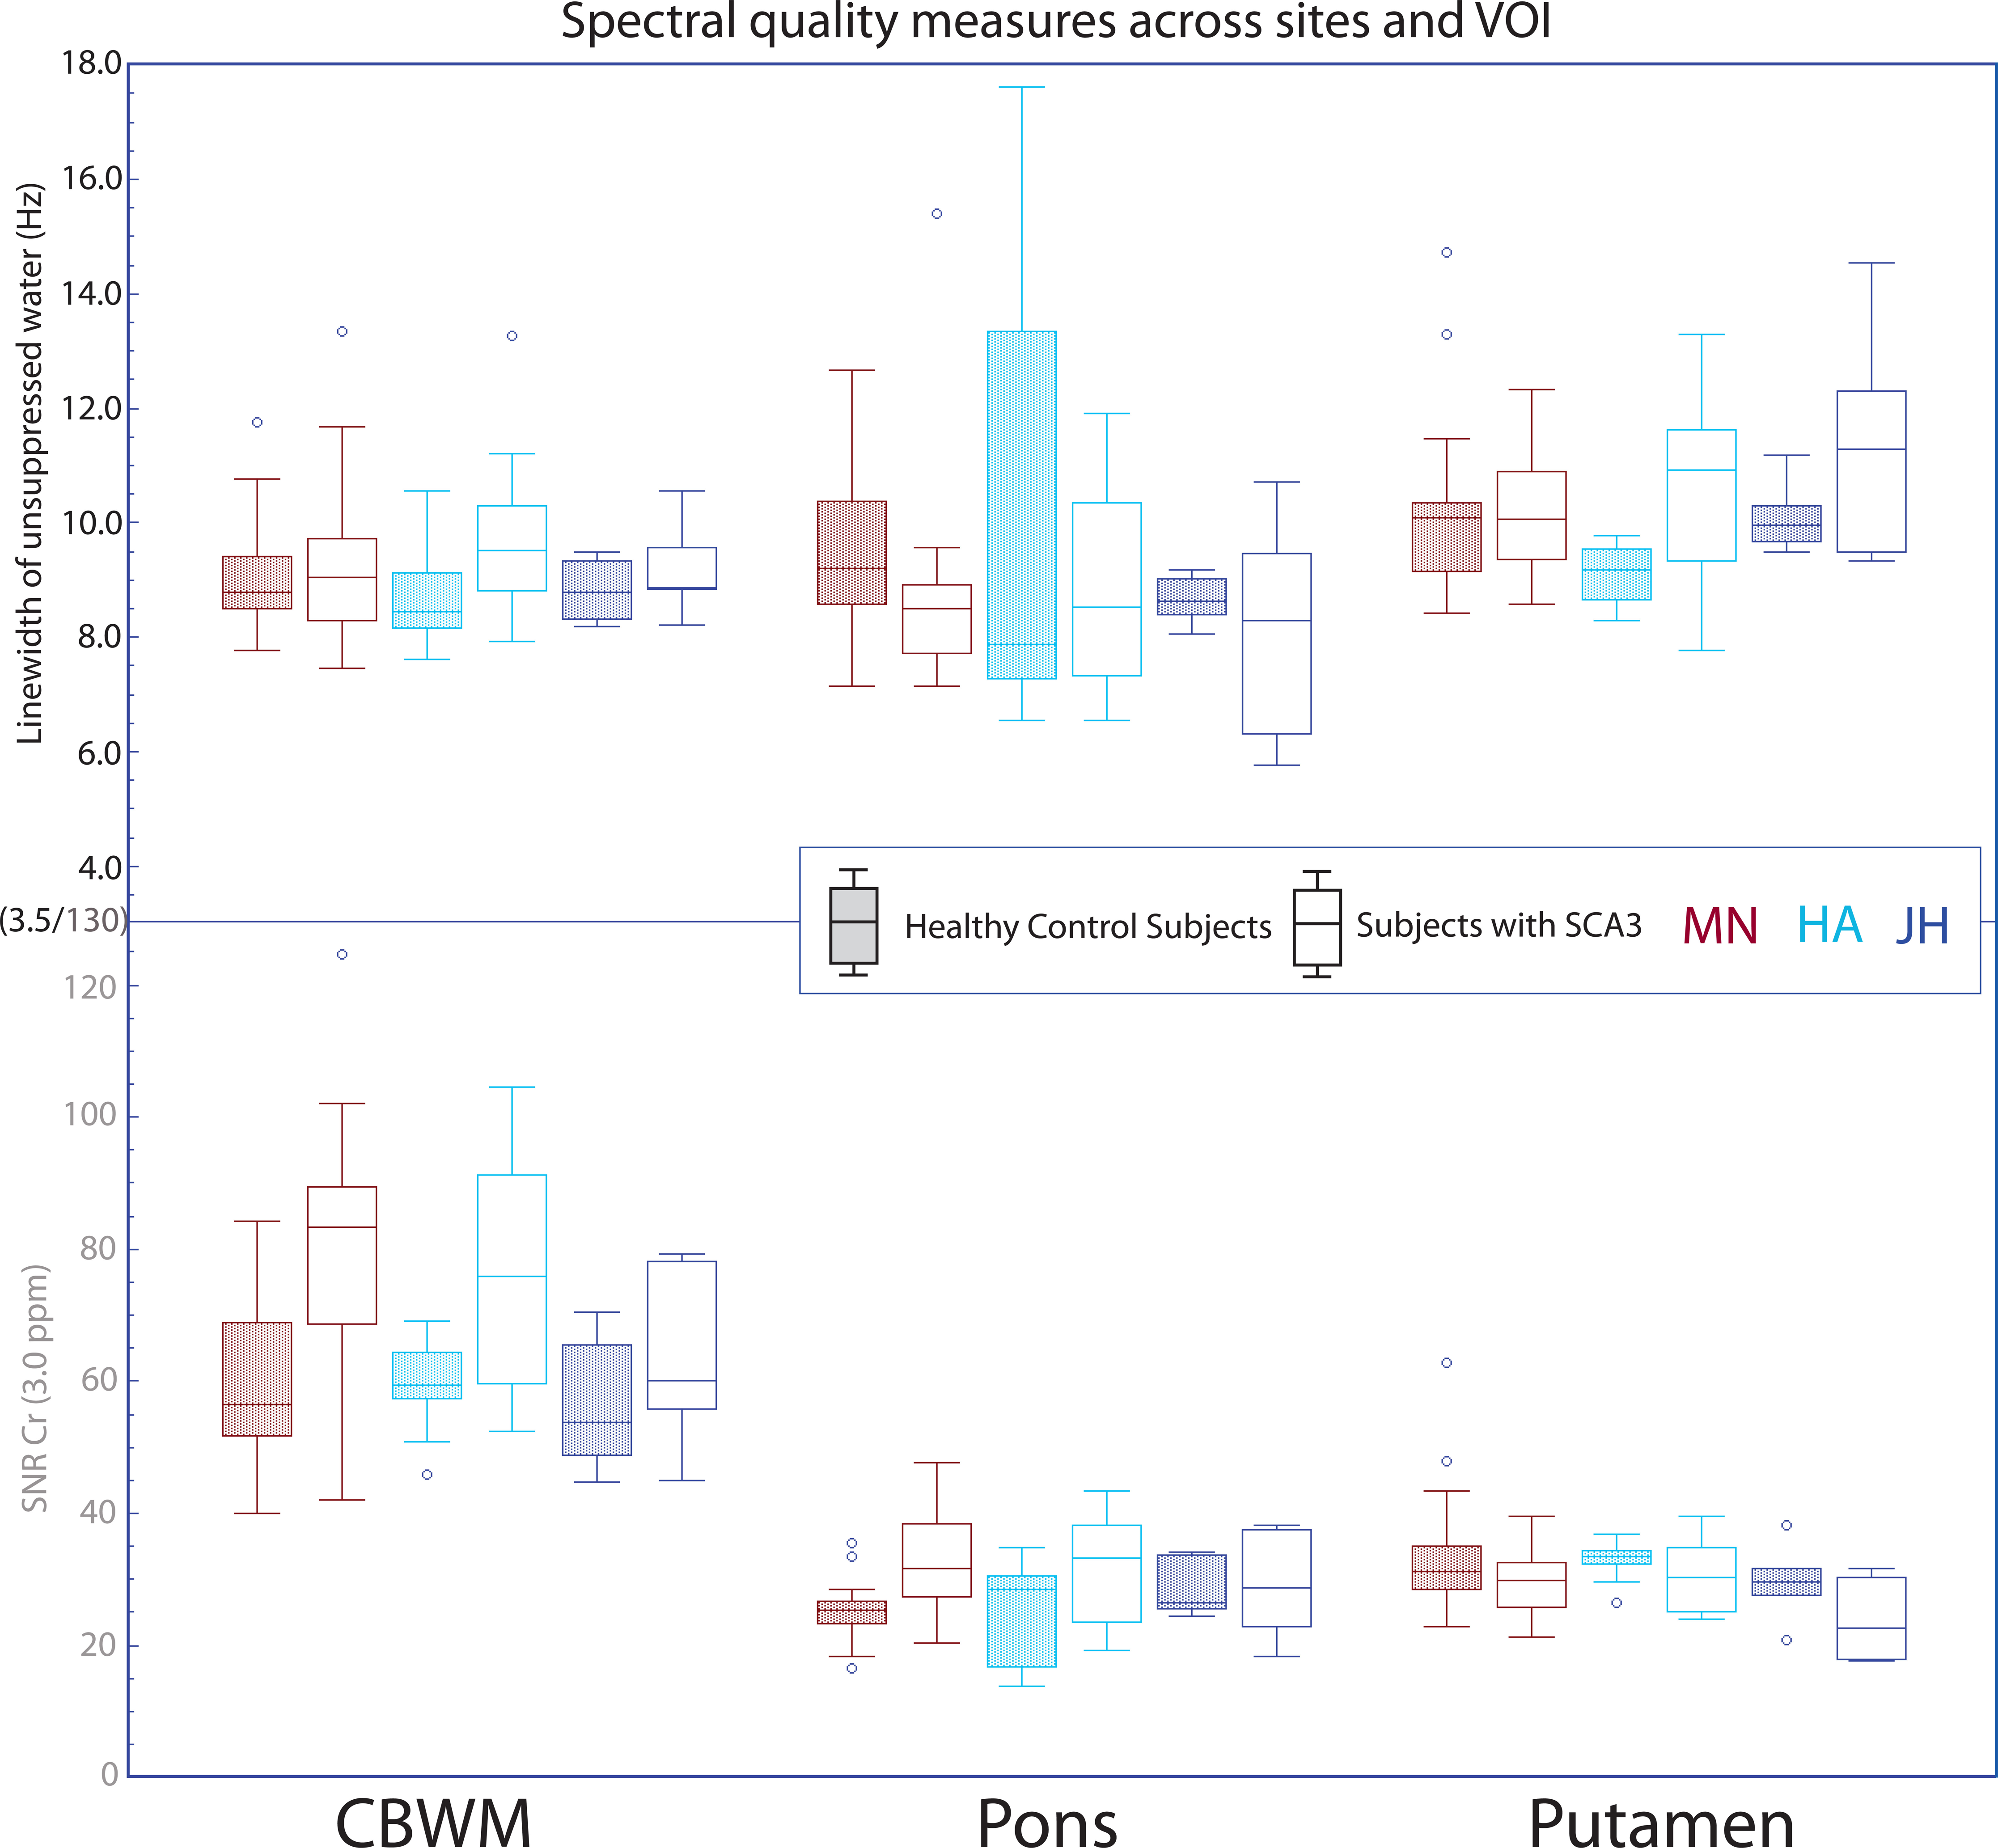
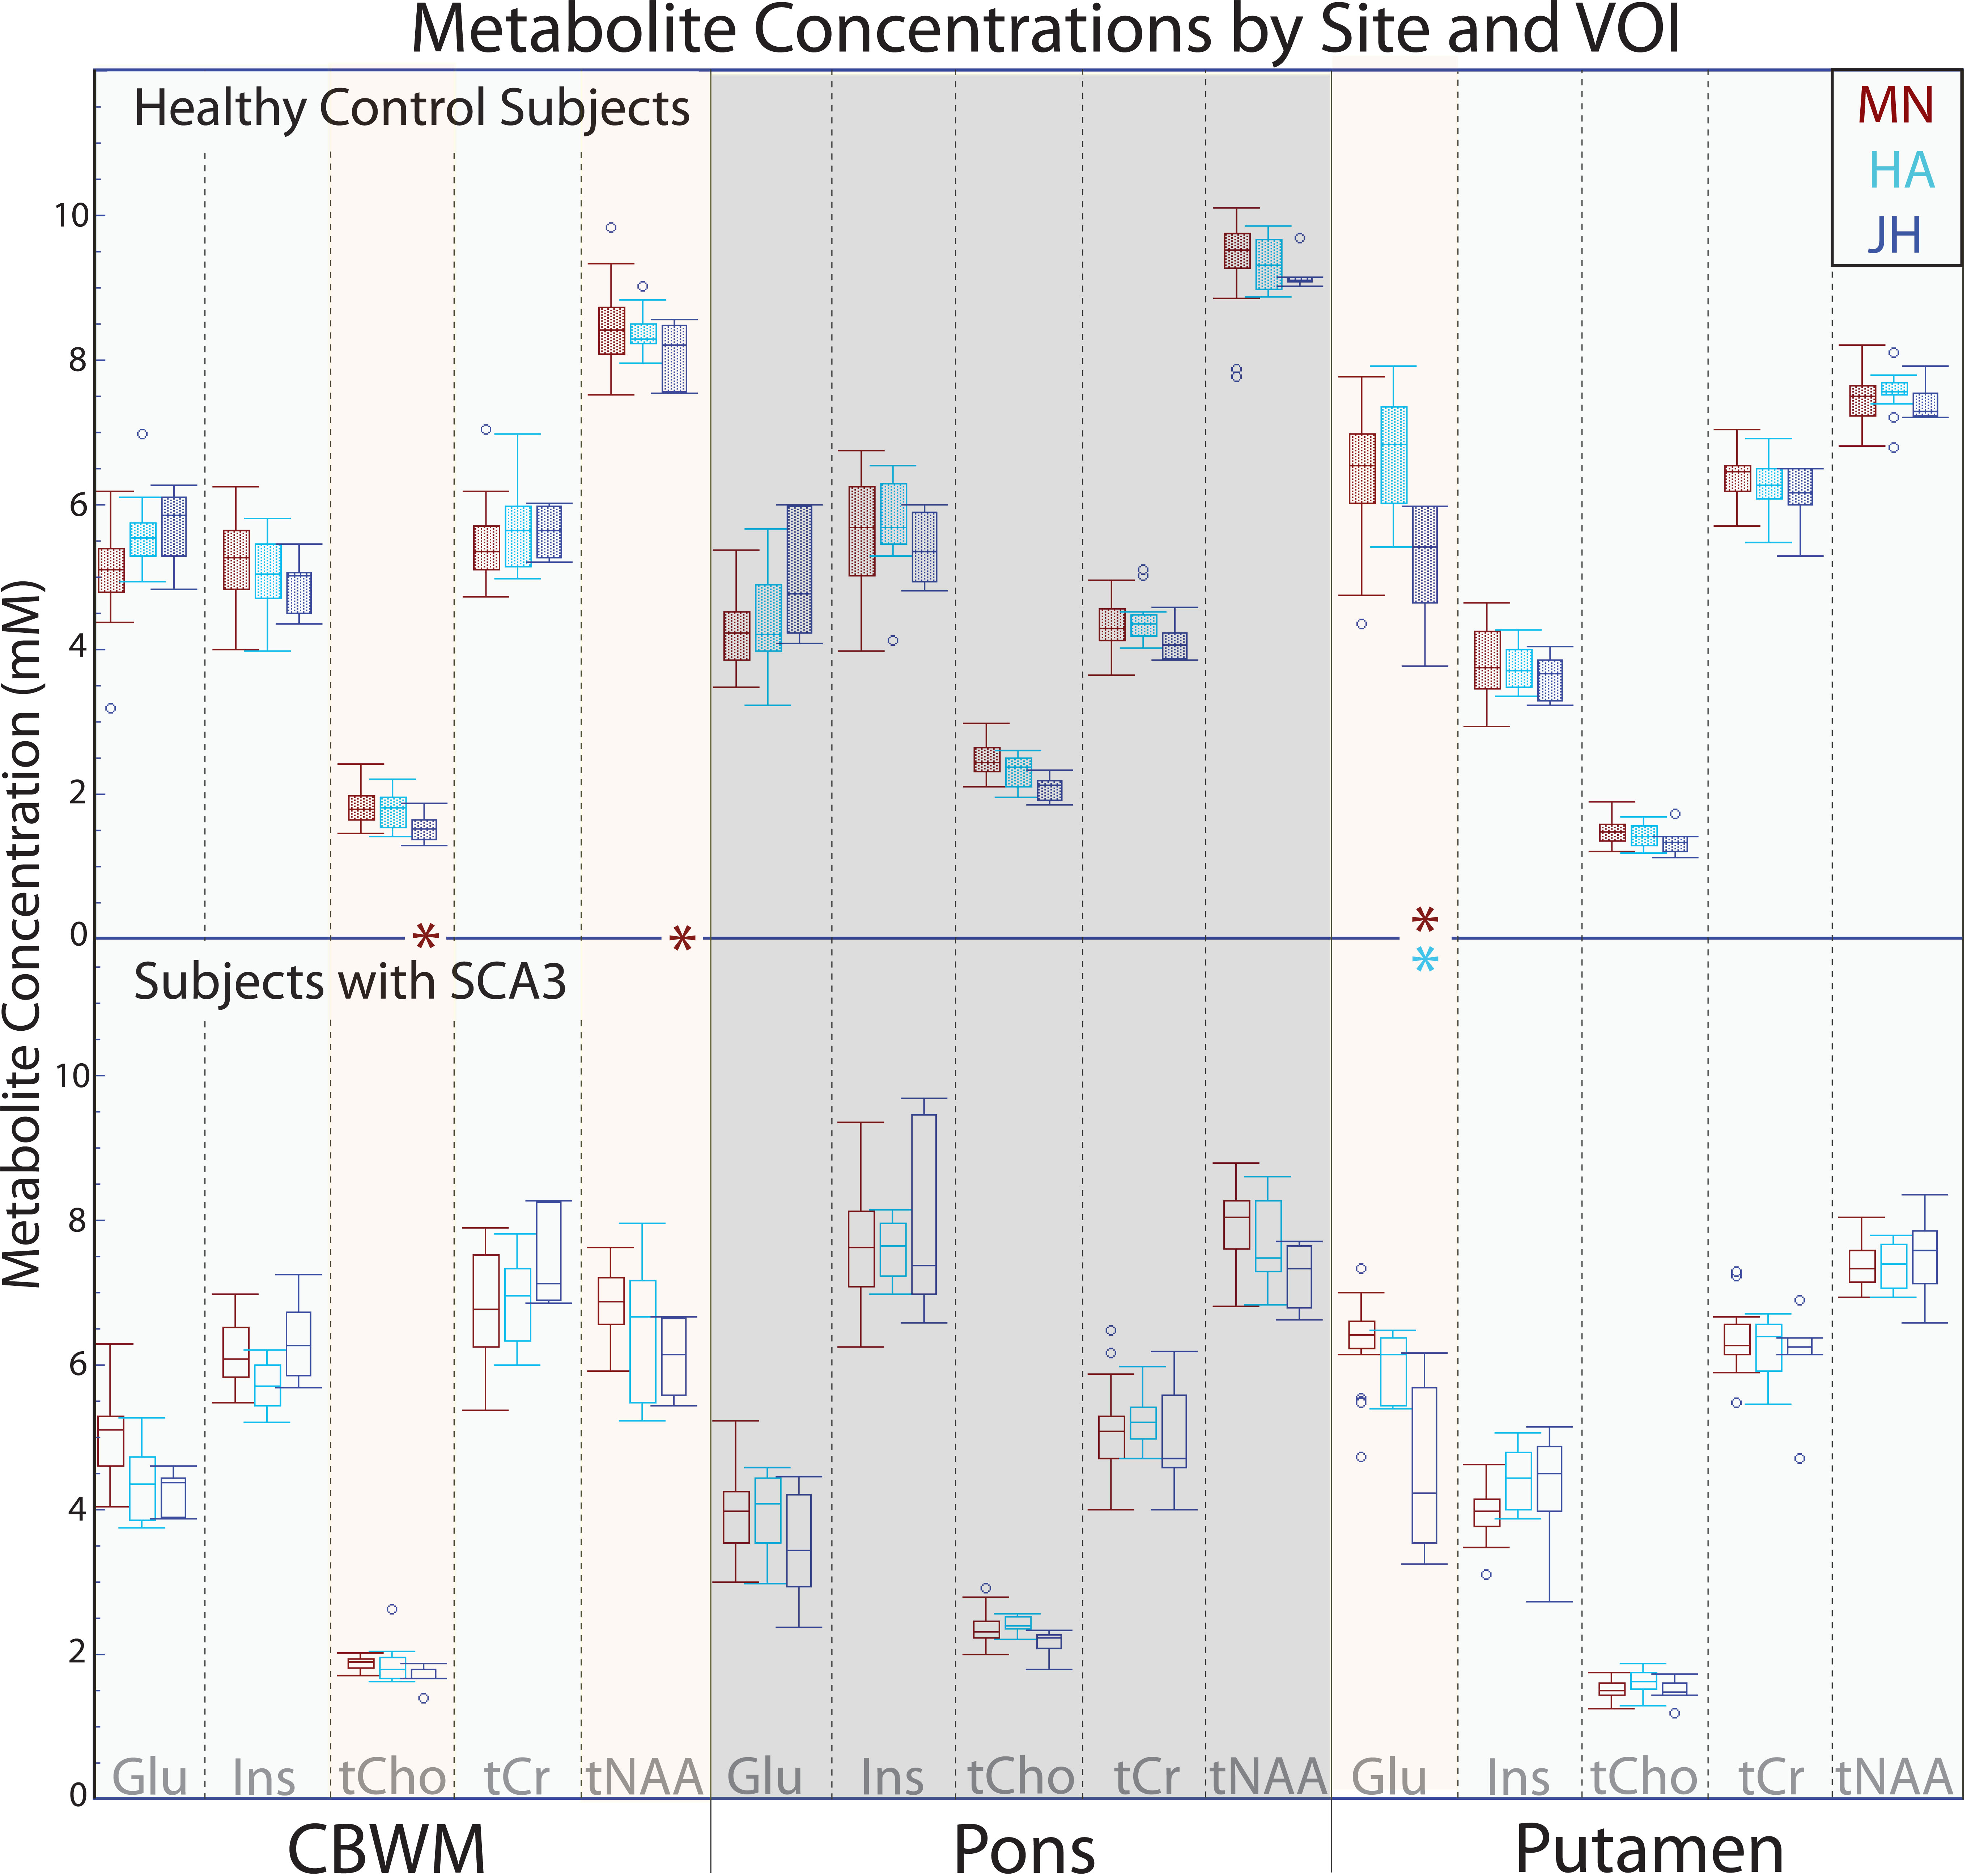
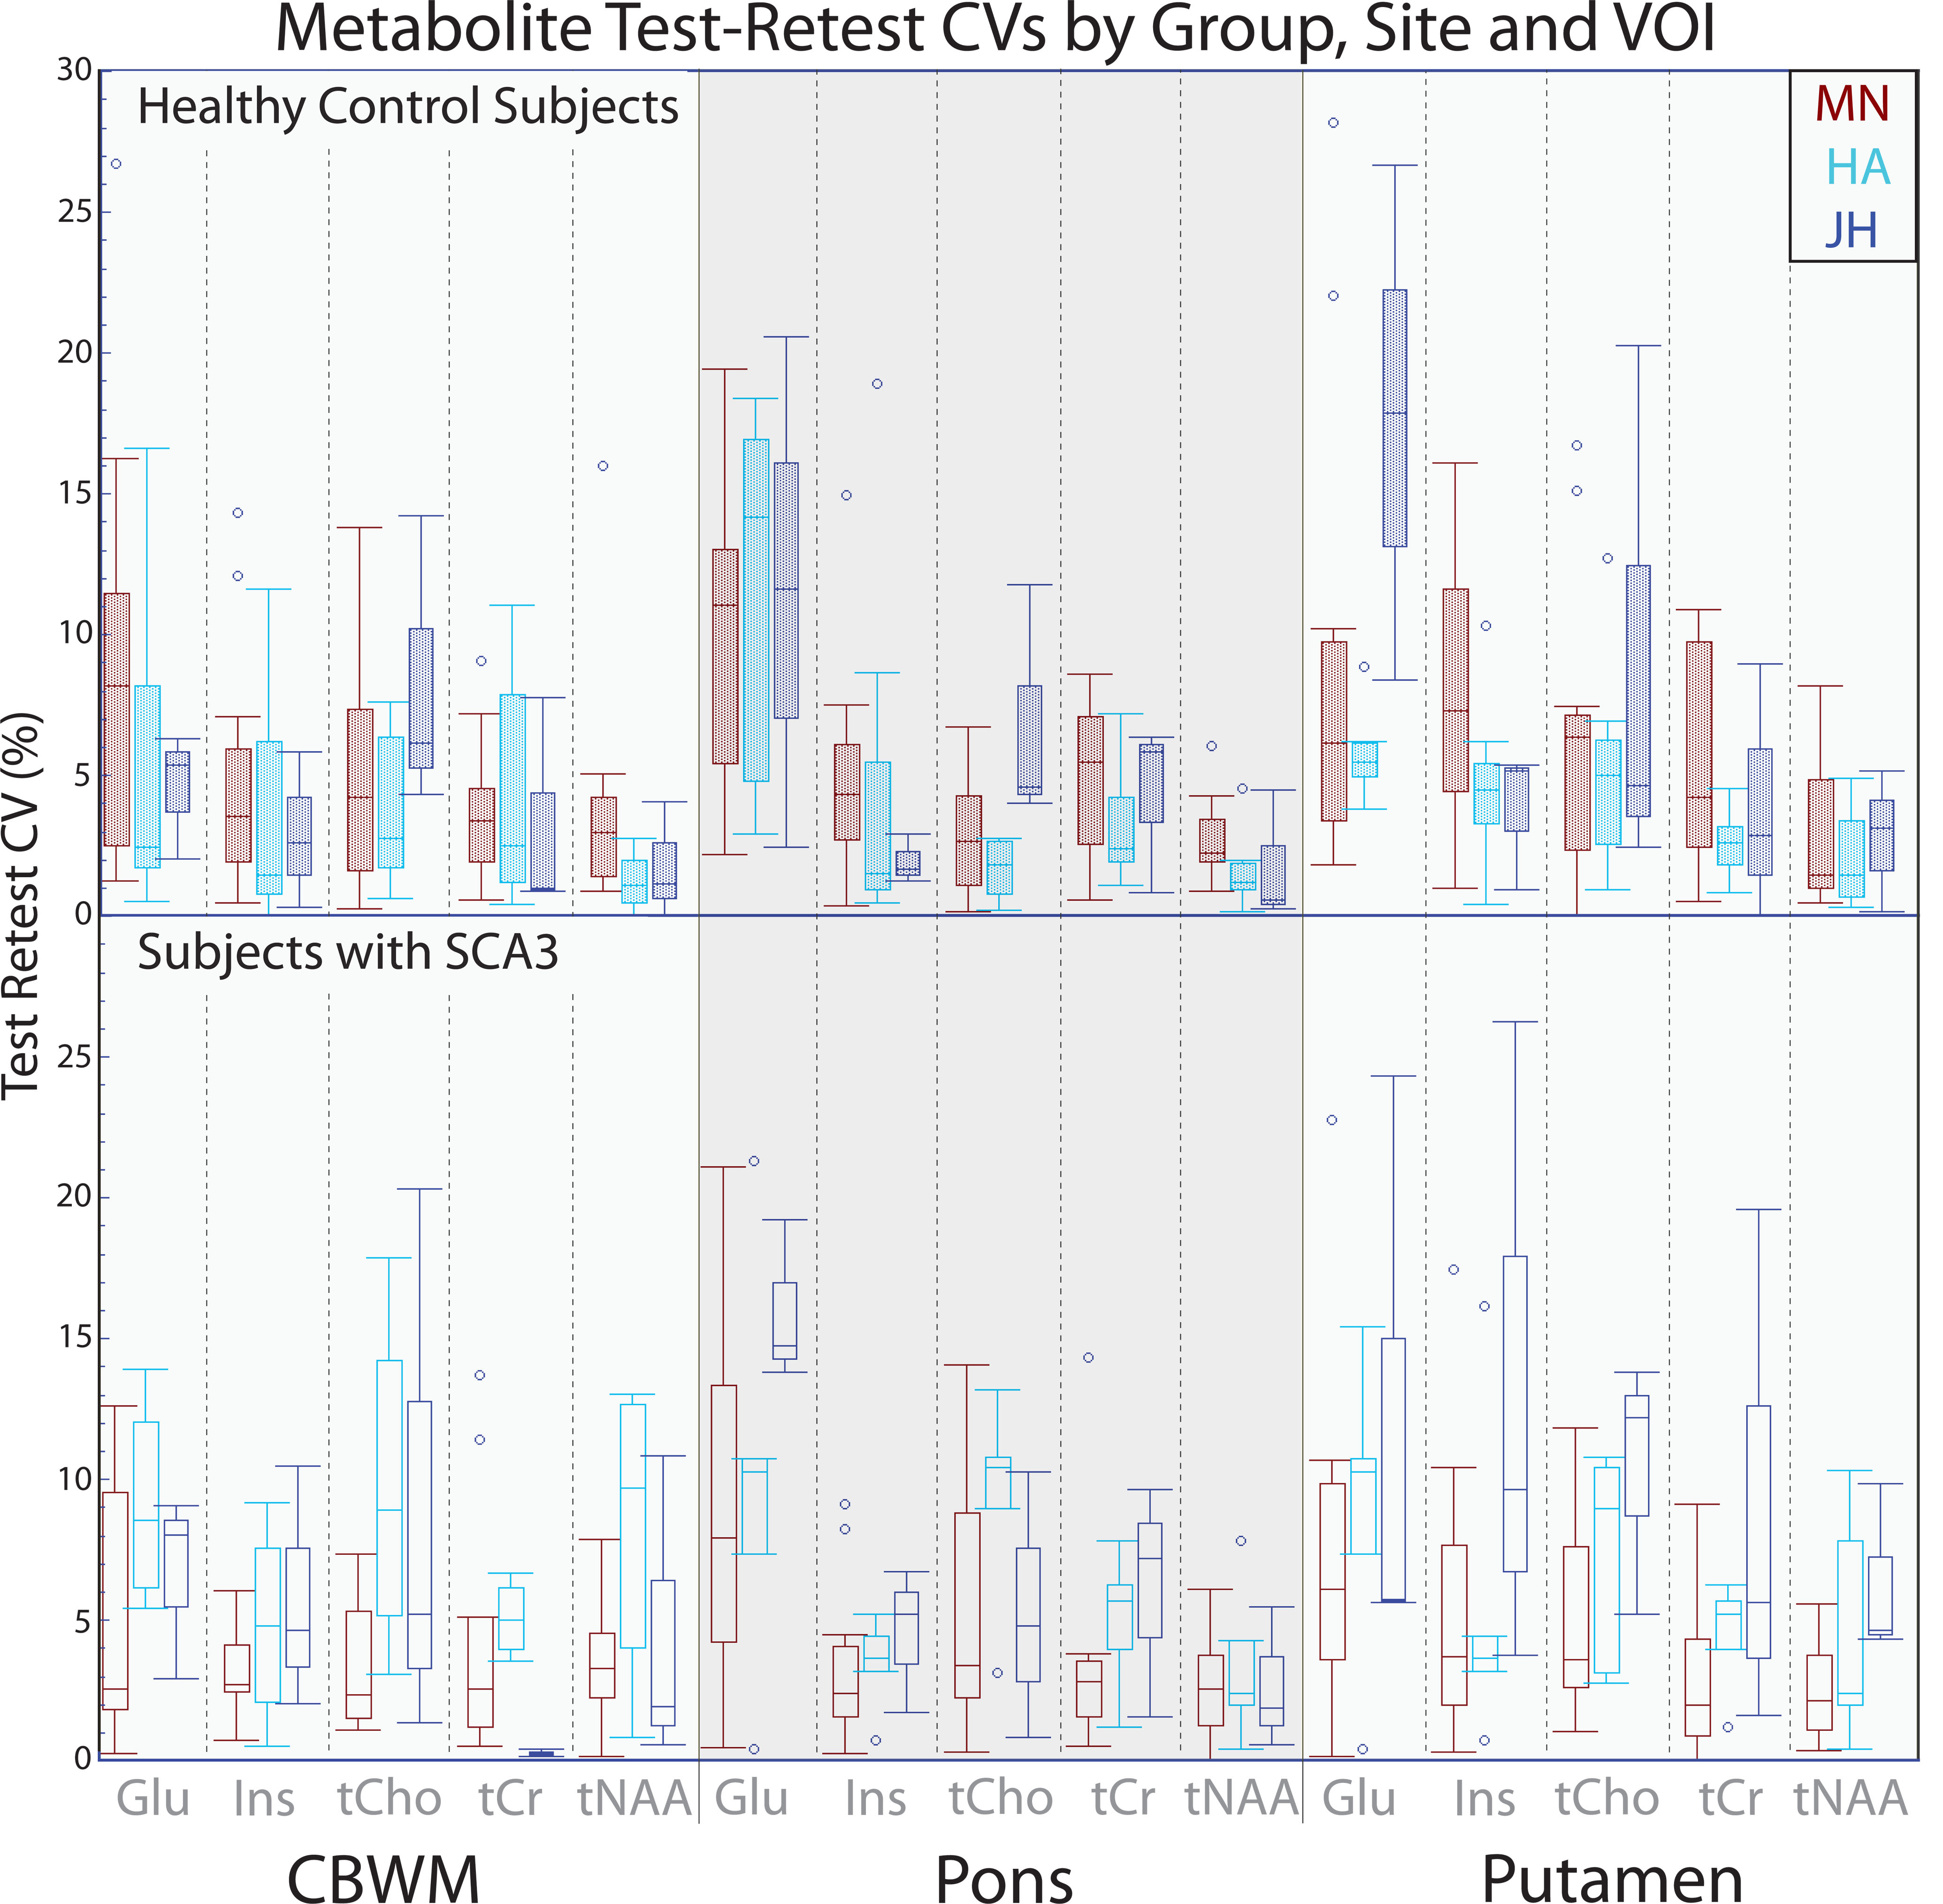
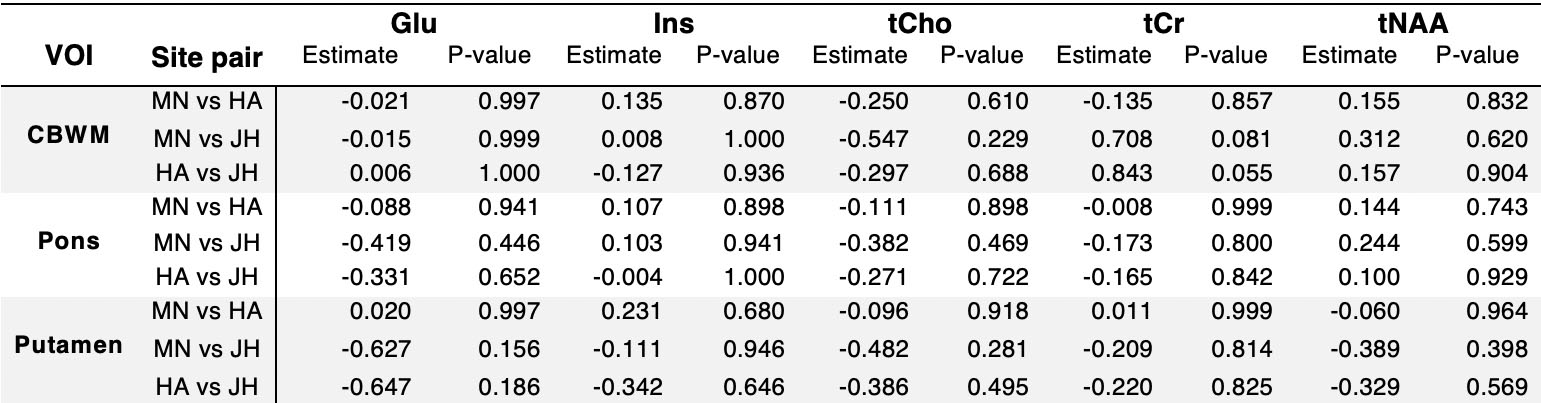
Spectral features across sites were highly similar (Fig1). No differences were detected in spectral quality metrics (linewidth and SNR) across sites (Fig2). Importantly, comparable linewidths were obtained in patients and controls at all sites. SNR measurements based on the tCr signal tended to be higher in two VOIs in the patient group vs. controls, consistent with its known elevation in patients with SCA32. Intra-group metabolite concentration means for each VOI generally agreed across sites, with differences detected in only 4 cases across 45 pairwise comparisons (Fig3). SCA3-control differences (lower tNAA, higher tCr, Ins in patients) previously reported in single site studies2,7 were apparent in data from all sites. Within subject test-retest CVs were used as a measure of reproducibility for each metabolite, with no differences across sites (Fig4 and Table1).Discussion
The harmonized sLASER protocol, including automated VOI prescriptions, identical sequence and parameters and comparable B0 and B1 calibrations, generated MRS data with consistent quality and reproducibility across sites and two vendors. The trends observed in the Philips vs Siemens data in few comparisons remain to be confirmed with a larger sample size. Specifically, tCho and tNAA of CBWM were different between sites MN and JH (Fig3). The mean tNAA concentrations in the MN and JH control groups were quite similar, suggesting that the SCA3 group (between-site differences in disease burden/mean SARA scores) may contribute to significance in this instance. In the putamen, glutamate was significantly different between HA and JH as well as MN and JH sites. This may be a result of typically broader linewidths in the putamen since glutamate was not significantly different in the other two regions where mean linewidths are lower. Consistently, glutamate measurements had lower test-retest reproducibility than other metabolites, particularly in the putamen and pons (Fig4).Conclusions
This study demonstrated that high quality single voxel MRS data with comparable spectral quality and test-retest reproducibility can be acquired from challenging VOIs in both healthy controls as well as subjects with neurodegenerative diseases using a harmonized, advanced MRS protocol at 3T in a multi-site/multi-vendor setting.Acknowledgements
This work was supported by the National Institute of Neurological Disorders and Stroke (NINDS) grant R01 NS080816. The Center for Magnetic Resonance Research is supported by the National Institute of Biomedical Imaging and Bioengineering (NIBIB) grant P41 EB015894 and the Institutional Center Cores for Advanced Neuroimaging award P30 NS076408.References
[1] Öz G, Deelchand DK, Wijnen JP, et al. Advanced single voxel 1H magnetic resonance spectroscopy techniques in humans: Experts' consensus recommendations. NMR Biomed (In press)
[2] Joers JM, Deelchand DK, Lyu T, et al. Neurochemical abnormalities in premanifest and early spinocerebellar ataxias. Ann Neurol 2018; 83(4):816-829.
[3] Wilson M, Andronesi O, Barker PB, et al. Methodological consensus on clinical proton MRS of the brain: Review and recommendations. Magn Reson Med 2019; 82(2):527-550.
[4] Deelchand DK, Adanyeguh IM, Emir UE, et al. Two-site reproducibility of cerebellar and brainstem neurochemical profiles with short-echo, single-voxel MRS at 3T. Magn Reson Med 2015; 73(5):1718-1725.
[5] Park YW, Deelchand DK, Joers JM, et al. AutoVOI: real-time automatic prescription of volume-of-interest for single voxel spectroscopy. Magn Reson Med 2018; 80(5):1787-1798.
[6] Deelchand DK, Berrington A, Noeske R, et al. Across-vendor standardization of semi-LASER for single-voxel MRS at 3 Tesla, NMR Biomed (In press).
[7] Adanyeguh IM, Henry P-G; Nguyen TM, et al. In Vivo Neurometabolic Profiling in Patients With Spinocerebellar Ataxia Types 1, 2, 3, and 7. Mov Disord 2015; 30(5):662-670.
Figures