2918
Determination of Metabolite T2-Relaxation in the Medial Prefrontal Cortex at 7T Using an 8Tx/8Rx Channel Head Coil1Physikalisch-Technische Bundesanstalt (PTB), Braunschweig und Berlin, Germany
Synopsis
To investigate underlying mechanisms of psychiatric diseases, such as schizophrenia, magnetic resonance spectroscopy is a powerful tool. Here, the medial prefrontal cortex is a region of high interest, however, high quality measurements are technically challenging, and proper absolute quantification is hindered by the lack of literature values for metabolite relaxation times. This work presents the acquisition of high-quality MR spectra from the medial prefrontal cortex, and the preliminary calculation of metabolite T2 relaxation times, using an 8Tx/8Rx channel coil with a dedicated phase set optimized for B1 efficiency in the frontal cortex.
Introduction
MR spectroscopy at ultra-high fields (UHF) is a valuable tool to investigate the underlying mechanisms of psychiatric diseases, such as schizophrenia. Here, the medial prefrontal cortex is of particular interest1,2,3. However, due to large B0 and B1 inhomogeneities at UHF4 the acquisition of high-quality data enabling proper quantification of metabolite concentrations in this area is particularly challenging. Furthermore, the lack of literature values for metabolite relaxation times in the prefrontal cortex at 7T hinders accurate absolute quantification.In this work we demonstrate the acquisition of high-quality MR spectra by using an 8Tx/8Rx channel coil with a dedicated B1 phase shim for the purpose of determining metabolite T2 relaxation times in the medial prefrontal cortex.
Methods
Measurements of seven healthy volunteers, approved by the local ethics board, were performed at a 7T scanner (Magnetom 7T, Siemens Healthineers, Erlangen, Germany).Coil:
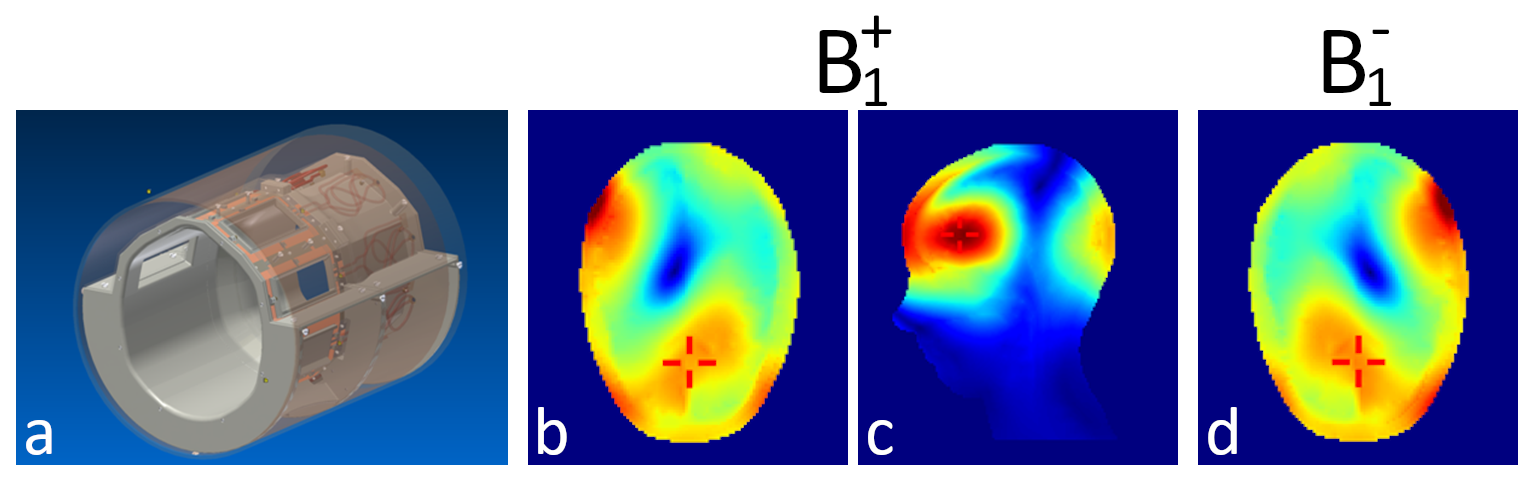
For transmission and signal reception an in-house developed 8-channel parallel-transmit head coil5 (Fig.1) hooked to a single-channel 8-kW radio-frequency (RF) power amplifier via a in-house-built 1:8 power splitter was used. Base mode of this effective 1Tx8Rx was the circular polarized mode with equal power and 45° phase increments between channels. To shift the sweet spot of highest B1 efficiency from the center of the head towards the frontal cortex, optimized channel phases were determined by finite-difference time-domain simulations (XFTDT, Remcom, USA) on the Ella and Duke models6 and implemented by adjusted cable-length between coil and power splitter.
Measurements:
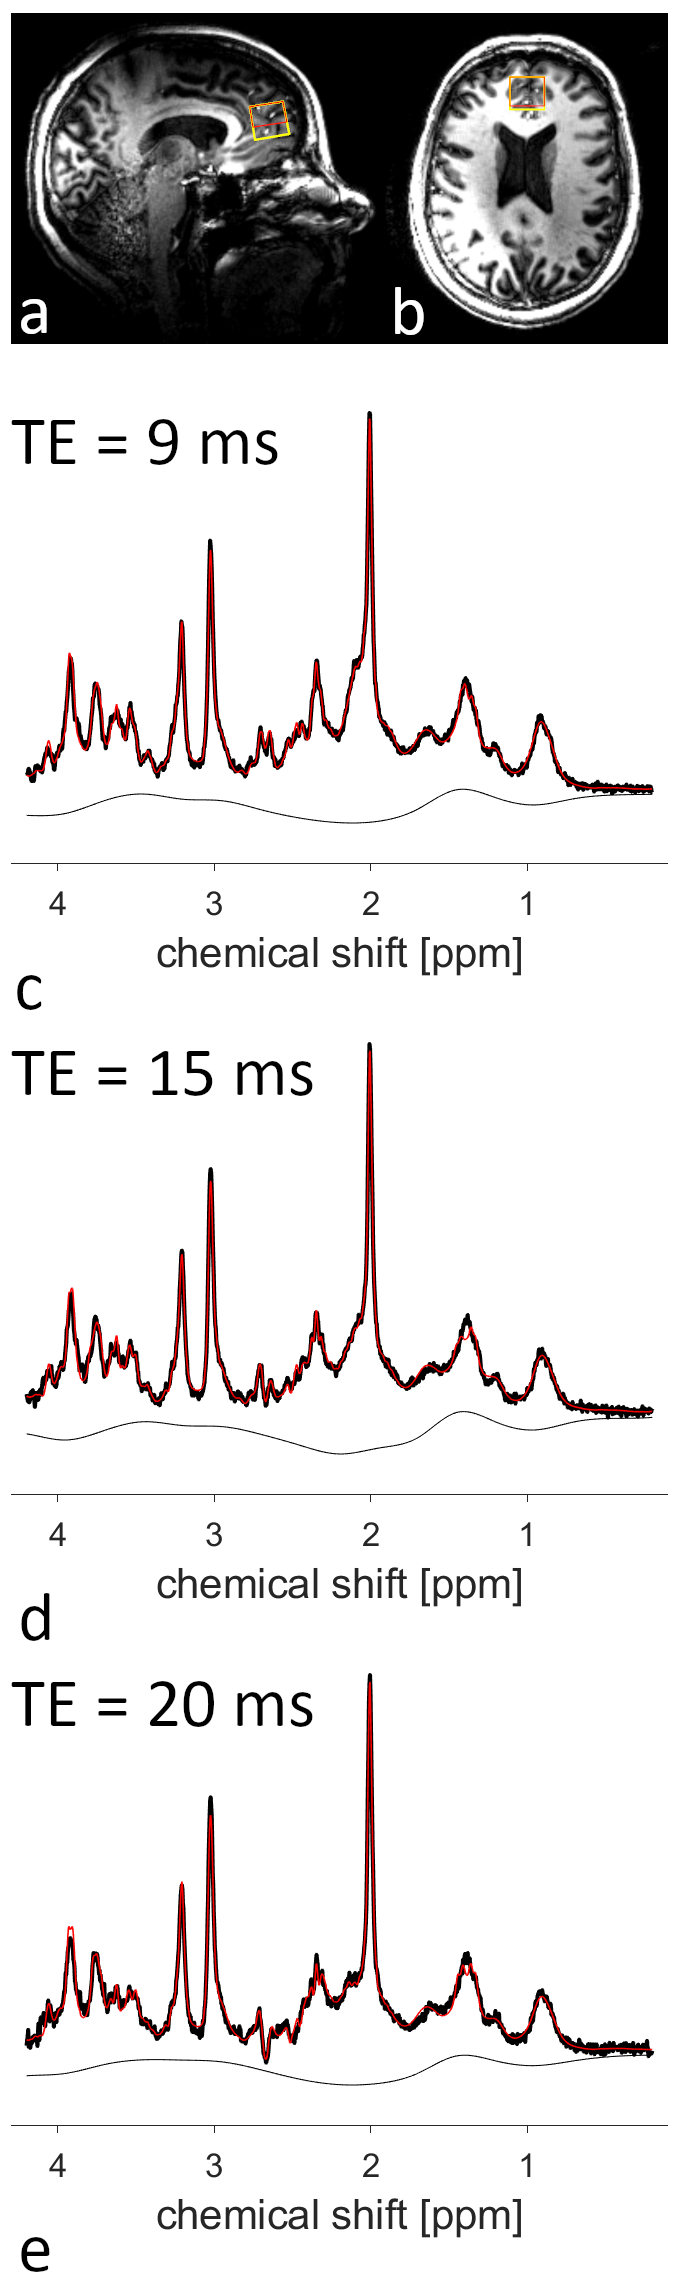
For each volunteer an MPRAGE (TE/TI/TR=2.31ms/900ms/2500ms, resolution: 1×1×1mm3, α=7°) image was acquired to position the voxel (20×20×20mm3) in the medial frontal cortex (Fig.2a,b). Subsequently, voxel-based power adjustment and 2nd-order B0 shimming was performed. The resulting linewidth was assessed with a short water scan. Whenever the water linewidth exceeded 20 Hz, the voxel extension in caudal direction was reduced by 8 mm (Fig.2a,b) and B0 shimming was repeated. Finally, MRS measurements were acquired at echo times (TE) of 9 ms, 15 ms, and 20 ms using SPECIAL9,10 (TR=8000ms, 128 averages, OVS interleaved with VAPOR water suppression). A reference water scan (4 averages) of the same voxel was acquired for each TE.
Analysis:
The MPRAGE image was segmented in SPM (Wellcome Trust Center for Neuroimaging, London, UK) to obtain the fractions of gray matter, white matter, and cerebrospinal fluid (CSF) within the measurement voxel.
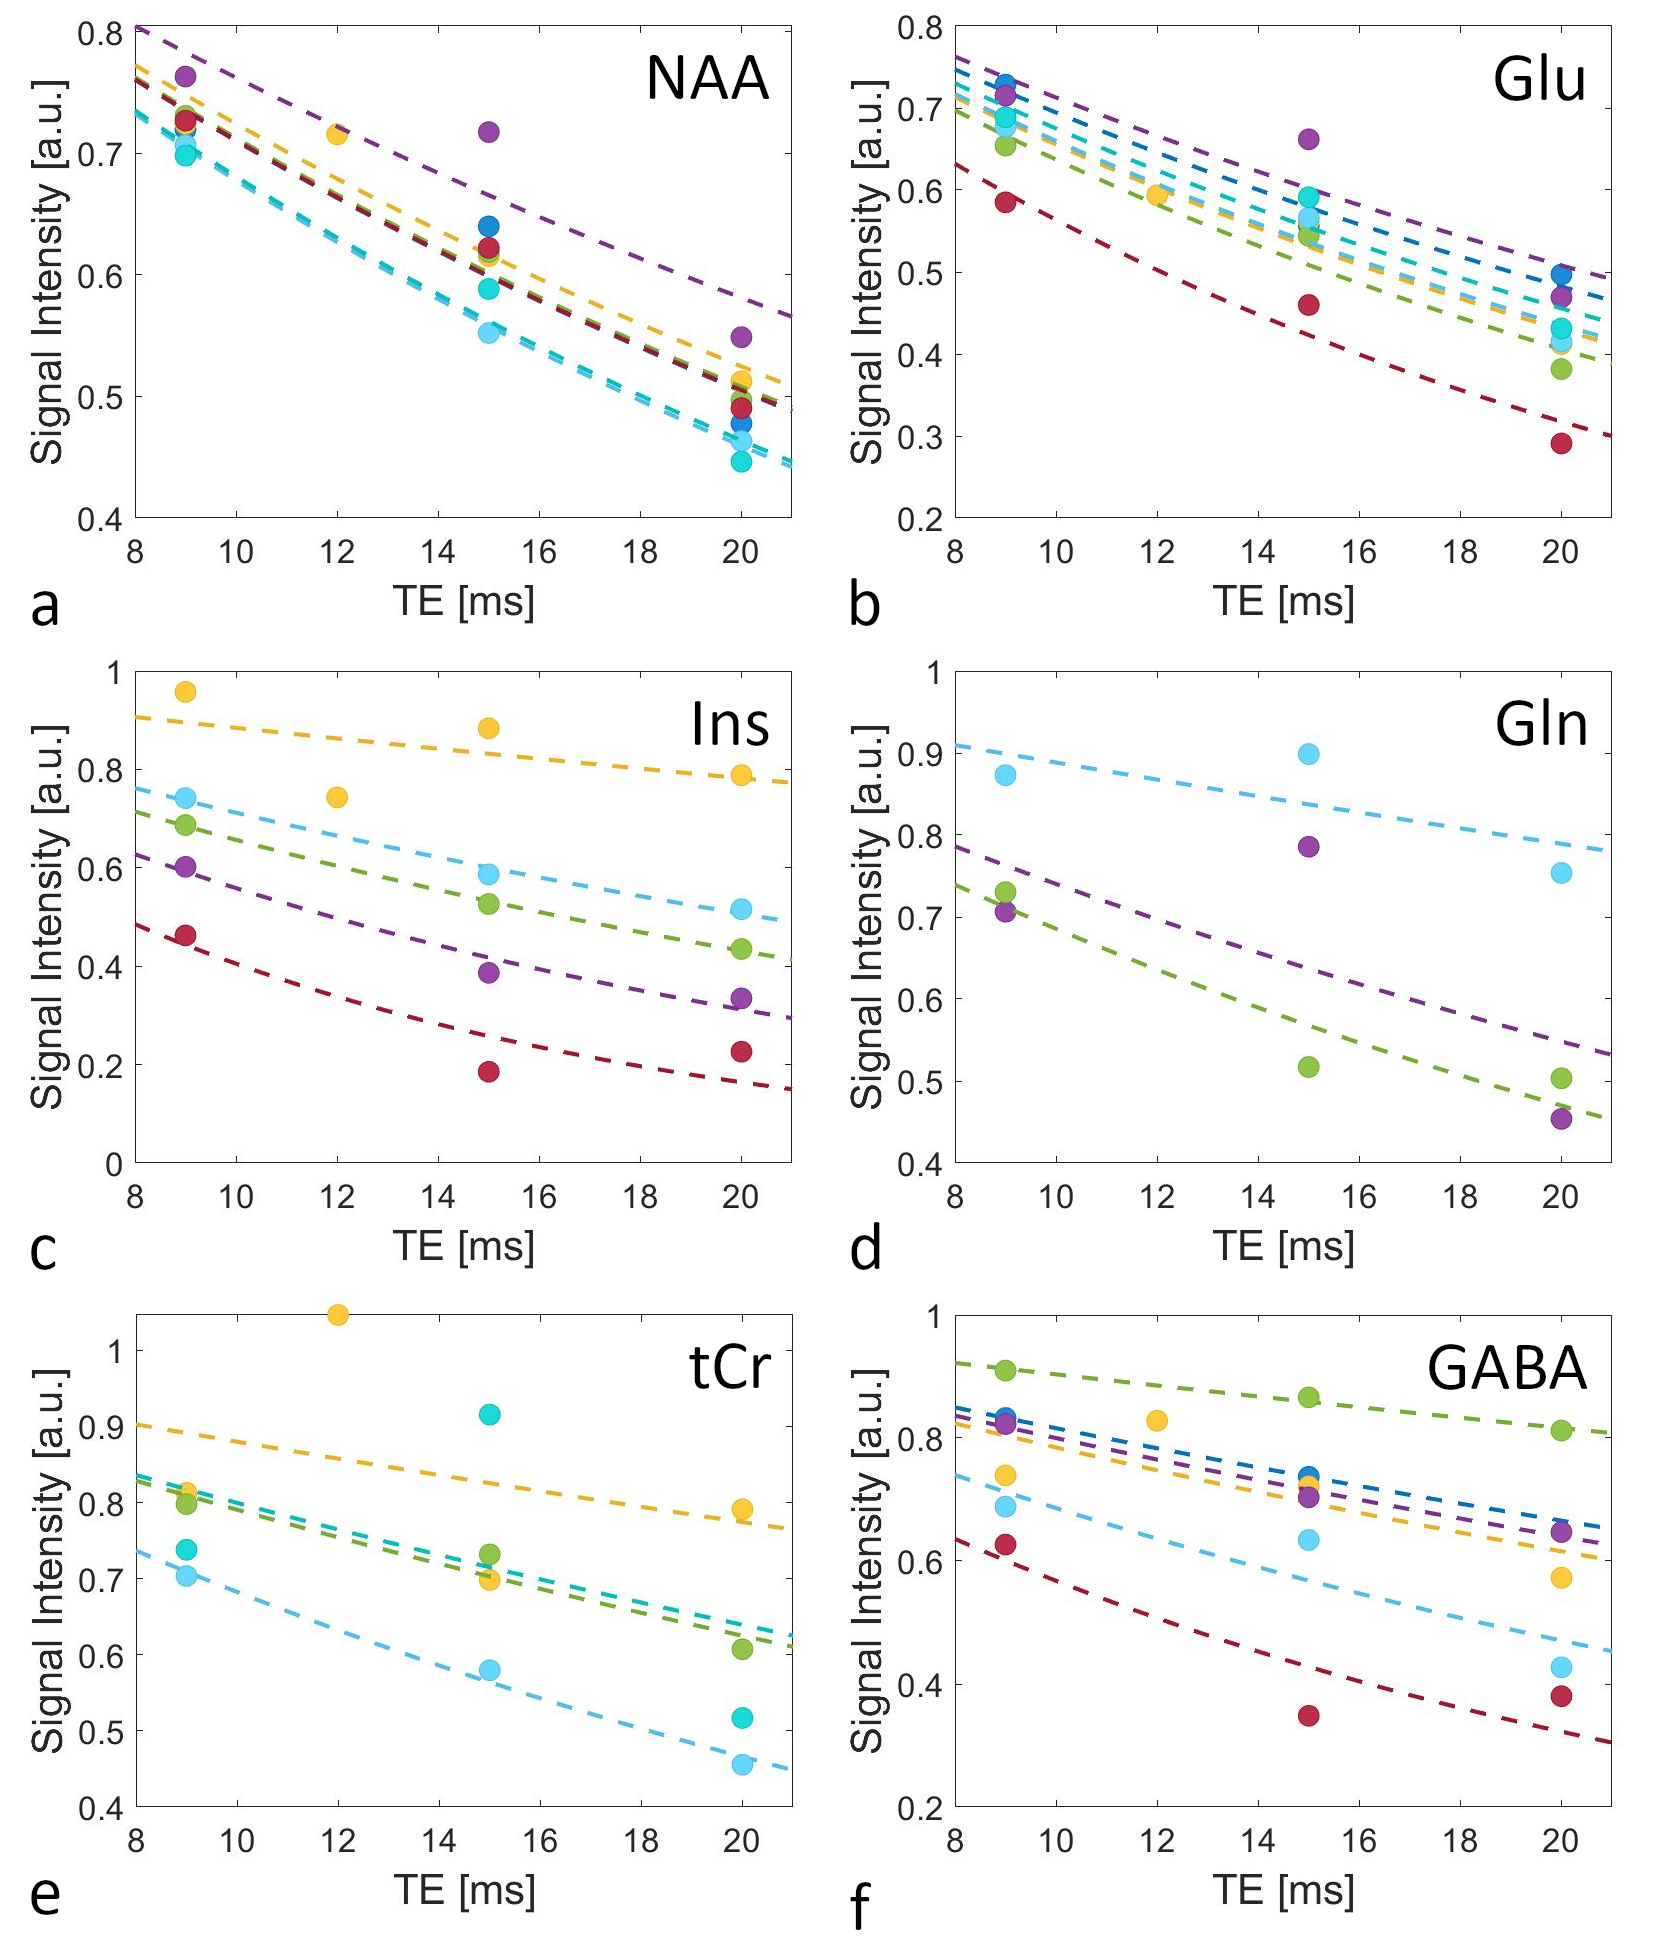
Coil combination, frequency correction, and averaging of all spectra was performed using an in-house written software in MATLAB (MathWorks, Natick, USA). The spectra were fitted with LCModel11 employing TE-specific basis sets generated in VeSPA12. Metabolite signals fitted with Cramér-Rao Lower Bounds (CRLBs) >20% were discarded from further analysis. The resulting metabolite fits were then integrated to obtain the signal intensity Sint,metab per metabolite and TE. Sint,water was calculated by signal integration without prior fitting. T2s for the different metabolites were then obtained by fitting
(1) Sint,metab=S0·exp(-TE/T2,metab)
to the resulting data.
Finally, the LCModel fits were repeated with an adjusted water attenuation parameter. Metabolite concentrations were corrected for CSF fraction in the voxel and metabolite relaxation. Mean and standard deviations (SD) were calculated for each T2,metab, and metabolite concentrations.
Results and Discussion
The coil design is illustrated in Figure 1a. B1 efficiency optimization for the frontal cortex yielded a phase difference of 70° between adjacent channels, breaking the symmetry between the coils at the back of the head. Simulations of the resulting B1 distribution in the Ella model are depicted in Figure 1b-d.Example spectra acquired at different TEs from one volunteer are displayed in Figure 2c-e. The efforts undertaken for B1 and B0 optimization allowed for high spectral quality from the medial frontal cortex, although in six out of seven volunteers the voxel size, and hence the SNR, had to be reduced.
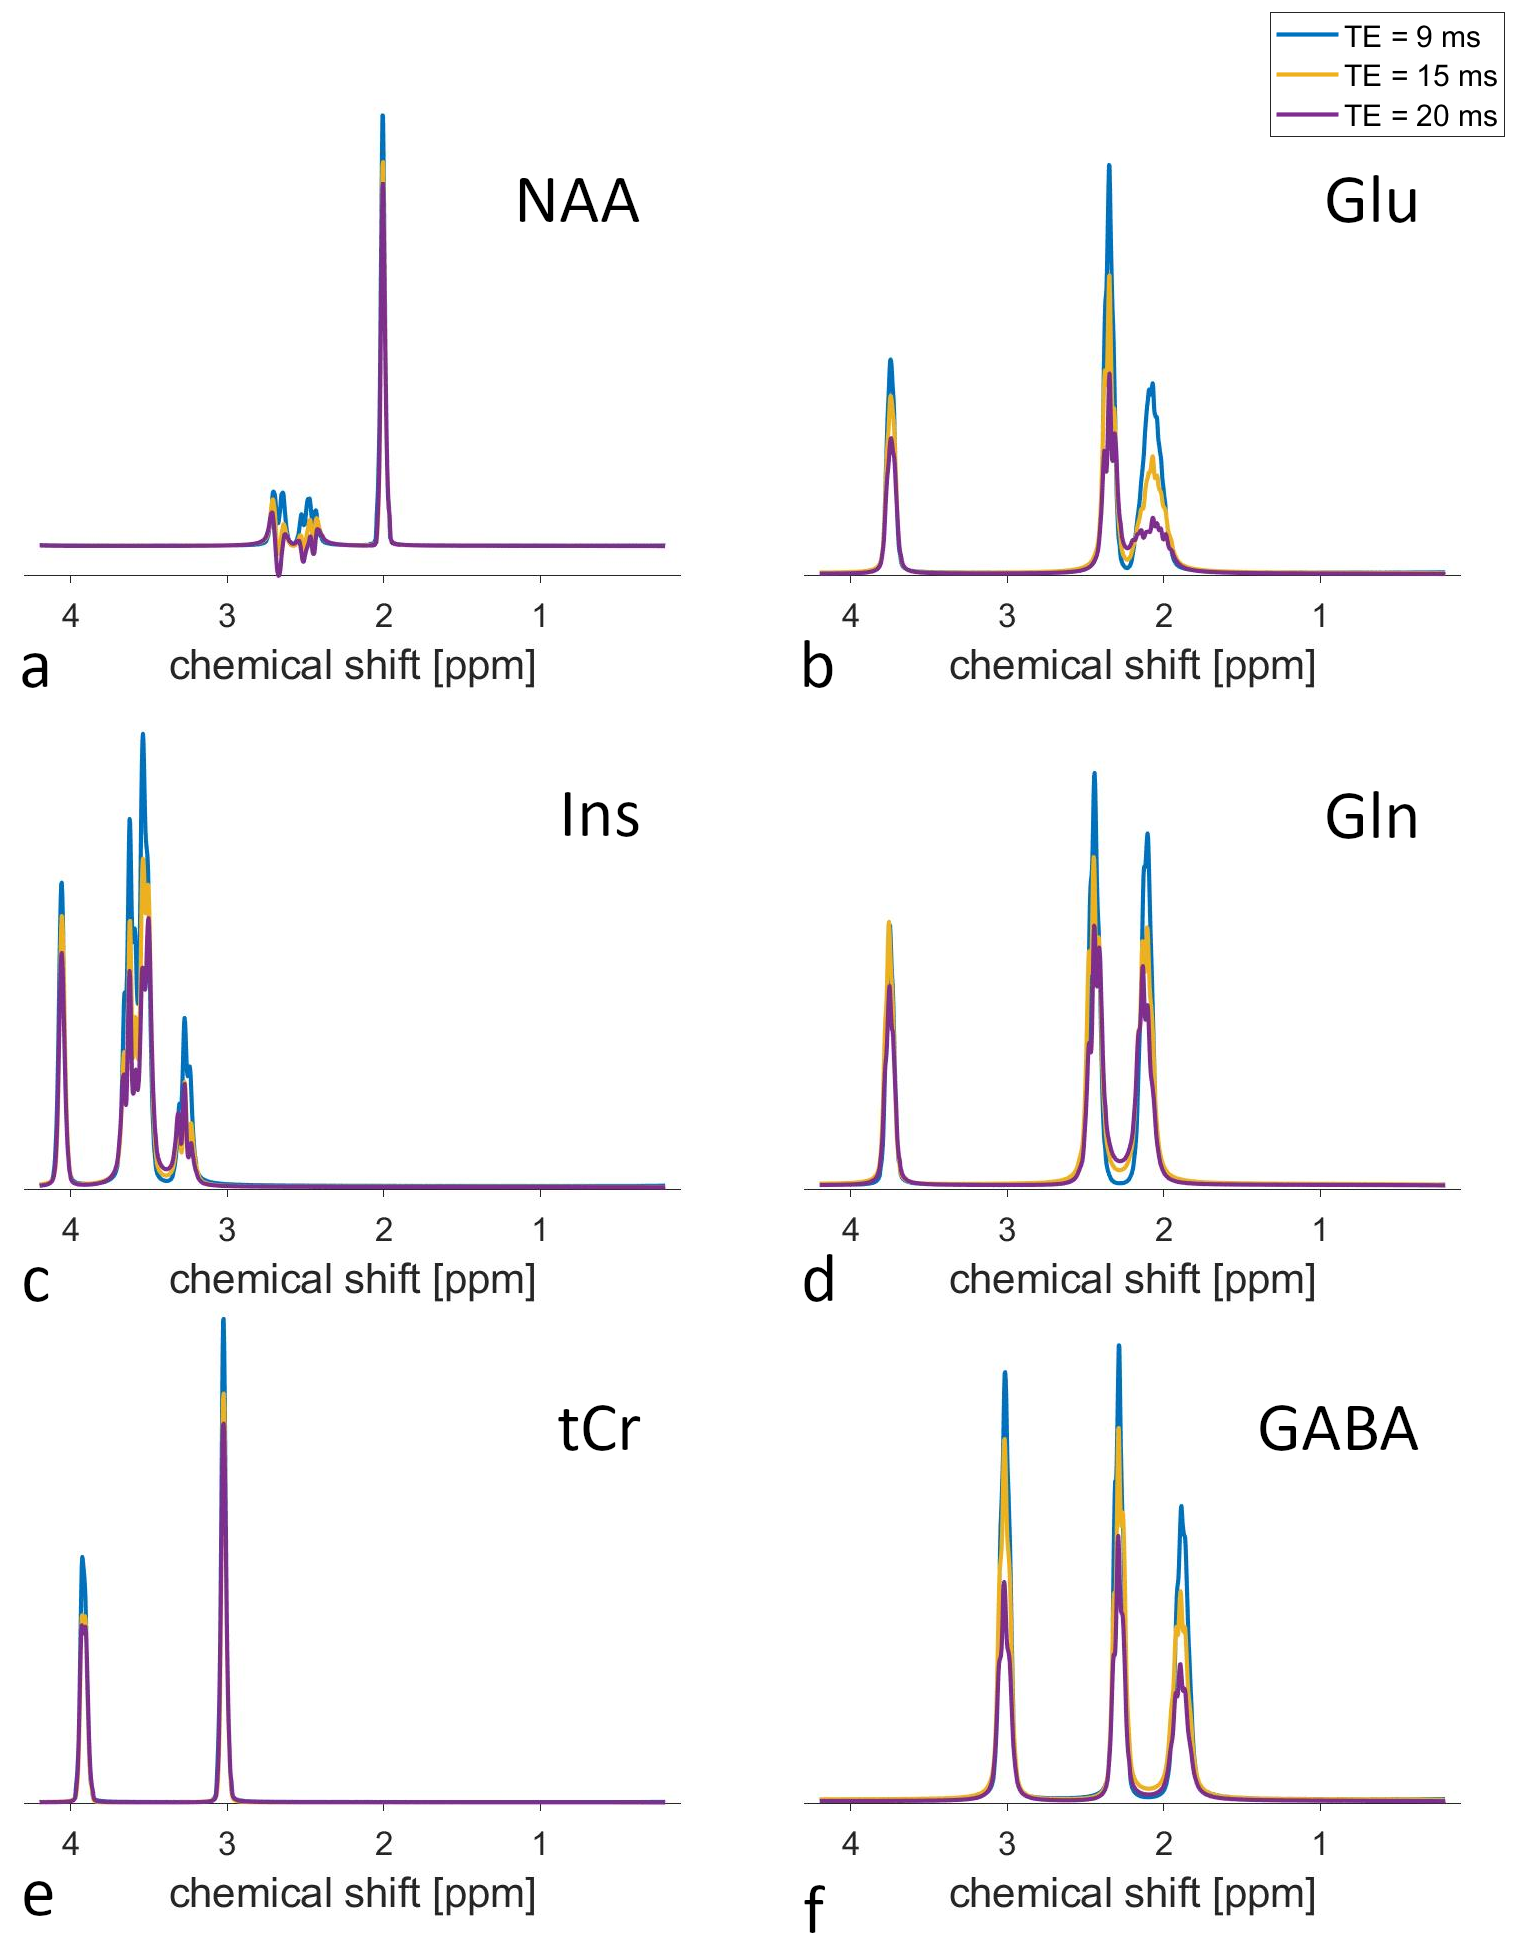
Figure 3 displays the fitted metabolite signals from one volunteer and different TEs. The loss of signal amplitude with increasing TE is clearly visible.
The determined Sint,metab are shown in Figure 4 (normalized to S0 for display purposes), along with the fits to calculate T2,metab. Especially for highly concentrated metabolites, such as N-acetyl aspartate (NAA) and glutamate (Glu), the derived T2s are very similar across volunteers, which is also obvious from the small SD of the mean T2s (Table 1). For myo-Inositol (Ins) and total creatine (tCr), however, T2 variations are larger. Increased noise near the water signal in some of the acquired spectra might compromise Ins quantification. Furthermore, while the signals of creatine and phosphocreatine can not be separated, the relaxation times of both metabolites might be different. The resulting bi-exponential decay may not be appropriately approximated by the mono-exponential model used, which is also reflected in the low R2 of the fits. While T2 of water is consistent with previous work, calculated metabolite T2s are notedly smaller than literature values from other brain regions13,14. One reason for this might be the low number of data points acquired over a small range of TEs in this study so far, which will have to be addressed in future work.
Conclusion
High-quality MR spectra were acquired in the notoriously difficult medial prefrontal cortex at 7T, by using an 8Tx/8Rx head coil with a dedicated phase shim, allowing to determine T2 values for 6 different metabolites.Acknowledgements
This work was supported by the DFG grant number: IT 7/8-1.References
[1] J. Gallinat, M. Bajbouj, T. Sander, P. Schlattmann, K. Xu, E.F. Ferro, D. Goldman, G. Winterer: “Association of the G1947A COMT (Val(108/158)Met) gene polymorphism with prefrontal P300 during information processing”, Biol Psychiatry 54(1): 40–48 (2003).
[2] D.R. Weinberger, R.K. McClure: “Neurotoxicity, neuroplasticity, and magnetic resonance imaging morphometry: what is happening in the schizophrenic brain?”, Arch Gen Psychiatry 59(6): 553–558 (2002)
[3] D.R. Weinberger: “Implications of normal brain development for the pathogenesis of schizophrenia”, Arch Gen Psychiatry 44(7): 660–669 (1987)
[4] M.E. Ladd, P. Bachert, M. Meyerspeer, E. Moser, A.M. Nagel, D.G. Norris, S. Schmitter, O. Speck, S. Straub, M. Zaiss: “Pros and cons of ultra-high-field MRI/MRS for human application”, Prog Nucl Mag Res Sp 109: 1-50 (2018)
[5] F. Seifert, H. Pfeiffer, R. Mekle, P. Waxmann, B. Ittermann: “7T 8-channel pTx head coil with high B1+ efficiency optimized for MRS”, Proc Int Soc Magn Reson Med 24: 3545 (2016)
[6] A. Christ, W. Kainz, E.G. Hahn, K. Honegger, M. Zefferer, E. Neufeld, W. Rascher, R. Janka, W. Bautz, J. Chen, B. Kiefer, P. Schmitt, H.-P. Hollenbach, J. Shen, M. Oberle, D. Szczerba, A. Kam, J.W. Guag, N. Kuster: “The Virtual Family—development of surface-based anatomical models of two adults and two children for dosimetric simulations”, Phys Med Biol 55(2): N23 (2009)
[7] J.P. Mugler III, J.R. Brookeman: “Three‐dimensional magnetization‐prepared rapid gradient‐echo imaging (3D MP RAGE)”, Magn Reson Med 15(1): 152-157 (1990)
[8] S. Nassirpour, P. Chang, A. Fillmer, A. Henning. "A Comparison of Optimization Algorithms for Localized in Vivo B0 Shimming". Magn Reson Med 79: 1145-1156 (2018)
[9] V. Mlynarik, G. Gambarota, H. Frenkel, R. Gruetter. "Localized Short-Echo-Time Proton MR Spectroscopy With Full Signal-Intensity Acquisition". Magn Reson Med 56: 956-970 (2006)
[10] R. Mekle, V. Mlynarik, G. Gambarota, M. Hergt, G. Krueger, R. Gruetter. "MR Spectroscopy of the Human Brain With Enhanced Signal Intensity at Ultrashort Echo Times on a Clinical Platform at 3T and 7T". Magn Reson Med 61: 1279-1285 (2009)
[11] S. W. Provencher. "Estimation of metabolite concentrations from localized in vivo proton NMR spectra". Magn Reson Med 30: 672-679 (2993)
[12] B.J. Soher, P. Semanchuk, K. Young, D. Todd: “Vespa–Simulation User Manual and Reference” (2011)
[13] M. Marjańska, E.J. Auerbach, R. Valabrègue, P.F. Van de Moortele, G. Adriany, M. Garwood: “Localized 1H NMR spectroscopy in different regions of human brain in vivo at 7 T: T2 relaxation times and concentrations of cerebral metabolites”, NMR Biomed 25(2): 332-339 (2012)
[14] Y. Li, D. Xu, E. Ozturk-Isik, J.M. Lupo, A.P. Chen, D.B. Vigneron, S.J. Nelson: “T1 and T2 metabolite relaxation times in normal brain at 3T and 7T”. J Mol Imaging Dynam S 1: 002 (2012)
Figures