2917
Diffusion MR spectroscopy at 7T with no water suppression is sensitive to measuring diffusion properties of metabolites in the corpus callosum1Aix-Marseille Université, CNRS, CRMBM, Marseille, France, 2APHM, Hôpital de la Timone, Pôle d’Imagerie Médicale, CEMEREM, Marseille, France, 3Brain and Spine Institute - ICM, Centre for NeuroImaging Research - CENIR, Paris, France, 4Siemens Healthineers SAS, Saint-Denis, France, 5Department of Radiology Leiden University Medical Center, Leiden, Netherlands
Synopsis
We implemented a diffusion-weighted semi-LASER single voxel spectroscopy sequence with no water suppression to measure mean diffusivity and fractional anisotropy within two volumes-of-interest in the corpus callosum. Without water suppression, we were able to decrease acquisition time and use the water signal for phase, frequency, and eddy current corrections. We measured the signal decay of N-acetylaspartate (tNAA), creatine (tCr), choline (tCho), and water to derive diffusion outcomes and compare between the two volumes-of-interest. Our implementation was done in feasible time for in vivo measurements. Further development can lead to more specific assessments of brain microstructure and pathophysiology.
Introduction
Diffusion-weighted 1H magnetic resonance spectroscopy (DW-MRS) is a noninvasive tool that measures diffusion properties of metabolites in addition to water protons. Since these metabolites are predominantly intracellular and cell-type specific, DW-MRS can lead to better, more specific characterizations of brain microstructure and physiology1. This technique suffers from a lack of sensitivity due to low signal-to-noise ratio (SNR) observed in spectroscopy. The use of ultra-high field MRI scanners (>= 7T) offers increased SNR but requires adapted sequences such as localization by adiabatic selective refocusing (LASER) or its variant semi-LASER, enabling better localization and better immunity to B1 inhomogeneities and cross-terms2. In this study, we implemented a DW semi-LASER single-voxel spectroscopy sequence while considering energy limitations. Therefore, we chose to not use water suppression (WS) to decrease acquisition time (limited by SAR restrictions) and benefit from the water signal for phase, frequency, and eddy current corrections. We tested the sensitivity of this approach in five healthy volunteers in 2 different regions of the corpus callosum (CC), the splenium (sCC) and the posterior body (pBCC), known to have different diffusion properties. The development and optimization of this technique at 7T aims at increasing the potential of DW-MRS to probe microstructural features of brain tissue.Methods
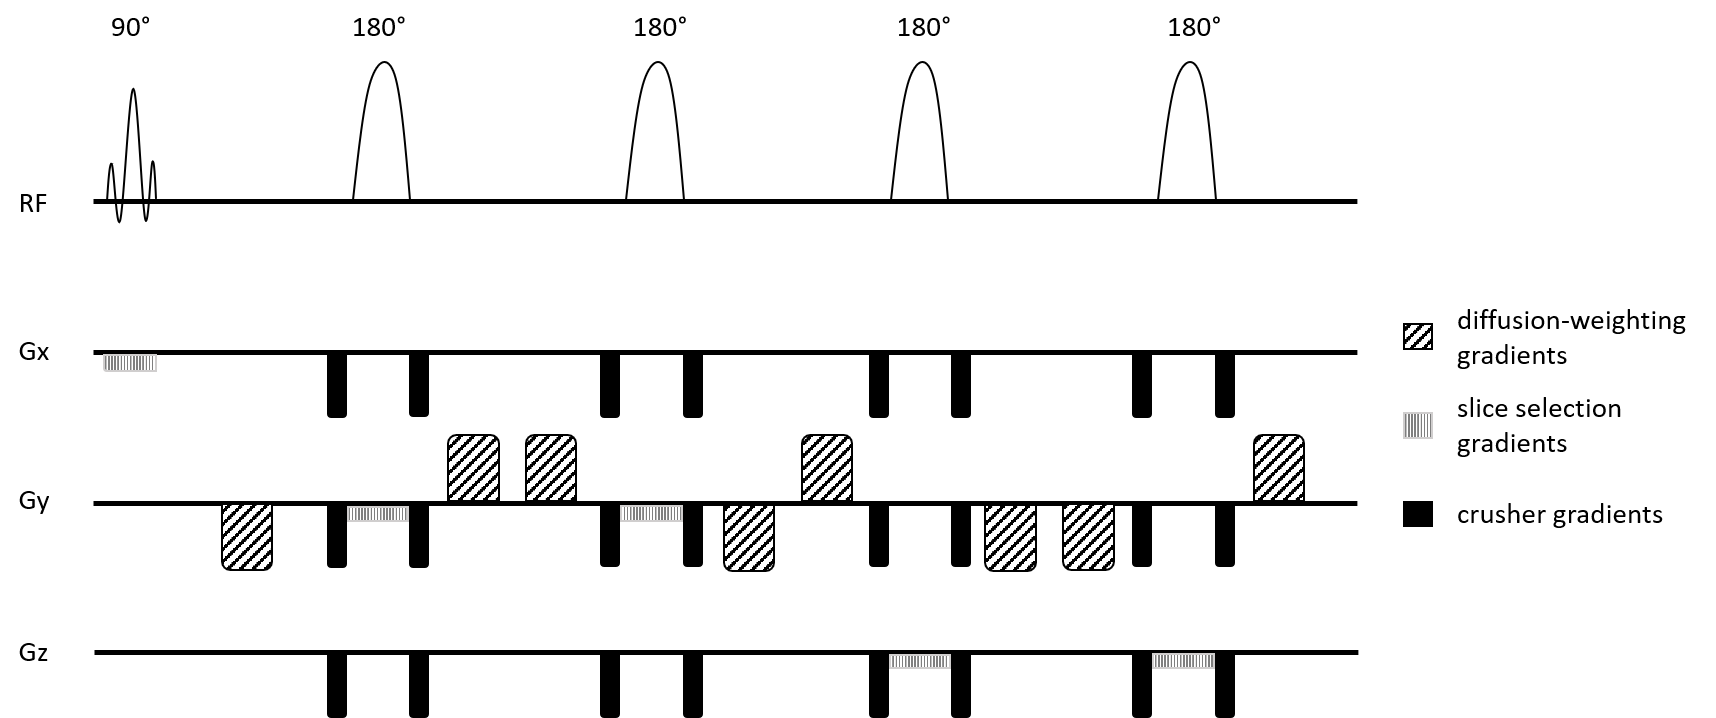
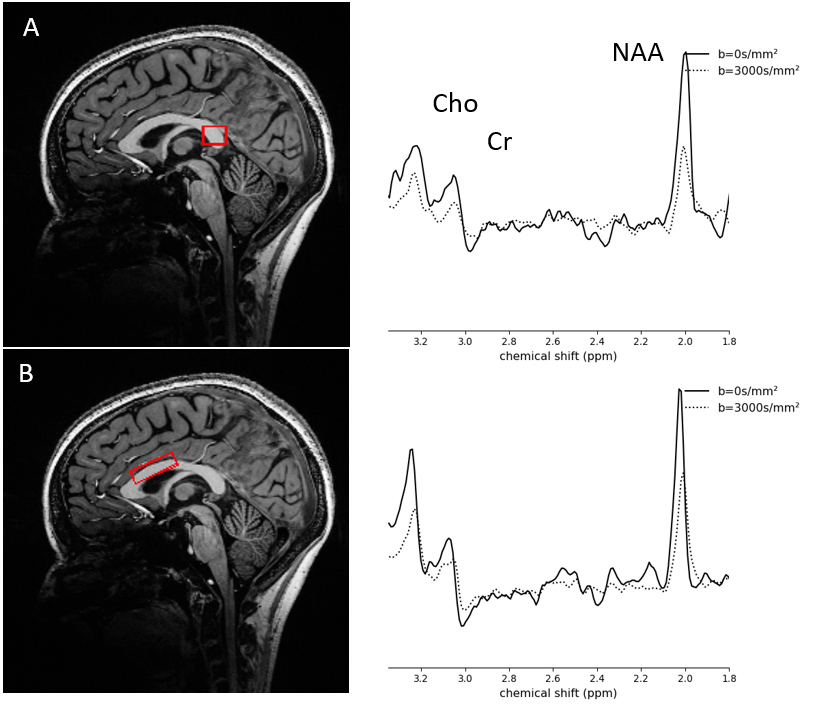
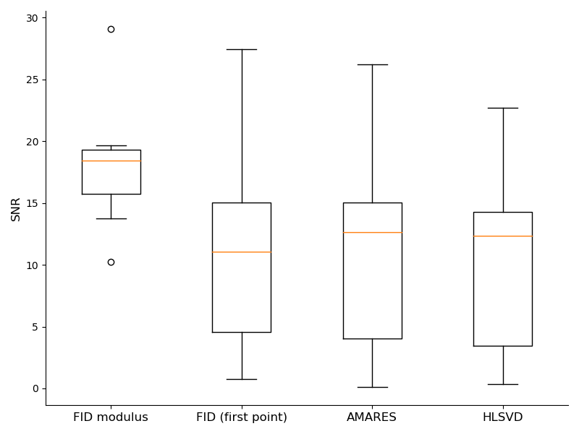
A semi-LASER sequence with bipolar diffusion gradients (Fig. 1) was implemented at 7T (Magnetom step 2, Siemens) using a 32-channel head coil (Nova) on 5 healthy volunteers (median age=27 (21-34), 2 females and 3 males). For each participant, measurements were performed within two volumes-of-interest (VOIs) (the sCC and the pBCC) (Fig. 2). The parameters of the DW semi-LASER sequence were the following: TE=135ms, TR=3-3.6s, pulse trigger with delay of 230ms, 32 repetitions, and acquisition time of 12-15 minutes. For diffusion sensitization, 2 b values (0 and 3000 s/mm2) with 6 directions of gradients (110,011,101,1-10,-101,01-1) were used. The VOI size was 1.5x1.5x1.2 cm3 in the sCC and 0.9x3.0x1.6 cm3 in the pBCC. No WS was used during the acquisition to allow shorter TR within SAR limits, thus decreasing scan time. During post-processing, we applied FID modulus3 to control for distortions such as sidebands created by the water signal. FID modulus calculates the modulus of the signal to correct for phase and frequency shift and eddy currents. We then combined the signals from each channel and averaged them across repetitions. HLSVD4 was used to remove the water signal before spectral fitting. We compared the SNR of the spectra between 4 different phase and frequency error correction methods: FID modulus, first point of the FID, AMARES, and HLSVD. Spectral quantitation for N-acetylaspartate (tNAA), creatine (tCr), choline (tCho), and water was performed using AMARES5. Fittings of diffusion decays of metabolites were conducted using simple linear regression, before computing mean diffusivity (MD) and fractional anisotropy (FA) for the two VOIs. For each metabolite, MD and FA were compared between the two VOIs using a Wilcoxon rank test.Results
The bipolar diffusion gradients in our sequence are commonly used to compensate for eddy-currents6. With the semi-LASER localization scheme, we addressed several common challenges associated with DW-MRS at ultra-high magnetic field including B1 inhomogeneities, cross-terms, and motion artifacts. In a phantom, we compared the use of non-WS data and WS with a reference non-WS scan and found similar SNR in the corrected spectra (p=0.08). Fig. 2 shows the diffusion-weighted spectra of one participant. The decrease in peak amplitude for tNAA, tCr and tCho is shown between b=0 and the maximum b value of 3000 s/mm². In Fig. 3, we compare the SNR between FID modulus and 3 other correction methods. FID modulus has a higher mean and smaller standard deviation compared to the other methods. The group averaged data for MD and FA are shown in Fig. 4. Interestingly, MD was higher in the sCC compared to the pBCC for tNAA (p=0.009) and for tCr (p=0.009), while the MD of tCho and water was equivalent between the two VOIs. In contrast, the FA values of metabolites and water appeared equivalent between the two structures.Discussion
The DW-semi-LASER sequence was implemented in feasible time for in vivo exploration and allowed for quantification of the signal attenuation of tNAA, tCr, tCho, and water. We did not use WS in our acquisition in order to use the water signal to correct for phase and frequency shift as well as save time during the acquisition. The use of non-WS data has been shown to bias diffusion outcomes7, however we were able to compensate for this bias by using FID modulus in the post-processing stage. This correction method was shown to bias the water signal by amplifying it, but to have little effect on the metabolite signals. We found that the mean MD and FA for tNAA, tCho, and tCr in the two voxels of the CC are within the range reported in the literature8-11. Also, as has been reported, the FA for the metabolites is higher than the FA for water because they are generally more confined to the intracellular environment than water molecules.Conclusion
Further development and optimization of this technique can lead to assessments of early biomarkers of neurodegeneration and astroglial activation.Acknowledgements
Neuroschool PHD program at Aix-Marseille UniversityReferences
1.Palombo, M., Shemesh, N., Ronen, I., & Valette, J. (2018). Insights into brain microstructure from in vivo DW-MRS. NeuroImage, 182, 97–116.
2. Valette, J., Giraudeau, C., Marchadour, C., Djemai, B., Geffroy, F., Ghaly, M. A., … Lethimonnier, F. (2012). A new sequence for single-shot diffusion-weighted NMR spectroscopy by the trace of the diffusion tensor. Magnetic Resonance in Medicine, 68(6), 1705–1712.
3. Le Fur, Y., & Cozzone, P. J. (2014). FID modulus: a simple and efficient technique to phase and align MR spectra. Magma (New York, N.Y.), 27(2), 131–148.
4. Pijnappel, W. W. F., van den Boogaart, A., de Beer, R., & van Ormondt, D. (1992). SVD-based quantification of magnetic resonance signals. Journal of Magnetic Resonance (1969), 97(1), 122–134.
5. Vanhamme, null, van den Boogaart A, null, & Van Huffel S, null. (1997). Improved method for accurate and efficient quantification of MRS data with use of prior knowledge. Journal of Magnetic Resonance (San Diego, Calif.: 1997), 129(1), 35–43.
6. Branzoli, F., Ercan, E., Webb, A., & Ronen, I. (2014). The interaction between apparent diffusion coefficients and transverse relaxation rates of human brain metabolites and water studied by diffusion-weighted spectroscopy at 7 T. NMR in Biomedicine, 27(5), 495–506.
7. Döring, A., Adalid, V., Boesch, C., & Kreis, R. (2018). Diffusion-weighted magnetic resonance spectroscopy boosted by simultaneously acquired water reference signals. Magnetic Resonance in Medicine, 80(6), 2326–2338.
8. Branzoli, F., Ercan, E., Valabrègue, R., Wood, E. T., Buijs, M., Webb, A., & Ronen, I. (2016). Differentiating between axonal damage and demyelination in healthy aging by combining diffusion-tensor imaging and diffusion-weighted spectroscopy in the human corpus callosum at 7T. Neurobiology of Aging, 47, 210–217.
9. Ronen, I., Ercan, E., & Webb, A. (2013). Axonal and glial microstructural information obtained with diffusion-weighted magnetic resonance spectroscopy at 7T. Frontiers in Integrative Neuroscience, 7.
10. Ellegood, J., Hanstock, C. C., & Beaulieu, C. (2010). Considerations for measuring the fractional anisotropy of metabolites with diffusion tensor spectroscopy. NMR in Biomedicine, 24(3), 270–280.
11. Wood, E. T., Ronen, I., Techawiboonwong, A., Jones, C. K., Barker, P. B., Calabresi, P., … Reich, D. S. (2012). Investigating axonal damage in multiple sclerosis by diffusion tensor spectroscopy. The Journal of Neuroscience: The Official Journal of the Society for Neuroscience, 32(19), 6665–6669.
Figures