2916
Reproducibility of Auditory Functional Magnetic Resonance Spectroscopy at 7T1Radiology, Brigham and Women's Hospital, Boston, MA, United States, 2Psychiatry, Beth Israel Deaconess Medical Center, Boston, MA, United States, 3Psychiatry, Veterans Affairs Boston Healthcare System, Boston, MA, United States
Synopsis
This work describes a methodology to perform reproducible functional MR spectroscopy (FMRS) experiments to study auditory processing at 7T. A processing pipeline and quality control steps are proposed to remove distortions and temporal instabilities in the dynamic experiment. The designed experiment was successfully tested, producing highly correlated results in healthy volunteers and patients with schizophrenia scanned multiple times.
Introduction
7T provides increased sensitivity and spectral dispersion that enables Functional MR Spectroscopy (FMRS) to detect dynamic changes in metabolite concentrations in the brain under specific functional tasks with high temporal resolution. The study of auditory and attentional processes in the brain is of great interest for applications in psychiatry, such as schizophrenia, where abnormalities in these processes have been shown to be prominent1. In terms of brain region involvement, the superior temporal gyrus (STG) supports both auditory and attentional processes and is implicated in the pathogenesis of schizophrenia2,3. Furthermore, MRS studies have shown metabolic abnormalities in this brain region such as abnormal glutamate (Glu) and N‑acetyl‑aspartate (NAA), which suggests a correlation with neuro-metabolic processes in the brain that can be studied using FMRS. Experiments performed at 7T have successfully detected changes in metabolite concentrations in both visual and auditory paradigms4,5. Crucial elements of these measurements that allow reliable and reproducible results are high B0-homogeneity, negligible B0-drifts, effective water suppression, reduced eddy currents, and negligible patient motion. This work presents an improved FMRS methodology to investigate metabolic changes in the auditory cortex with improved sensitivity at 7T. An acquisition protocol for the evaluation of both sensory and attentional tasks was designed and the steps to perform quality control on the data are detailed. Furthermore, the reproducibility of these experiments was evaluated in both healthy and patient populations.Methods
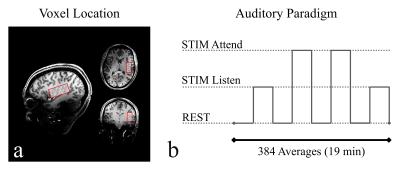
Data acquisition: The FMRS auditory experiment (Fig.-1) was performed in 9 healthy controls (HC) and 7 patients with schizophrenia (SCZ) at 7T (Terra; Siemens, Erlangen, Germany). A 20x40x20mm3 (16mL) volume located on the left superior temporal gyrus (LSTG) was acquired using STEAM localization, and the following parameters: TE/TR=20/3000ms, TM=10ms, 384 signal averages during the full experiment, and a total acquisition time of 19 min.Auditory FMRS Paradigm: The FMRS auditory paradigm (Fig.-1b) consisted of four blocks of STIM frequent (STIM‑Listen), four blocks of STIM‑Attend and four blocks with no stimulus (REST), each of 48 averages. In the STIM-Listen blocks, 1 kHz pure tones were presented to the subject, in STIM-Attend blocks, 2‑kHz pure tones added (30%) among the 1kHz frequent tones (70%). Subjects were asked to keep eyes open during the entire experiment and to silently count the number of 2‑kHz tones per STIM‑Attend block.
Data Processing and Quantification: The processing pipeline was implemented in python using OpenMRSLab6 and included the following steps applied to each signal average: (1) coil combination, (2) frequency alignment to water, (3) zero-order phase removal, (4) frequency alignment using the water signal as reference (5) water removal of using HSVD, (6) frequency alignment to NAA, (7) zero-order phase removal, and (8) combination of averages to obtain one spectrum per block. The reconstructed spectra corresponding to each block were fitted using LCModel7 with a custom basis set for 7T.
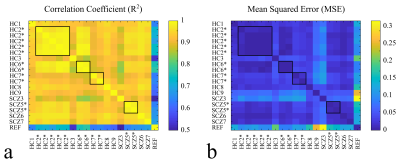
Reproducibility Experiments: Three HC and one SCZ were scanned multiple times following the same paradigm. The reproducibility was evaluated using correlation coefficient (R2) and mean squared error (MSE) between all the quantified metabolites in the 8 blocks of the paradigm. Additionally, quality control was performed on all the measured subjects using SNR reported from LCModel, FWHM measured from the NAA singlet at 2.01ppm, and Cramer-Rao Lower Bounds (CRLB) of the quantified metabolites.
Results and Discussion
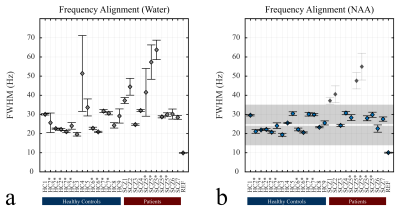
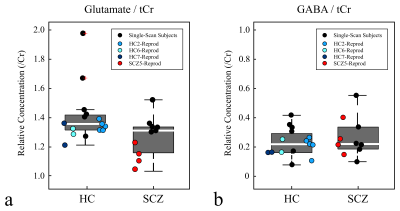
The improvement in linewidth (FWHM) when NAA is used as a reference for the frequency alignment instead of the water peak is presented (Fig.-2). This allows for defining a proper FWHM range based on the mean of μ=26.4 Hz and a standard deviation of σ=4.3 Hz for the inclusion of scans with good B0‑homogeneity throughout the experiment (Fig.-2b). Furthermore, the baseline concentration ratios to total creatine (tCr) of two metabolites of interest glutamate (Glu) and gamma‑aminobutyric acid (GABA) are shown in comparison to the range of concentration ratios obtained for all the subjects (Fig.-3). A larger variation was observed for the scanned SCZ in comparison with the HC. Finally, the cross-correlation across all the FMRS scans was computed showing a maximum R2 value (>0.95) for scans of the same subject performed on the same session (Fig.-4a). Similarly, a minimum MSE was obtained for the reproducibility scans (Fig.-4b).Conclusion
This work presents a reliable methodology to achieve high reproducibility in FMRS experiments at 7T. The reproducibility was evaluated with data quality control steps based on SNR, FWHM and CRLB and processing techniques were proposed to improve detection and assessment of subject‑ and system‑related instabilities in the measurements. These results establish a reference for FMRS experiments that aim to study the auditory process in psychiatric conditions like schizophrenia.Acknowledgements
No acknowledgement found.References
[1] Taylor SF, et al. GABA abnormalities in schizophrenia: A methodological review of in vivo studies. Schizophr Res. (2015).
[2] Javitt DC, et al. Auditory dysfunction in schizophrenia: integrating clinical and basic features. Nat Rev Neurosci. (2015).
[3] Niznikiewicz MA, et al. Neurobiological approaches to the study of clinical and genetic high risk for developing psychosis. Psychiatry Res. (2019)
[4] Bednařík P, et al. Neurochemical and BOLD responses during neuronal activation measured in the human visual cortex at 7 Tesla. Journal of Cerebral Blood Flow & Metabolism (2015)
[5] Coello E. et al. Functional Magnetic Resonance Spectroscopy of the Sensory and Attentional Auditory Processing at 7T. ISMRM (2019).
[6] Rowland B, et al. An open-source software repository for magnetic resonance spectroscopy data analysis tools. ISMRM MR Spectroscopy Workshop (2016).
[7] Provencher S. W. Automatic quantitation of localized in vivo 1H spectra with LCModel. NMR in Biomedicine 14, 260–264 (2001).
Figures


