2915
Examination of methods to optimize Glutamate-Glutamine separation at 3T1Department of Radiology, University of Calgary, Calgary, AB, Canada, 2Hotchkiss Brain Institute, Calgary, AB, Canada, 3Alberta Children's Hospital Research Institute, Calgary, AB, Canada, 4Douglas Mental Health Institute, Centre d’Imagerie Cerebrale, Montreal, QC, Canada
Synopsis
Separating glutamate (Glu) from its precursor, glutamine (Gln) at 3T is challenging due to signal overlap. Multiple sequence optimisations have been suggested, with simulated data used to assess accuracy. Here, using 7T data as a reference, we investigate the ability of four PRESS sequences with different echo times of separating Glu and Gln. We found that Glu measured at 3T using TE=20ms shows the highest agreement with 7T data. Gln measured using TE=20ms, 30ms and 40ms all agree with Gln measured at 7T. Therefore, we conclude PRESS with TE=20ms is the most effective at separating and quantifying Glu and Gln.
INTRODUCTION
Separation of glutamate (Glu) and its precursor glutamine (Gln) is a long-standing issue for proton magnetic resonance spectroscopy at 3T. Due to their similar chemical structure, the Glu and Gln resonances overlap at 3T, subsequently they are often reported in combination as GLX. However, this approach masks the individual concentration levels, and the cycling between the two. Furthermore, Gln also provides the carbon backbone of GABA; reporting Gln as solely contributing to glutamatergic mechanisms may misrepresent on-going metabolic processes. Importantly, this may obscure alterations in glutamatergic processes which may occur in disease.Multiple sequence optimizations to differentiate Glu and Gln have been suggested,1 most of which use echo time (TE) optimization approaches. However a consensus of a generally implemented approach has not been reached. This is partially due to the gap between simulated and in vivo data. Simulations provide a known value for comparison, however there are numerous variables affecting in vivo data which are often unaccounted for. In vivo data have the disadvantage of unknown values, making it impossible to determine accuracy. At 7T, Glu and Gln are more easily resolved than at 3T,2 which provides a more accurate estimate of the ground truth.
This project compares in vivo data from four 3T PRESS acquisitions with different TEs (the most widely available and implemented MRS localization method), with a 7T acquisition as the reference standard to determine the most effective method for separation of Glu and Gln at 3T.
METHODS
Ten healthy participants (18-40 y) underwent two imaging sessions, one at 3T (Siemens Prisma) and one at 7T (Siemens Terra). The sessions took place within 3 days at approximately the same time of day and the session order was counterbalanced. Each session began with a T1-weighted image for voxel placement and segmentation. 2.5x2.5x2.5cm3 voxels were placed in the parietal cortex centred on the midline. At 3T, four PRESS acquisitions were performed (TR = 2000ms, 128 averages) with the following echo times: 20ms (PRESS20), 30ms (PRESS30), 40ms (PRESS40) and 80ms (PRESS80). At 7T, an optimized STEAM acquisition was performed (TE/TR/TM=8/6000/40ms, 64 averages).Data were preprocessed using FID-A3 and analysed using LCModel4, using customized basis sets developed using FID-A. Tissue corrected, water referenced metabolite concentrations were estimated in molal units.5 The agreement between Glu and Gln acquired at 3T and 7T was assessed using Pearson’s correlations, Bland-Altman plots and intraclass correlation coefficients (ICC), ICC 95% confidence interval (CI) values above 0.5 were considered in agreement.10
RESULTS
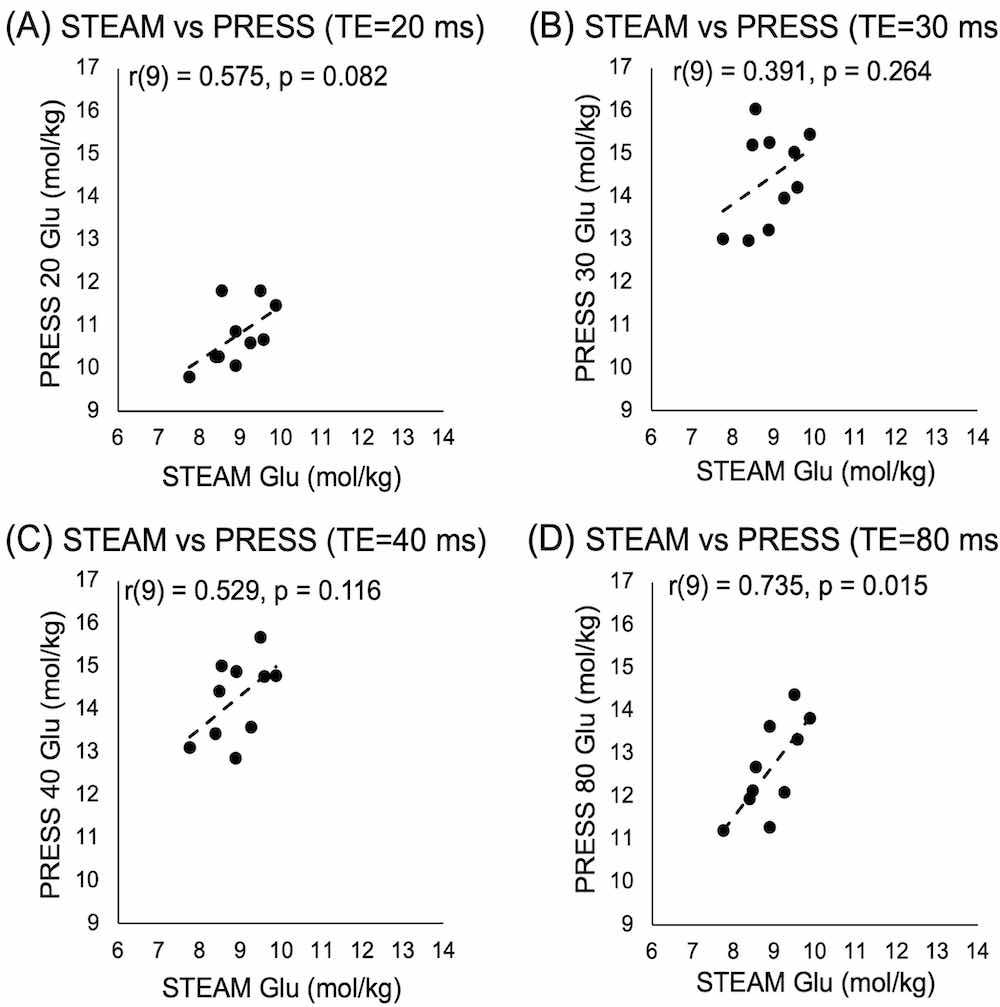
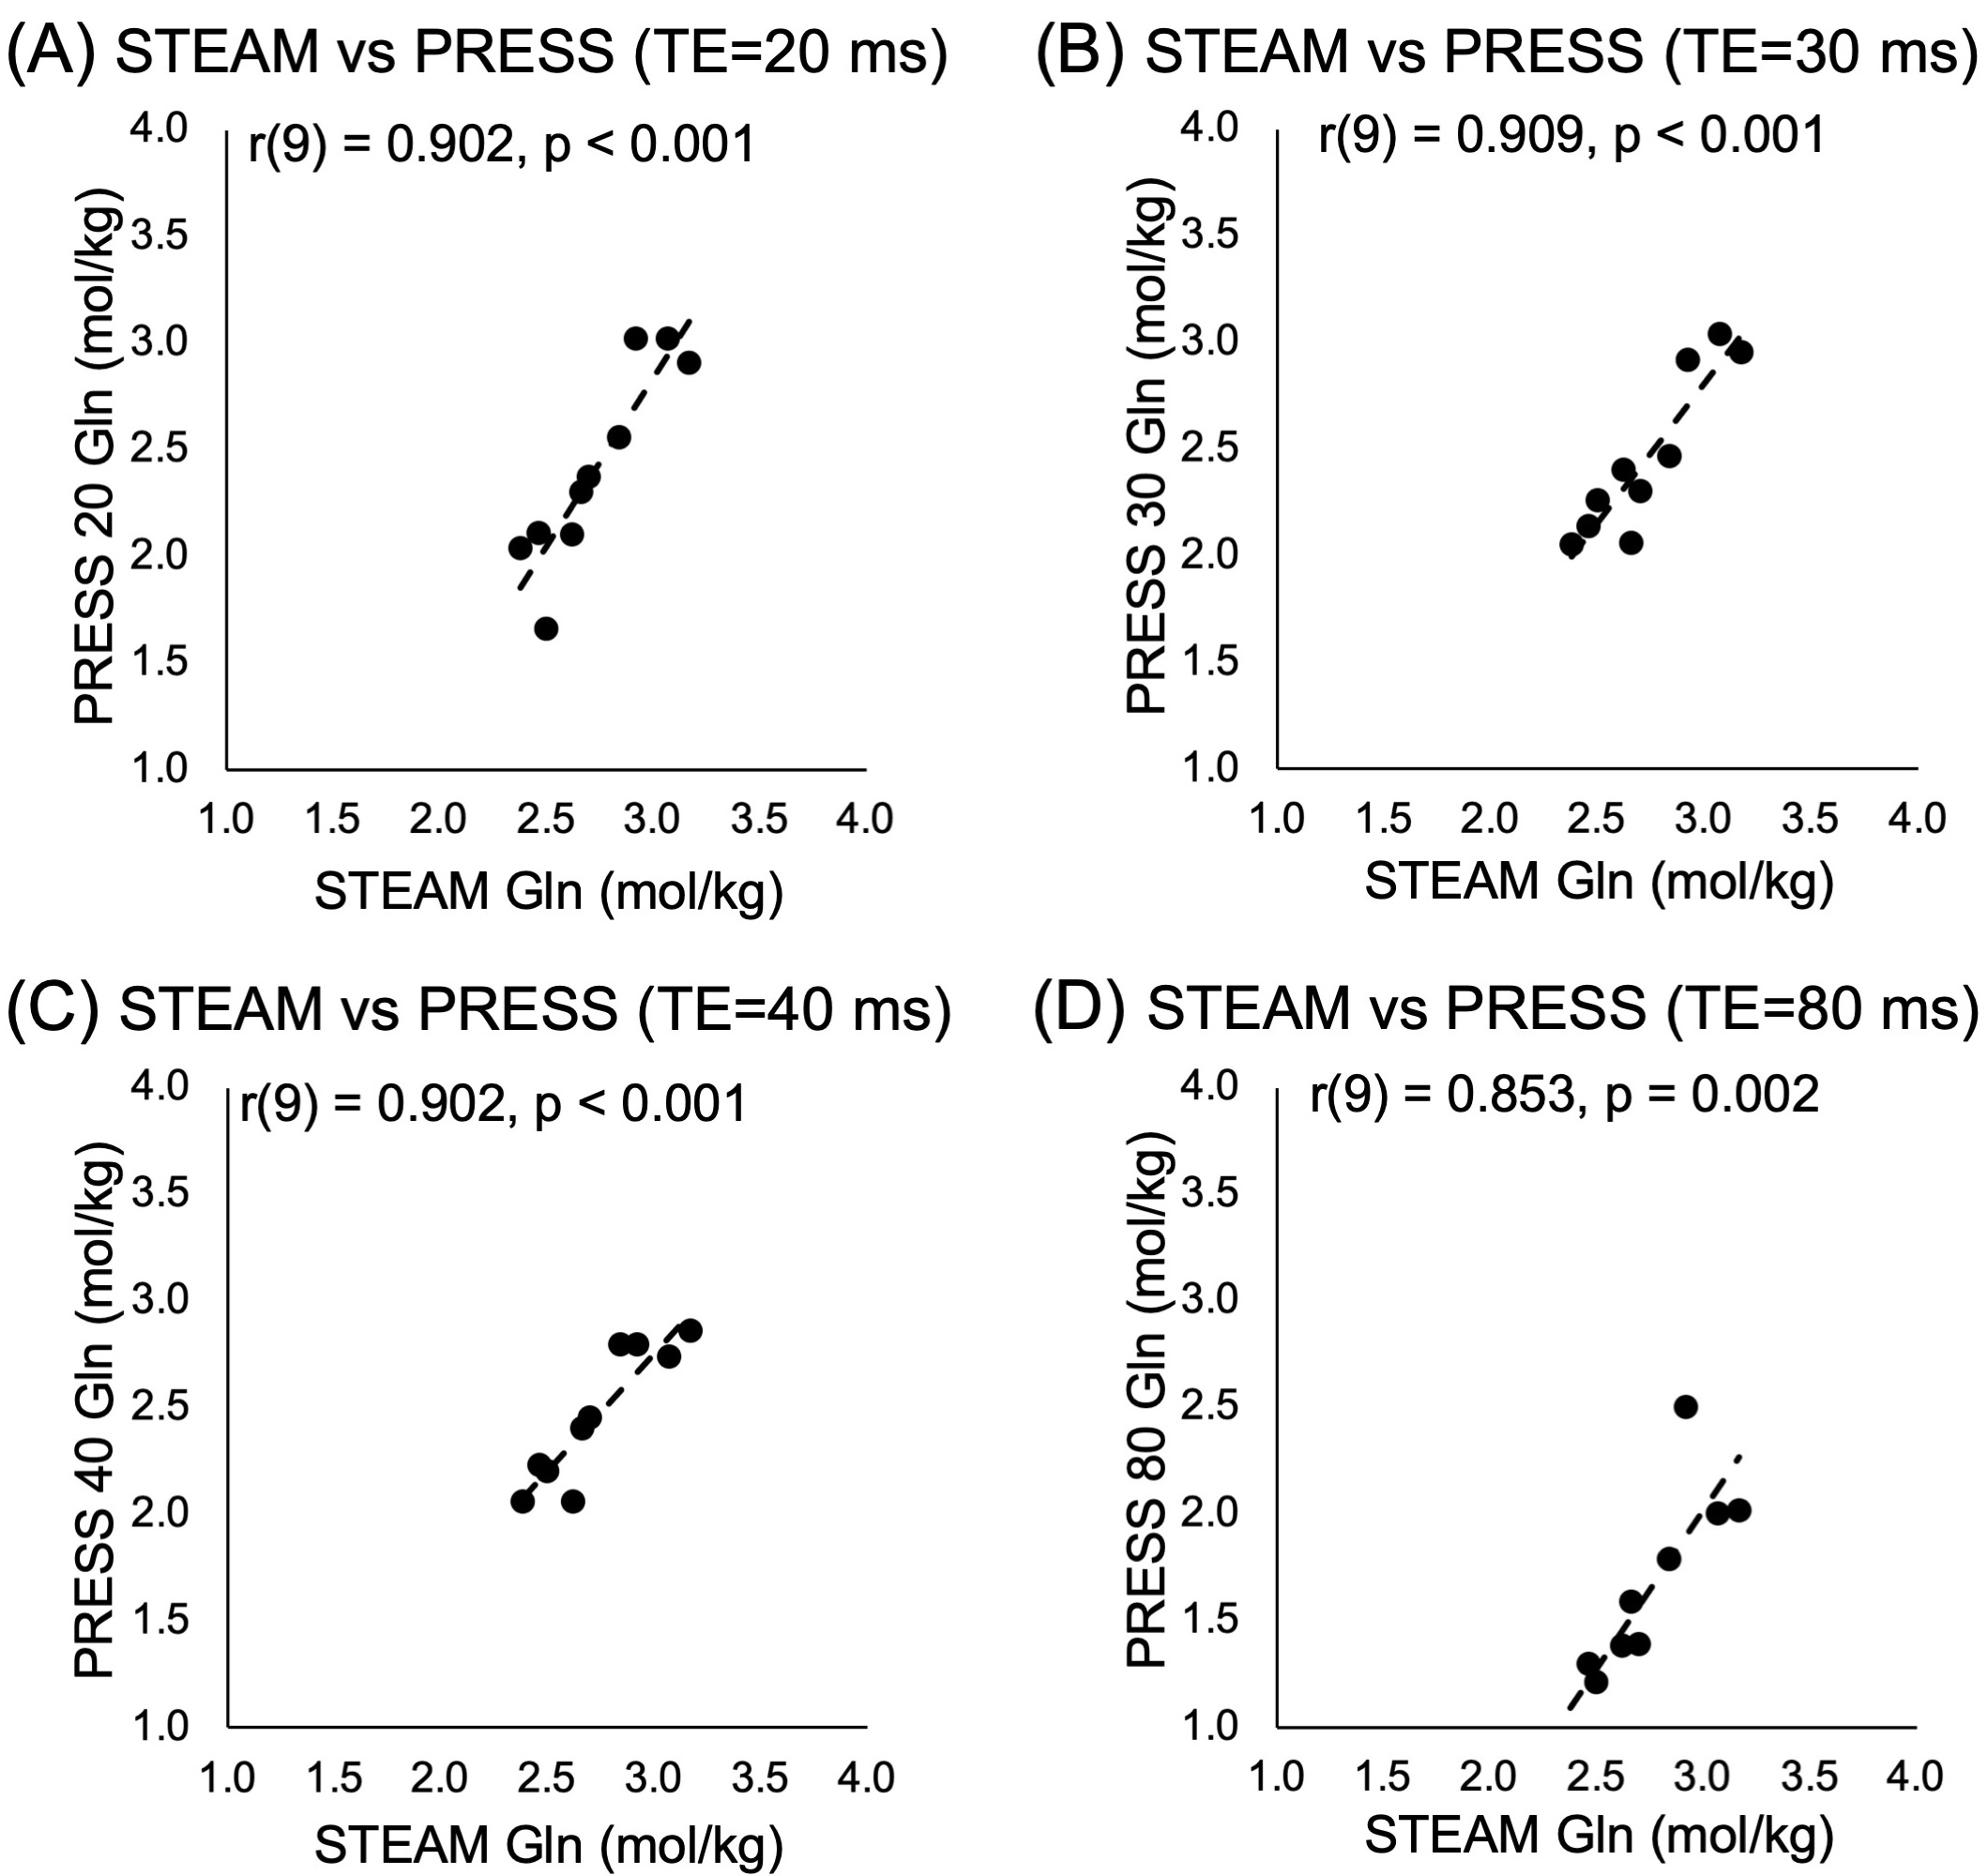
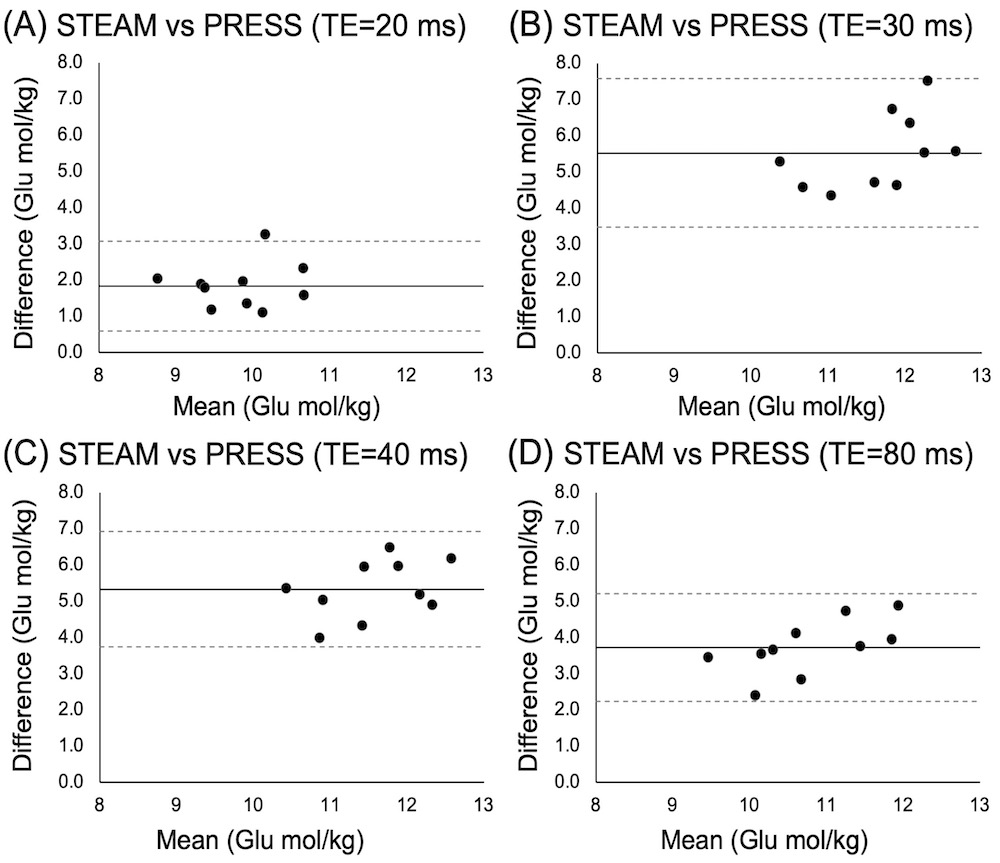
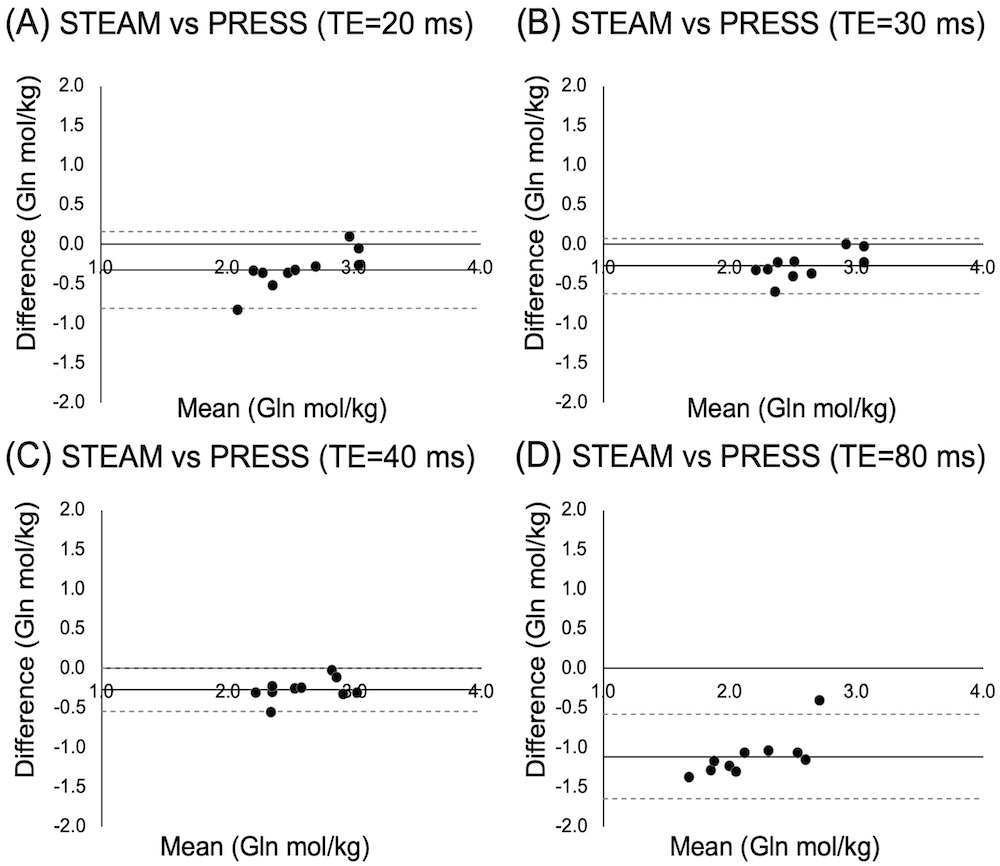
All data were of good quality (Glu max CRLB=4, Gln max CRLB=28). Of the four correlations between 3T PRESS and 7T Glu, only PRESS80 Glu data significantly correlated with 7T data, though a trend exists between PRESS20 and 7T Glu (Figure 1).All PRESS measures of Gln correlated with 7T measures (Figure 2). Bland-Altman plots show all PRESS Glu measures were systematically higher than 7T Glu. The smallest bias was seen in PRESS20 (Figure 3). Only PRESS80 Gln measures were systematically lower than 7T Gln, the other 3T measures showed no systematic bias (Figure 4).
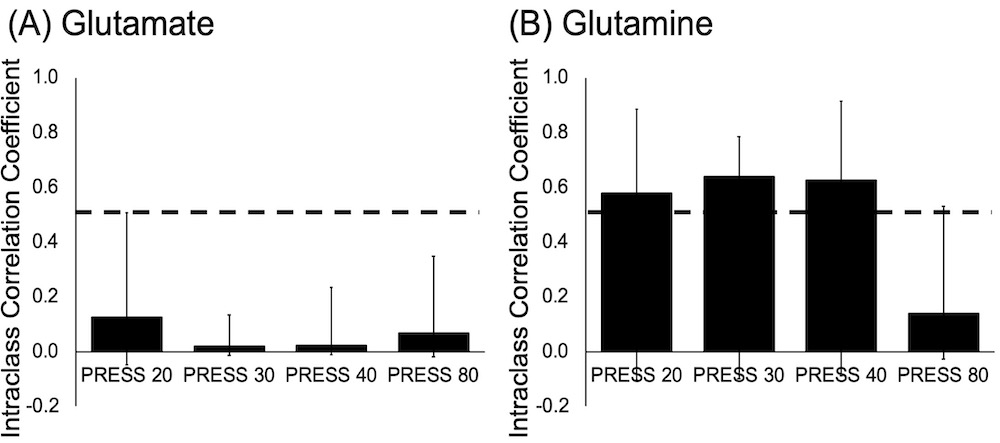
ICC analyses of Glu (Figure 5A) showed the highest agreement between PRESS20 Glu and 7T Glu. All Gln measures showed moderate agreement with 7T data (Figure 5B).
DISCUSSION
Glu quantified from PRESS20 showed the highest agreement with 7T data, which we propose is due to the minimization of T2 signal decay at this short TE. Unexpectedly, Gln quantified from PRESS20, PRESS30 and PRESS40 all showed similar levels of higher agreement.All PRESS measures significantly overestimated Glu values. However, PRESS20, 30 and 40 did not significantly underestimate Gln values, therefore this overestimation cannot be attributed to contamination from the Gln signal. Instead, this may be due to the overlap of macromolecules. Alternatively, 7T STEAM may be underestimating Glu, attributing some of its signal to other molecules (such as macromolecules).
It has previously been suggested that PRESS406 and PRESS807 can most reliably measure Glu at 3T. These studies examined the ability of these sequences to separate Glu using either phantom or simulations, then compared values over two scans. Though this demonstrates that these sequences are accurate in ideal conditions and can reliably be applied to measure Glu in vivo, this does not test the accuracy of these sequences in vivo. Here we show that, compared to 7T data, PRESS40 is less accurate than PRESS80, and both produce values systematically higher than 7T data.
Though PRESS20 Glu showed the highest agreement with 7T data, PRESS80 Glu had a stronger correlation with 7T data. This suggests that PRESS80 is more reliable. Traditionally, the shortest possible echo time is used to maximise the signal due to reduced T2 relaxation, however shorter echo times result in more contamination from macromolecule signal. Longer echo times, such as TE=80ms, minimise macromolecule contributions, which has been shown to greatly reduce measurement variability in all metabolites.8 This may explain the difference between reliability seen here.
PRESS80 Gln had a lower agreement with 7T Gln compared to all other measures. At TE=80ms, the Gln signal is greatly suppressed9, subsequently Gln measured using PRESS80 was systematically lower than Gln measured using 7T.
We conclude that PRESS20 is the most effective at separating Glu and Gln.
Acknowledgements
TB is funded by the Harley N Hotchkiss Postdoctoral fellowship. DG is funded by NSERC USRA. ADH and JN both received NESERC Discovery Grants to fund this work.References
1. Hancu I. Optimized glutamate detection at 3T. J Magn Reson Imaging. 2009;30(5):1155-1162. doi:10.1002/jmri.21936
2. Pradhan S, Bonekamp S, Gillen JS, et al. Comparison of single voxel brain MRS AT 3T and 7T using 32-channel head coils. Magn Reson Imaging. 2015;33(8):1013-1018. doi:10.1016/j.mri.2015.06.003
3. Simpson R, Devenyi GA, Jezzard P, Hennessy TJ, Near J. Advanced processing and simulation of MRS data using the FID appliance (FID-A)—An open source, MATLAB-based toolkit. Magn Reson Med. 2017;77(1):23-33. doi:10.1002/mrm.26091
4. Provencher SW. Automatic quantitation of localized in vivo 1H spectra with LCModel. NMR Biomed. 2001;14:260-264.
5. Gasparovic C, Song T, Devier D, et al. Use of tissue water as a concentration reference for proton spectroscopic imaging. Magn Reson Med. 2006;55(6):1219-1226. doi:10.1002/mrm.20901
6. Posse S, Otazo R, Caprihan A, et al. Proton echo-planar spectroscopic imaging of J-coupled resonances in human brain at 3 and 4 Tesla. Magn Reson Med. 2007;58(2):236-244. doi:10.1002/mrm.21287
7. Schubert F, Gallinat J, Seifert F, Rinneberg H. Glutamate concentrations in human brain using single voxel proton magnetic resonance spectroscopy at 3 Tesla. Neuroimage. 2004;21(4):1762-1771. doi:10.1016/j.neuroimage.2003.11.014
8. Wong D, Schranz AL, Bartha R. Optimized in vivo brain glutamate measurement using long-echo-time semi-LASER at 7 T. NMR Biomed. 2018;31(11):1-13. doi:10.1002/nbm.4002
9. Mullins PG, Chen H, Xu J, Caprihan A, Gasparovic C. Comparative reliability of proton spectroscopy techniques designed to improve detection of J-coupled metabolites. Magn Reson Med. 2008;60(4):964-969. doi:10.1002/mrm.21696
10. Koo TK, Li MY. A Guideline of Selecting and Reporting Intraclass Correlation Coefficients for Reliability Research. J Chiropr Med. 2016;15(2):155-163. doi:10.1016/j.jcm.2016.02.012
Figures