2912
3D CSI downfield 1H MR spectroscopy using EBURP1 spectrally selective excitation pulse1Department of Radiology, University of Pennsylvania, Philadelphia, PA, United States
Synopsis
Downfield MRS provides a great tool to detect and quantify metabolites downfield to water including NAD and ATP. Acquisition of downfield MR spectrum in vivo without water suppression leads to the possibility of detection of many cross-relaxing/exchanging resonances. The T2 of many species occurring downfield of water are relatively short which require short echo time MRS methods. EBURP pulses have been shown to reliably excite narrow spectral region with minimum phase response. In this study, we generated new pulse sequences for single voxel and 3D spectral selective EBURP excitation to detect cerebral NAD from human brain at 7T.
Introduction
1H MRS offers a great tool to detect and quantify metabolites in vivo1. With the advent of higher magnetic field scanners, there is an increase in the MRS applications due to higher SNR and spectral resolution2,3. Most of the 1H MRS studies are on the upfield side (0-4.3 ppm), however, there is a recent surge in reports on the downfield MRS (5 ppm onwards)4,5. Especially, very recently, there is an interest in the non-invasive detection of NAD+ using a 31P surface coil with a study demonstrating the decline of cerebral NAD with healthy aging6,7. Further, studies from two groups have suggested toward the potential of 1H MRS based methods to detect and quantify NAD+ using spectrally selective excitation8-10. The advantage of spectral selective excitation over regular water suppressed spectra is has been extensively reported8. Additionally, the reported T2 of NAD and similar species occurring at downfield are usually short5, giving rise to a need for a 1H MRS technique with lower echo time (TE). Additionally, 7T suffers from inherently high B1 and B0 dispersion, which can be addressed by using a parallel transmit setup. In this study, we aimed to perform 3D mapping of downfield spectra focusing on NAD+ in the human brain at 7T using spectrally selective excitation and 3D chemical shift imaging.Methods
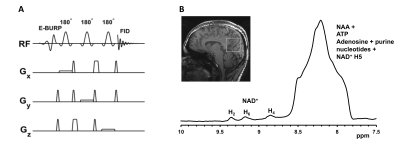
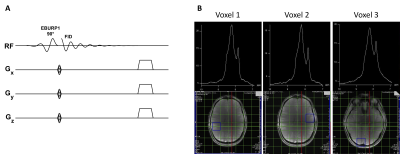
All the human studies were conducted under an approved Institutional Review Board protocol on 7T Siemens scanner with a 32-channel phased-array head coil from healthy human brains. Two healthy volunteers with average age ~35 yrs were scanned.Pulse Design: We developed two pulse sequences for single-voxel and 3D chemical shift imaging of downfield spectra using a spectrally selective self-refocused E-BURP11 90° pulse followed by either three 180° SLR pules for spatial localization (SVS) or phase encoding gradients (3D CSI) (Fig. 1 and 2). The E-BURP1 pulse is 7ms long and bandwidth 2 ppm at 7T (600 Hz). The spectrally selective EBURP and 180° refocusing pulses are centered at 9.1 ppm for acquiring NAD spectrum and 4.7 ppm for water. The overall TE of the SVS and 3D CSI sequences was 20 ms and 800 ms, respectively. Acquisition Following the localizer, a 40×40×40 mm3 voxel was placed in the posterior cortical region for acquiring SVS with the following parameters: TE/TR=20/1000ms, Number of averages=512, Scan time=8.3 minutes. 3D GRE sequence was run to generate a quick T1 weighted 3D map of the brain. A 240×240×240 mm3 FOV was position around the head for the EBURP 3D sequence with the following acquisition parameters: TE/TR=0.8/1000ms, matrix size=8×8×8, voxel size=30×30×30 mm3, Number of averages=1, Scan time=8.3 minutes. In addition to NAD+ scans, water reference scans were also acquired for both SVS and 3D CSI methods. Data Processing SVS data was processed using in house scripts written in MATLAB 2017. 3D CSI data was processed using Seimens software. The individual voxel spectrum was obtained by the Fourier Transform, phase correction and baseline correction. The images of spectra obtained from different voxels in the brain were taken to demonstrate the applicability of EBURP 3D CSI method.
Results and Discussion
We first acquired the single-voxel 1H MR spectra from a healthy volunteer (Figure 1B) demonstrating the representative spectrum containing NAD+ H4, H6, and H2 resonances at 8.9, 9.15 and 9.35 ppm respectively. In addition to NAD+, broad amide protons and NAA signals were also detected between 8 and 8.7 ppm. Figure 2B shows downfield spectra from different positions in a slice position axially in the brain of a healthy volunteer using the EBURP 3D CSI method. The spectra are similar and clearly show the three resonances arising from NAD+. This demonstrates the feasibility of our spectrally selective method to detect and map cerebral NAD+ in the human brain at 7T. Offline data quantification software for CSI data using water reference is under development.Acknowledgements
This project was supported by the National Institute of Biomedical Imaging and Bioengineering of the National Institute of Health under award number P41EB015893References
1. Soares DP and Law M. Clin Radiol (2009) 64:12-21
2. Constanzo AD et al. Eur J Radiol (2003) 48:146-153
3. Henning A. Neuroimage (2018) 168:181-198
4. Fichtner ND et al. Magn Res Med (2017) 79:2863-73
5. Gonçalves SI et al. Magn Res Med (2019) 82:1266-77
6. Lu M et al. Magn Res Med (2014) 71:1959-72
7. Zhu X et al. PNAS (2015) 112:2876-81
8. de Graaf RA et al. NMR Biomed (2014) 27:802-09
9. de Graaf RA et al. Magn Res Med (2016) 78:828-35
10. Bagga P et al. Magn Res Med (2019)
Figures

