2910
Comparison of short echo-time spiral MRSI and single-voxel spectroscopy in the human brain at 3T1Center for Magnetic Resonance Research, Radiology, University of Minnesota, Minneapolis, MN, United States
Synopsis
The goal of this study was to compare the spectral quality and metabolite concentrations obtained with short echo-time 2D spiral MRSI and single-voxel spectroscopy (SVS) in the human brain at 3T. Semi-LASER was used for localization (SVS) or pre-localization (MRSI). MRSI was acquired in a transverse slice through the posterior cingulate cortex (PCC), and SVS was from PCC. Results show comparable spectral quality between acquisitions. Differences in concentrations between the two techniques is likely due to the MRSI point-spread function. This study shows feasibility of acquiring high-quality spiral MRSI data similar in spectral quality to SVS within a few minutes.
Purpose
Proton magnetic resonance spectroscopy (1H MRS) is a non-invasive technique that enables measurement of the concentration of various metabolites in the brain. MRS data can be acquired using single-voxel spectroscopy (SVS) or with magnetic resonance spectroscopic imaging (MRSI)1. Although SVS is commonly used due to high spectral quality (localization, optimized B0 shim and water suppression), it is limited to a single volume-of-interest (VOI). In contrast, MRSI data are acquired simultaneously from many VOIs covering a single or multiple slices. To our knowledge only one study compared SVS and MRSI in the human brain (at 4T)2. The study used conventional MRSI technique which is associated with long scan time. Several fast acquisition MRSI techniques3 are currently available to drastically reduce MRSI scan time. Of these, spiral provides high sampling efficiency in covering k-space. The aim of this study was to compare the spectral quality and metabolite concentrations obtained with short echo-time (TE) 2D spiral MRSI and SVS data in the human brain at 3 tesla.Methods
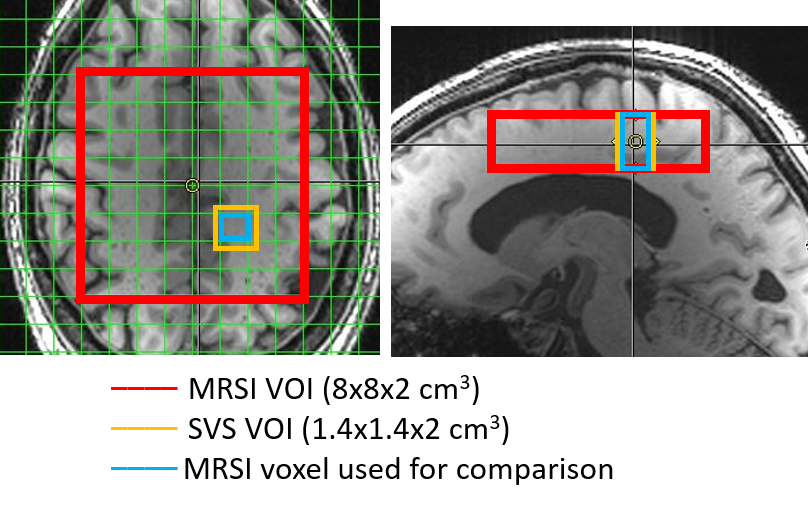
Healthy subjects (N=4, 53±19 years old, male) were scanned on a 3T Siemens Prisma scanner. The standard body coil was used for transmit and a 32-channel head coil for receive. MRSI data were acquired from an axial slice positioned above the corpus callosum and containing the posterior cingulate cortex (PCC) as shown in Figure 1. Spiral readout gradients were used to simultaneously encode two spatial and one frequency dimensions (FOV=160×160 mm2, matrix=16×16). To achieve a spectral bandwidth (SBW) of 1.14 kHz, spiral readout with five spatial interleaves was used. For SVS acquisition (SBW=6 kHz), a VOI of 14×14×20 mm3 (Figure 1) was selected to match the effective voxel size of the MRSI acquisition (i.e. ~4 mL, no spatial filtering) and this VOI was positioned in PCC which contains mostly white matter. All MRS data were localized using semi-LASER4 (TR/TE=3000/29 ms). Metabolite (100 shots) and water reference scans data were collected with both techniques. B0 shimming was performed within the MRSI VOI (80×80x20 mm3) using FAST(EST)MAP which resulted in water linewidth of 10±1 Hz across the large VOI. Metabolite cycling was used to suppress the water signal, and outer volume suppression was used to prevent lipid contamination. MRSI data reconstruction was performed in MATLAB. All spectroscopic data was processed with MRspa5 and quantified using LCModel6 with water scaling option. Concentrations difference between techniques was compared using paired t-test.
Results and Discussion
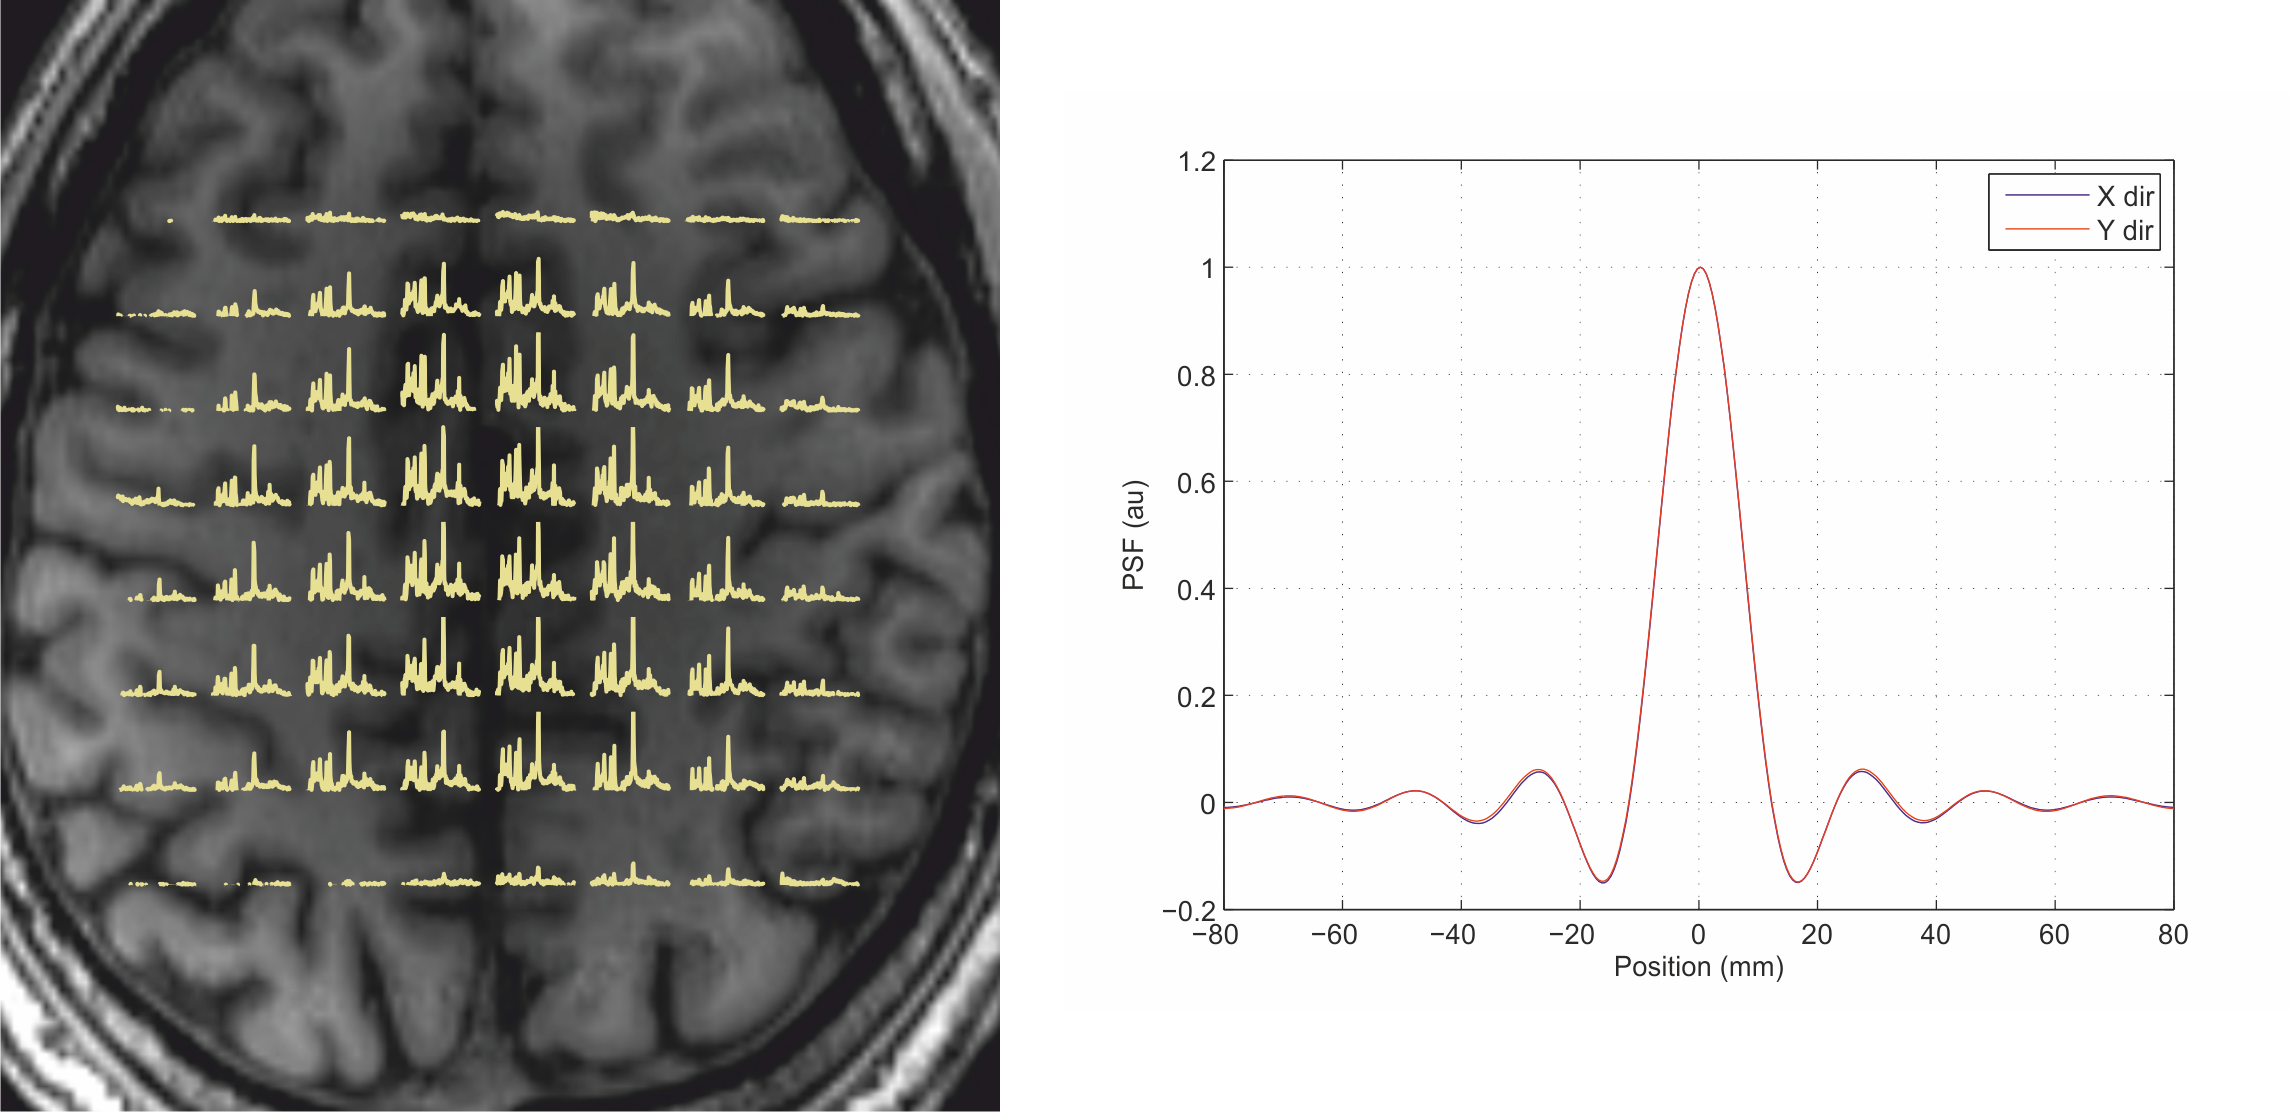
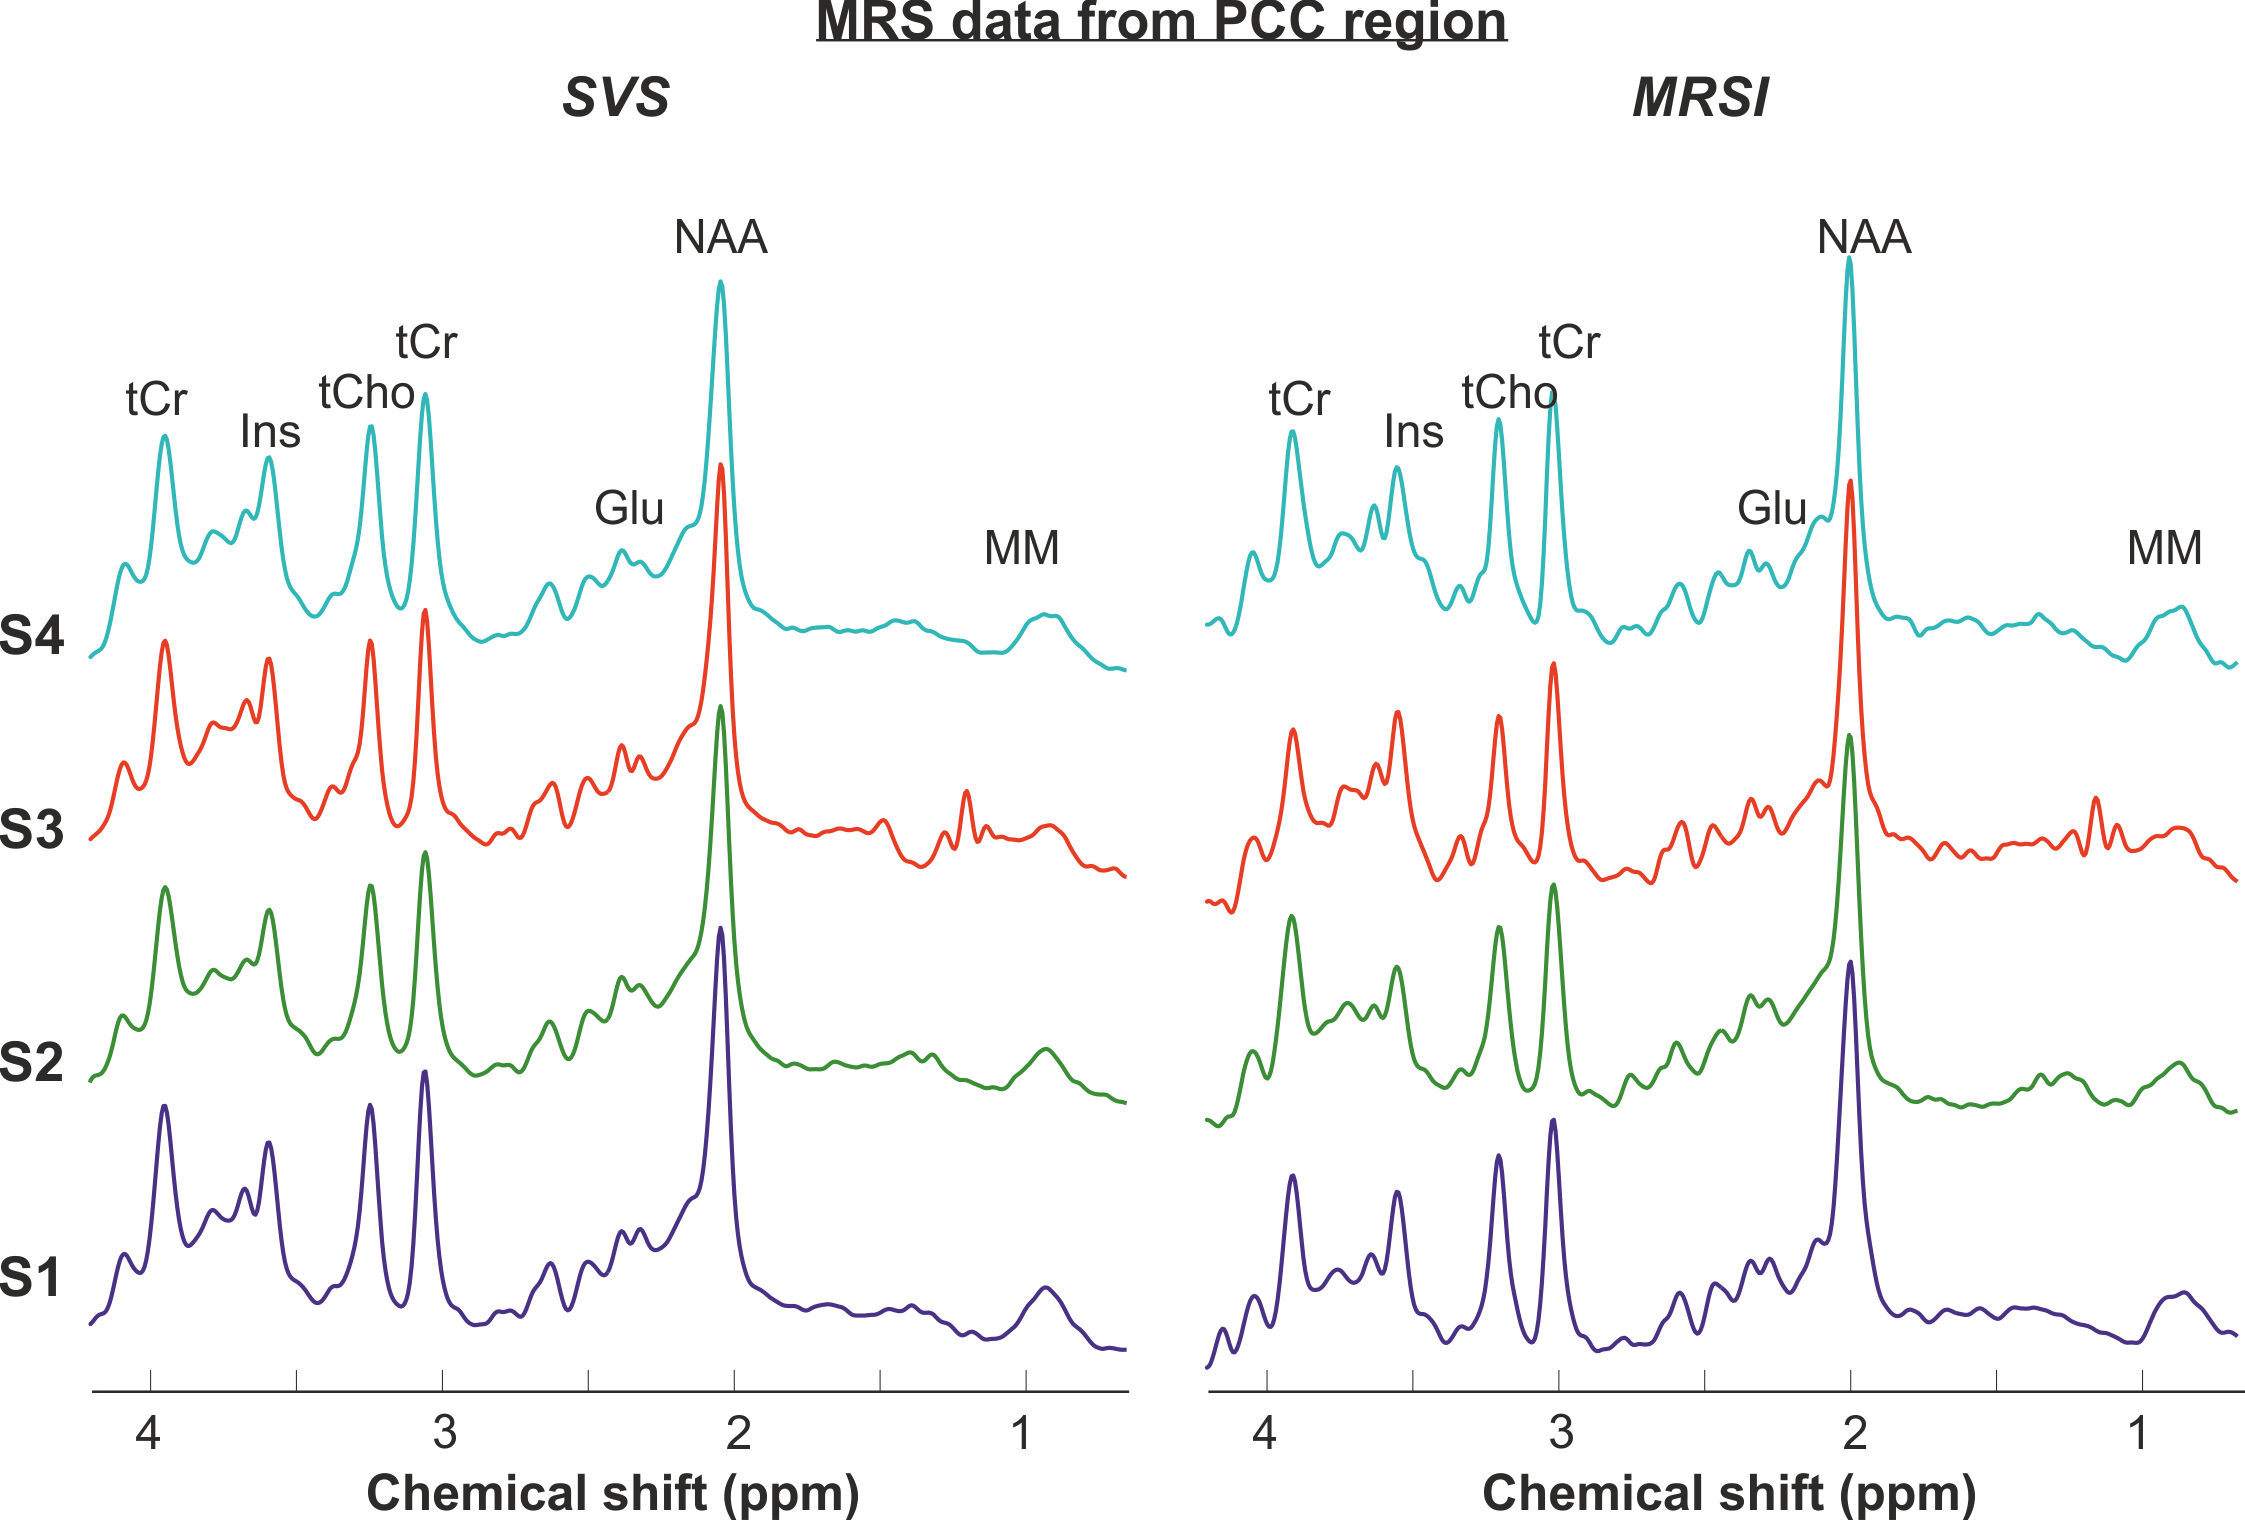
High-quality short TE semi-LASER 1H spiral MRSI data were obtained in all participants. Figure 2 shows an example of MRSI dataset measured in one subject (total scan time 5 minutes), showing high spectral quality with very little lipid contamination (Figure 2).Comparison between SVS data and the corresponding MRSI data in PCC shows very similar spectral quality and spectral pattern between acquisitions (Figure 3) with the MRSI data having slightly narrower linewidth in the PCC voxel (water linewidth was 6.4±0.6 Hz with MRSI and 6.9±0.8 Hz with SVS). Signals from the five major metabolites e.g. N-acetyl aspartate (NAA), total creatine (tCr), choline containing compounds (tCho), glutamate (Glu), and myo-inositol (Ins) and other lower concentration metabolites are clearly visible in all datasets. The SNR per unit volume per unit time were also comparable: 13±3 with SVS vs. 11±2 with MRSI.
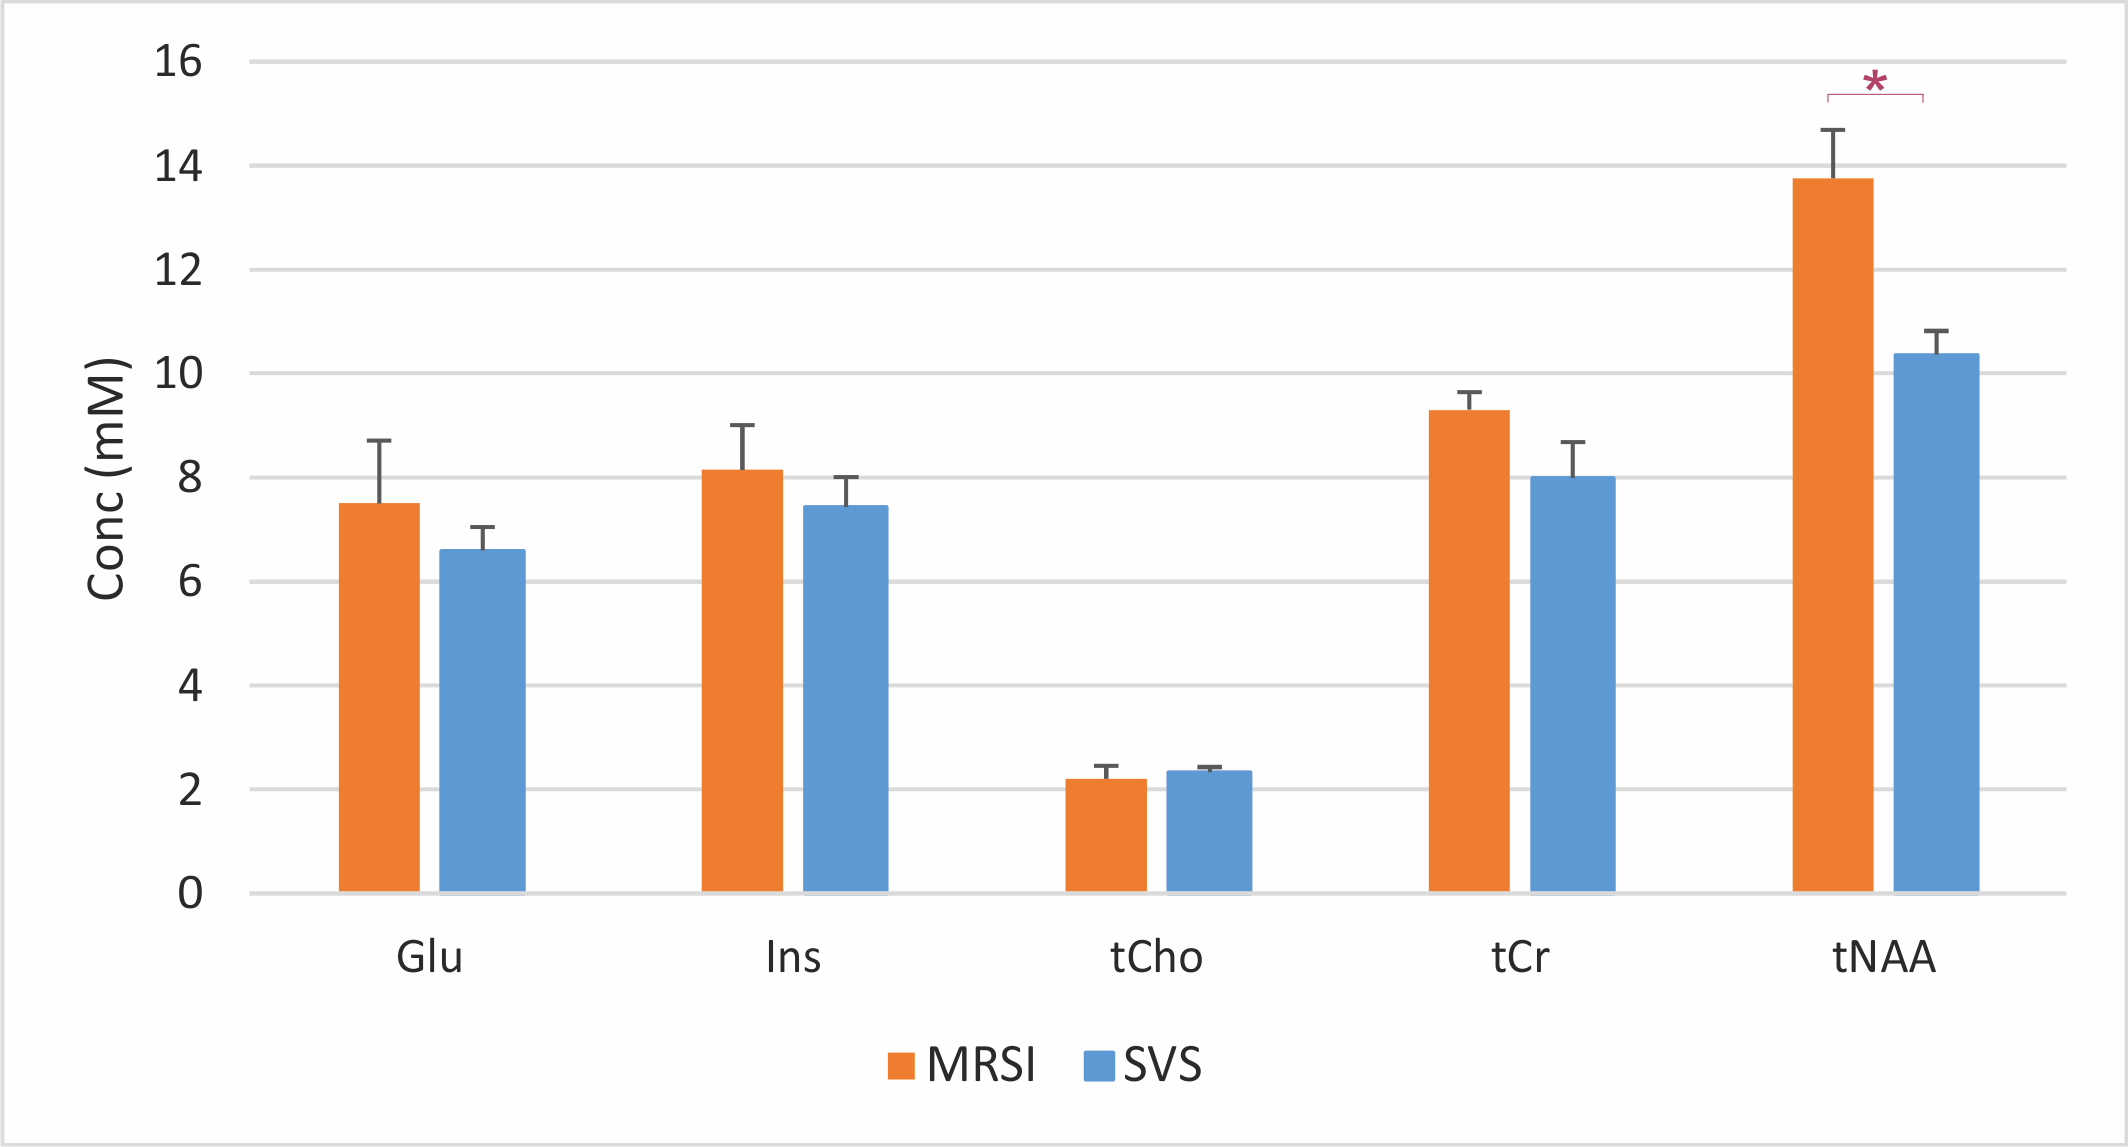
To have comparable number of points between acquisition techniques, the SVS data (metabolite and water reference scans) were down-sampled to a SBW of 1.2 kHz by selecting every 5 points in the time domain. The mean measured concentration of metabolites showed a trend to be higher with spiral MRSI than SVS (Figure 4) especially for Glu, Ins and tCr. Only tNAA was significantly different between acquisitions. One likely explanation for this difference could be due to the PSF of the MRSI acquisition (Figure 2) since no spatial filtering was applied during reconstruction of the MRSI data. This would result in difference spectral contribution from neighboring voxels in the MRSI data compared to the sharper profile of the SVS VOI. We plan to perform additional experiments using spatial filter in the MRSI data with matching SVS VOI.
Conclusion
The current study demonstrates the feasibility of acquiring high-quality short TE spiral MRSI data similar to the spectral quality usually obtained with SVS in the human brain within the same acquisition time (~5 min). The difference in concentration observed between the two MRS techniques are likely related to the PSF differences between the MRSI and SVS acquisitions.Acknowledgements
This work was supported by NIH grants: P41 EB027061, P30 NS076408 and 1S10OD017974-01References
[1] Wilson et al. Mag Reson Med 2019
[2] McNab and Bartha NMR Biomed 2006
[3] Shankar et al. NMR Biomed 2019
[4] Öz and Tkac Magn Reson Med. 2011
[5] MRspa: https://www.cmrr.umn.edu/downloads/mrspa/
[6] Provencher Magn Reson Med. 1993
Figures