2909
Improvement of the selective multiple quantum coherence chemical shift imaging sequence for lactate imaging of lymphoma patients at 3T1University of Pennsylvania, Philadelphia, PA, United States
Synopsis
Lactate is an important marker of tumor metabolism. We have previously reported the Hadamard slice selected, selective multiple quantum coherence chemical shift imaging sequence for a 3T clinical scanner to image lactate in the human body. Here we report modification and optimization of the sequence for reducing motion effect and increasing lipid suppression while retaining lactate. A coherence selection gradient ratio of a:-1:2 with nonzero a provided improved suppression of lipid resonances at 1.3 ppm and 0.9 ppm compared to the previous 0:-1:2 ratio. Optimization of RF pulses blocked occurrence of MQC between lipid 2.0 ppm and 5.3 ppm resonances.
Introduction
The selective multiple quantum coherence (Sel-MQC) is a useful technique to detect lactate in the environment of lipids.1 Our previous clinical scanner version of the sequence employed Hadamard-encoded slice inversion and 2D phase encoding.2 Single slice localization by direct slice selection would be beneficial to avoid motion artifact. However, it entailed less lipid suppression. In this study, we overcame the problem by applying additional gradients and made other significant improvements to the sequence.Methods
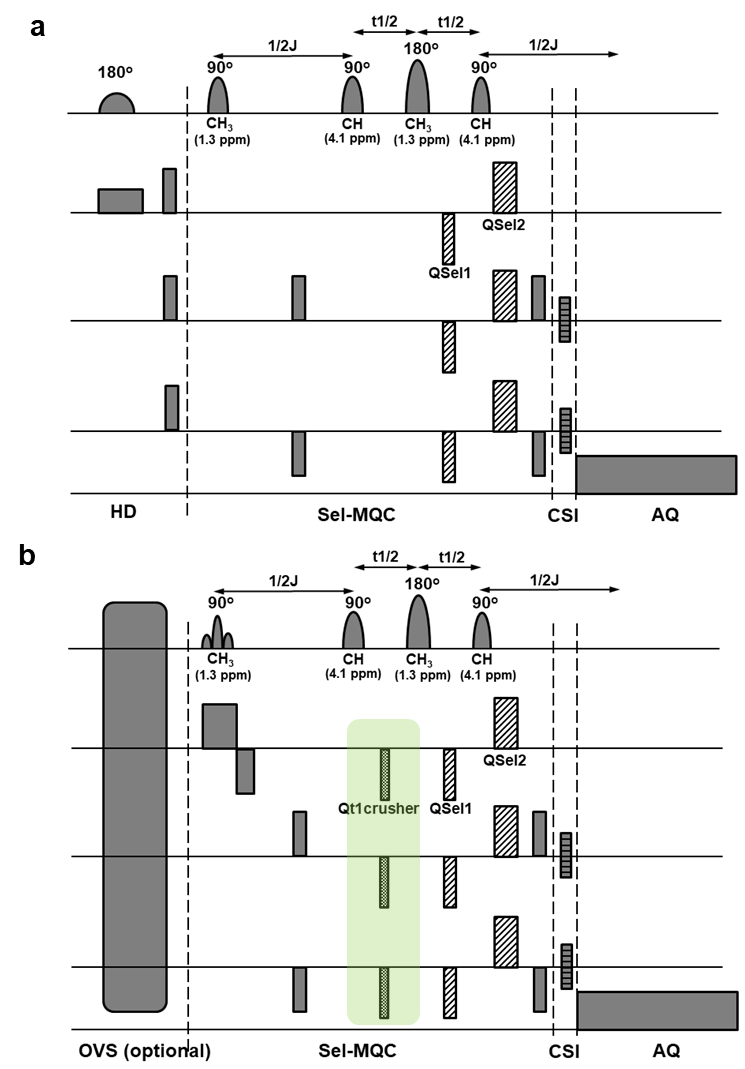
The following modifications were made from the previous sequence:2 1) Hadamard inversion slice encoding scheme was replaced with direct slice selection on the first pulse of the Sel-MQC pulse train (Fig 1a and 1b). This removes addition and subtraction processes on Hadamard slices, reducing motion effect. 2) The previous sequence used coherence selection gradients with the ratio of 0:-1:2 or 1:0:2 to select either zero quantum to double quantum transition (ZQ -> DQ) or double quantum to zero quantum transition (DQ ->ZQ) of lactate while dephasing lipid signals. We found that by employing the coherence selection gradient ratio of a:-1:2 or 1:b:2 where a≠0, a≠1 and b≠0, b≠-1, further suppression of lipid signals is possible. During these nonzero gradients (indicated as Qt1crusher in Fig 1b), lactate spins remain at their zero quantum coherence states while lipid spins experience addtional dephasing. 3) In the previous sequence, RF pulses of Gauss shape and 7.8 ms duration were used for both 90o and 180o pulses. Though these pulses were adequate for selective excitation/refocusing of lactate CH3 peak (1.3 ppm) and CH peak (4.1 ppm), they excited the lipid resonances at 2.0 ppm and 5.3 ppm as well. The J-coupling between these lipid peaks produced MQC during the pulse train and left these peaks not adequately suppressed. As the 2.0 ppm lipid signal introduced significant baseline distortion to analyze lactate signals at 1.3 ppm, we carefully adjusted the RF pulse lengths to avoid excitation of one of these two J-coupled lipid resonances. The 90o excitation and 180o inversion profiles of the RF pulses were analyzed to find optimal pulse lengths by solving the Bloch equation.3 4) We placed the very selective suppression outer volume saturation (VSS-OVS) bands around the region of interest in Sel-MQC-CSI to suppress lipid signals that might be insufficiently suppressed by Sel-MQC owing to magnetic field inhomogeneity.4 We performed comparison of the previous sequence/parameters and the new sequence/parameters with a lactate phantom and an oil phantom as well as a lactate phantom placed near the typical lymphoma appearing sites on a volunteer.Results
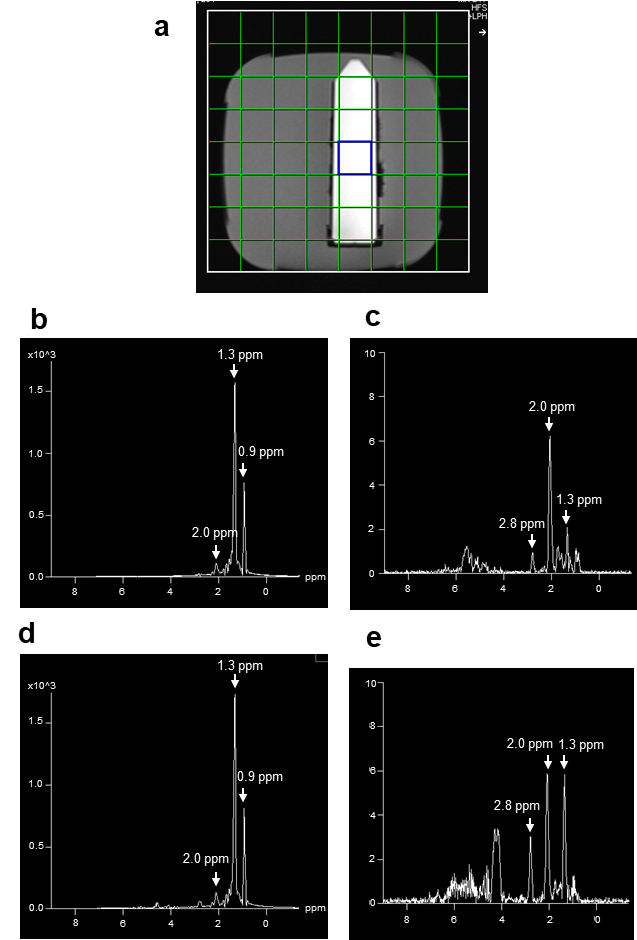
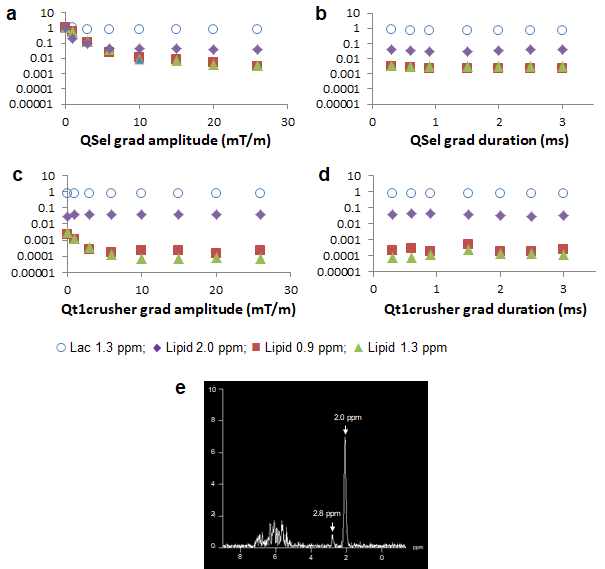
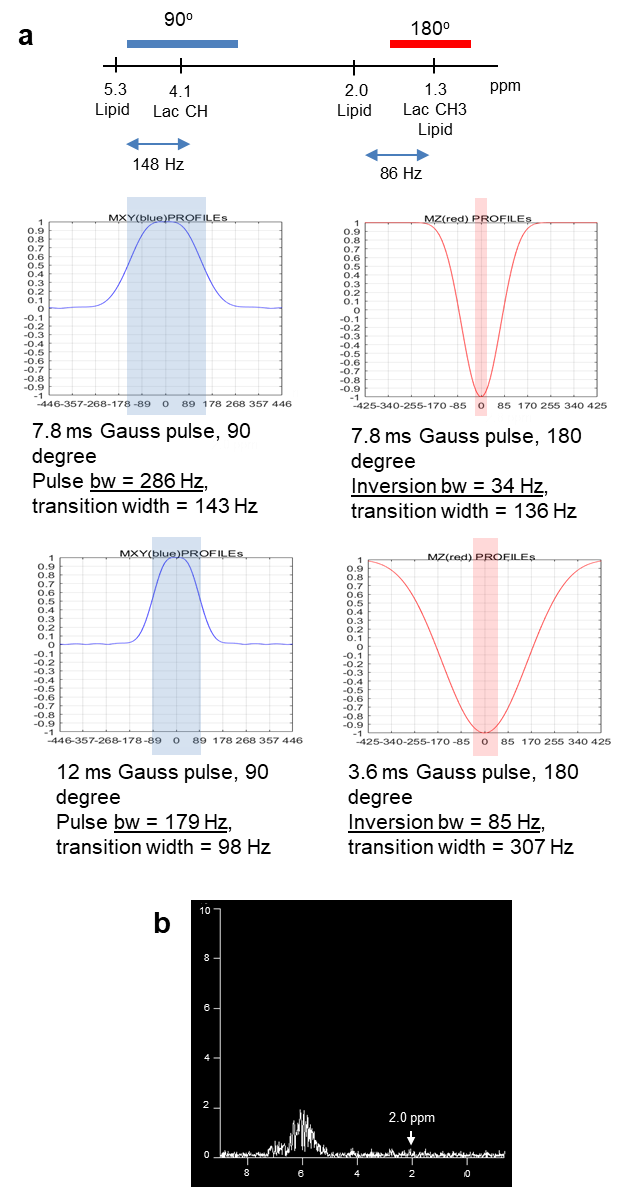
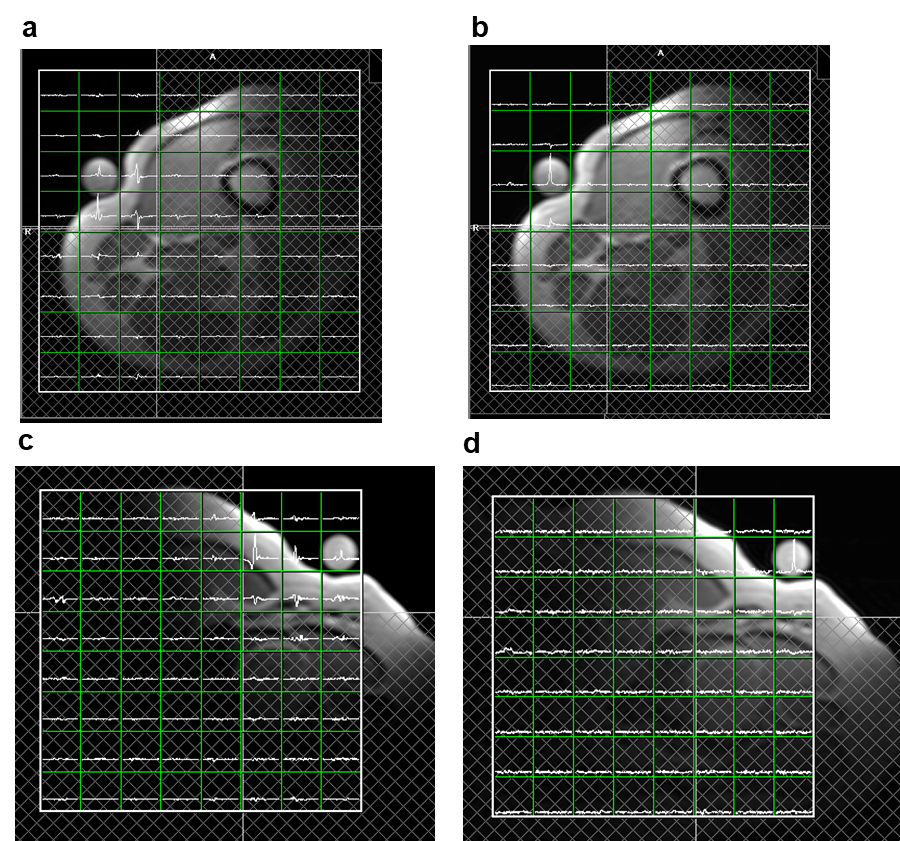
Fig 2 shows comparison of lipid signals from the previous sequence (Fig 1a) and the modified sequence (Fig 1b) with the coherence selection gradient ratio 0:-1:2 which selects the ZQ->DQ pathway. Suppression of lipid signals at 0.9 ppm and 2.0 ppm were similar between the two sequences. However, suppression of lipids at 1.3 ppm was three times less in the new sequence than the old sequence. Lactate signals were similar between the two sequences (performed in a separate experiment). We were able to boost lipid suppression by employing Qt1crusher. Fig 3 shows dependence of lactate 1.3 ppm, lipid 0.9 ppm, 1.3 ppm and 2.0 ppm on QSel and Qt1crusher gradients. With QSel gradients only, lipid 1.3 ppm signal decreased by 300-fold compared to QSel gradients = 0 in the new sequence. With application of Qt1crusher gradients, the total suppression of lipids at 1.3 ppm reached 15,000 times, which was 50 times bigger than without Qt1crusher gradients. The lipid signals at 2.0 ppm were only limitedly suppressed by QSel and Qt1crusher gradients (Fig 3). We were able to suppress these signals by adjustment of the pulse lengths. Fig 4a shows excitation and inversion profiles of Gauss pulses at different pulse lengths. By employing 12 ms for 90o excitation and 3.6 ms for 180o inversion, the occurrence of MQC between the 5.3 ppm and 2.0 ppm lipid peaks was blocked effectively (Fig 4b). Fig 5 shows modified Sel-MQC-CSI data with a lactate phantom placed on a volunteer. The data with the previous parameters and the new parameters are presented. Clean lactate spectra without contamination of lipids were obtained with the new sequence/parameters.Discussion
The modified Sel-MQC-CSI pulse sequence provided substantially improved lipid suppression while maintaining the lactate signal as previous sequence and reducing potential motion artifacts. As lymphoma, which usually presents in the superficial region, e.g., neck, armpit and upper thigh, is often surrounded by fat-rich tissues and CSI involves voxel bleeding, a full suppression of lipid signals from both tumor and the surrounding tissues is important, as demonstrated in this study. Alanine, which is reflective of glutaminolysis,5 has the same J-coupling constant and similar resonance frequencies as lactate (1.48 and 3.78 ppm vs 1.33 and 4.11 ppm). Thus, our sequence can be applied for simultaneous detection of lactate and alanine after further optimization on the RF pulses. As lymphoma is a bodily tumor, a motion correction strategy can be requested to guarantee reproducibilty of spectral quantification. A retrospective/prospective correction of the frequency and phase of the spectrum by interleaved water signal detection at each repetiton time is a promising option for that.6Acknowledgements
The study was partially supported by grants from NIH (R01-CA172820, R01-CA129544), the Institute for Translational Medicine and Therapeutics (ITMAT) and the McCabe Foundation.References
1. He QH, Shungu DC, Vanzijl PCM, et al. Single-scan in vivo lactate editing with complete lipid and water suppression by selective multiple-quantum-coherence transfer (Sel-MQC) with application to tumors. J Magn Reson B. 1995;106(3):203-211.
2. Mellon EA, Lee SC, Pickup S, et al. Detection of lactate with a hadamard slice selected, selective multiple quantum coherence, chemical shift imaging sequence (HDMD-SelMQC-CSI) on a clinical MRI scanner: Application to tumors and muscle ischemia. Magn Reson Med. 2009;62(6):1404-1413.
3. Yao C, Simplaceanu V, Lin A, et al. Bloch analysis and solvent suppression by soft pulses. Application to proton NMR investigations of human hemoglobin in H2O and in intact red blood cells. J Magn Reson. 1986;66(1):43-57.
4. Tran TK, Vigneron DB, Sailasuta N, et al. Very selective suppression pulses for clinical MRSI studies of brain and prostate cancer. Magn Reson Med. 2000;43(1):23-33.
5. Lee SC, Shestov AA, Guo LL, et al. Metabolic detection of Bruton's tyrosine kinase inhibition in mantle cell lymphoma cells. Mol Cancer Res. 2019;17(6):1365-1377.
6. Thiel T, Czisch M, Elbel GK, et al. Phase coherent averaging in magnetic resonance spectroscopy using interleaved navigator scans: compensation of motion artifacts and magnetic field instabilities. Magn Reson Med. 2002;47(6):1077-82.
Figures