2908
Silent EPSI using a gradient axis driven at 20 kHz1Radiology, University Medical Center Utrecht, Utrecht, Netherlands, 2Spinoza Centre for Neuroimaging Amsterdam, Amsterdam, Netherlands
Synopsis
Echo planar spectroscopic imaging (EPSI) can be used for fast spectroscopic imaging, however, the gradient hardware greatly limits the spectral bandwidth. Moreover, the associated fast switching gradient produces uncomfortable levels of acoustic noise. In this work, we show the feasibility of spectroscopic imaging at high spectral bandwidth using a silent gradient axis driven at 20 kHz and a segmented EPSI sequence. We report results on the silent segmented EPSI compared to the conventional EPSI approach on a phantom containing NAA, creatine and glutamate and show the first silent and high bandwidth in-vivo measurements.
Introduction
High field MRSI is of increased interest because of its higher spectral resolution and SNR. Here, echo planar spectroscopic imaging (EPSI) allows for more time-efficient MRSI acquisitions through simultaneous spatial and spectral encoding. However, the acquisition of sufficient spectral bandwidth in EPSI sequences is challenging due to gradient hardware limitations. At high field, solutions to increase the spectral bandwidth involve a combination of repeating the acquisition with shifted or reverse gradient polarity1 and flyback gradients2 at high performance. The latter produces significant acoustic noise which can pose a health risk for the patient.1,3 Previously, it has been shown that a silent gradient axis driven at 20 kHz can be used to decrease acoustic noise during imaging exams.4 Here, we show that such a silent gradient axis can be applied to spectroscopic imaging to produce silent and high bandwidth EPSI.Methods
The silent gradient axis consisted of a lightweight insert single-axis (z) gradient coil, which was resonant at 20.2 kHz and driven using an audio amplifier. In this work, this setup produced an oscillating gradient field of 31.5 mT/m. The gradient insert featured an integrated birdcage transmit coil which was combined with a 32-channel receive coil (Nova Medical, USA) for data acquisition. The setup was placed in a 7T MR-scanner (Philips Achieva, Best, NL), which controlled the setup through an external trigger (see Figure 1) in synergy with the whole-body gradients, yielding four physical gradient axes.In a single shot using only the oscillating gradient axis, the encoding resolution is 47.3 mm in the z-direction. To increase this resolution, we now implemented a segmented EPSI acquisition which required multiple shots. In our current reconstruction, the spectral bandwidth is an integer fraction of 20.2 kHz (e.g. 10.05 kHz, 5.025 kHz, etc). Here, we do not yet include all data-points (Figure 2), so SNR will be compromised. RF-excitation was done with a slice-selective pulse-acquire approach, without any lipid suppression.
A volunteer and a 12-cm diameter MRS phantom were imaged. The phantom contained 25 mM n-acetyl aspartate (NAA), 20 mM creatine (Cr), and 25 mM glutamate (Glu) dissolved in phosphate-buffered saline (PBS). Imaging parameters: TE/TR = 7ms/5050ms, FA = 90°, 12 mm isotropic voxel size, 16x16 matrix, Nspectral samples = 512, averages = 1 (3 in-vivo), BWspectral = 3367 Hz, spectral resolution = 6.58 Hz and a coronal slice orientation. We used VAPOR water suppression5 with a 350 Hz (250 Hz in-vivo) bandwidth. Four shots were acquired in the z-direction to acquire this resolution, which resulted in a scan time of 16x4x5050 = 5.22 min (16 min in-vivo).
The data was reconstructed in MATLAB using a combination of a non-uniform Fourier transform (NUFFT), a density compensation and an iterative conjugate-gradient SENSE reconstruction.6
For comparison, a more conventional EPSI scan using the whole-body gradient was also performed on the same MRS phantom. Here, a different 2-channel transmit coil was used (Nova Medical, USA). This scan featured a semi-LASER excitation pulse.7 The following imaging parameters differed from the silent EPSI acquisition: TE = 36 ms, BWspectral = 3652 Hz, spectral resolution = 7.13 Hz and a coronal slice orientation. Here, the scan time was 1.20 min. Audio levels were obtained from the scanners built-in sound pressure level (SPL) prediction.
Results and Discussion
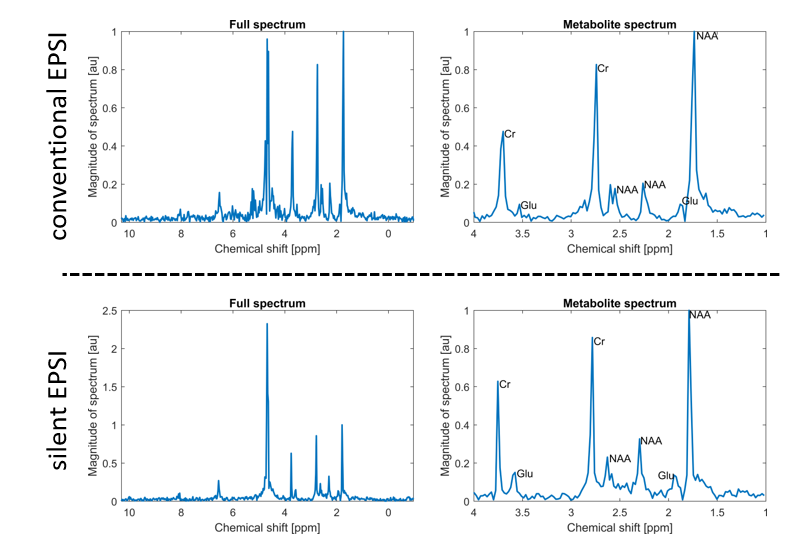
Figure 3 shows an overlay of the magnitude of the measured spectra on an image obtained from the water peak. We can see that in both methods the metabolites are detected in most of the phantom. In the silent EPSI-scan, the signal drop-off observed at edges of the phantom originates from an inhomogeneous B1 from the transmit coil.Figure 4 shows a detailed view of a spectra from the phantom for both methods. Here, individual spectra of the silent EPSI sequence feature the same NAA, glutamate and creatine peaks as the conventional EPSI-scan.
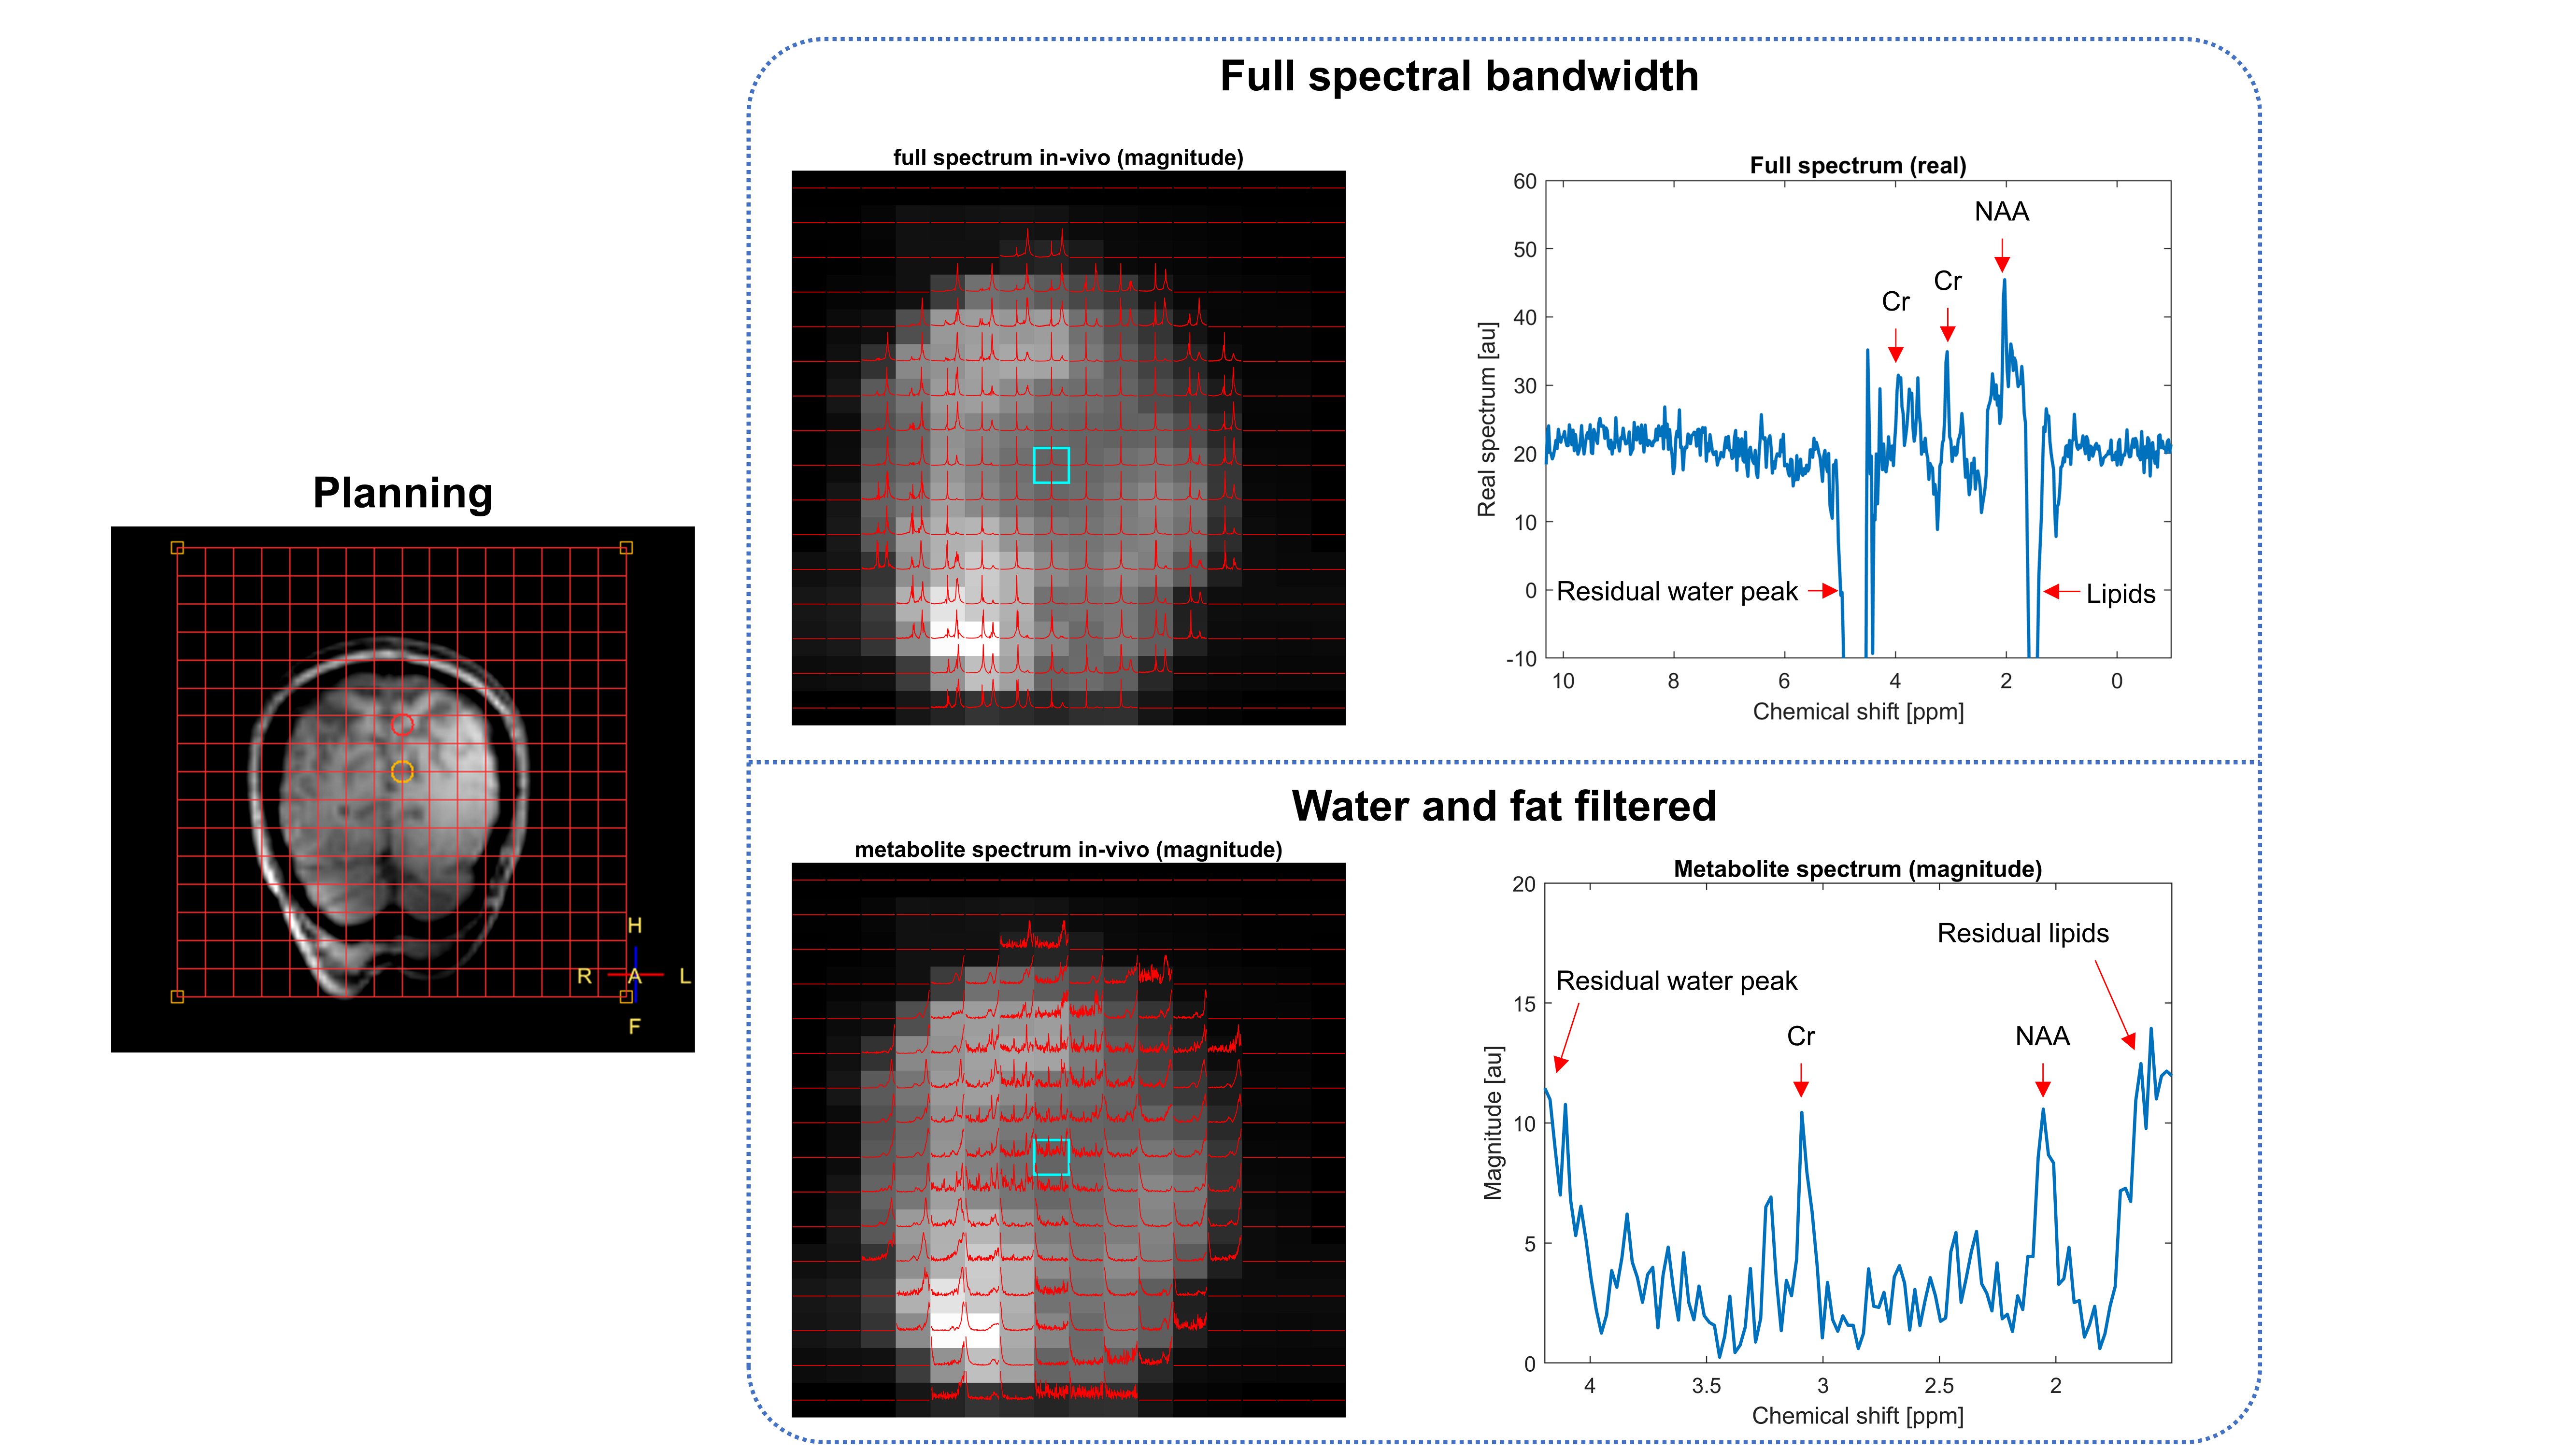
As proof of principle, we obtained an in-vivo measurement with the silent ESPI using a simple water suppressed pulse-acquire sequence (figure 5). As no lipid suppression was used, we do observe the metabolites in the centre of the brain, but clearly further lipid suppression closer to the periphery is required. Importantly, the silent EPSI-sequence featured a 28.6 dB lower SPL predicted by the scanner when compared to the conventional EPSI-scan. This resulted in minimal sound experience by the subject during the scan, dominated by the slice-selection gradient, which could be further reduced when moving towards 3D-MRSI.
Our preliminary implementation used a segmented readout and a long TR due to our current hardware cooling limitations and to facilitate comparison with traditional semi-LASER sequences, yet maintains substantial redundancy in spectral and spatial encoding. For instance, the 12-fold redundancy in spectral resolution can combined with additional spatial (EPI) encoding using the whole-body gradients, and TR could be reduced by a factor of 12 as well. When this is merged with lipid suppression, we believe that our preliminary results demonstrate a realistic path of full brain MRSI in acceptable scan times and acoustic noise levels.
Conclusion
We have presented a novel method for silent and fast spectroscopic imaging with a larger spectral bandwidth by using a silent gradient axis switched at 20 kHz and a segmented EPSI readout.Acknowledgements
No acknowledgement found.References
1. An Z, Tiwari V, Baxter J, et al. 3D high‐resolution imaging of 2‐hydroxyglutarate in glioma patients using DRAG‐EPSI at 3T in vivo. Magn. Reson. Med. 2019;81:795–802 doi: 10.1002/mrm.27482.
2. Cunningham CH, Vigneron DB, Chen AP, Xu D, Nelson SJ, Hurd RE, Kelley DA, Pauly JM. Design of flyback echo-planar readout gradients for magnetic resonance spectroscopic imaging. Magn Reson Med 2005;54:1286–1289.
3. Quirk ME, Letendre AJ, Ciottone RA, Lingley JF. Anxiety in patients undergoing MR imaging. Radiology 1989;170:463–466 doi: 10.1148/radiology.170.2.2911670.
4. Versteeg E, Klomp D, Hendrikse J, Siero J. Supersonic imaging with a silent gradient axis driven at 20 kHz. In: Proceedings of the 27th Annual Meeting of ISMRM. ; 2019. p. #4586.
5. Tkáč I, Starčuk Z, Choi I-Y, Gruetter R. In Vivo 1 H NMR Spectroscopy of Rat Brain at 1 ms Echo Time.; 1999.
6. Pruessmann KP, Weiger M, Börnert P, Boesiger P. Advances in sensitivity encoding with arbitrary k -space trajectories. Magn. Reson. Med. 2001;46:638–651 doi: 10.1002/mrm.1241.
7. Arteaga de Castro CS, Boer VO, Andreychenko A, et al. Improved efficiency on editing MRS of lactate and gamma‐aminobutyric acid by inclusion of frequency offset corrected inversion pulses at high fields. NMR Biomed. 2013; 26: 1213‐1219.
Figures
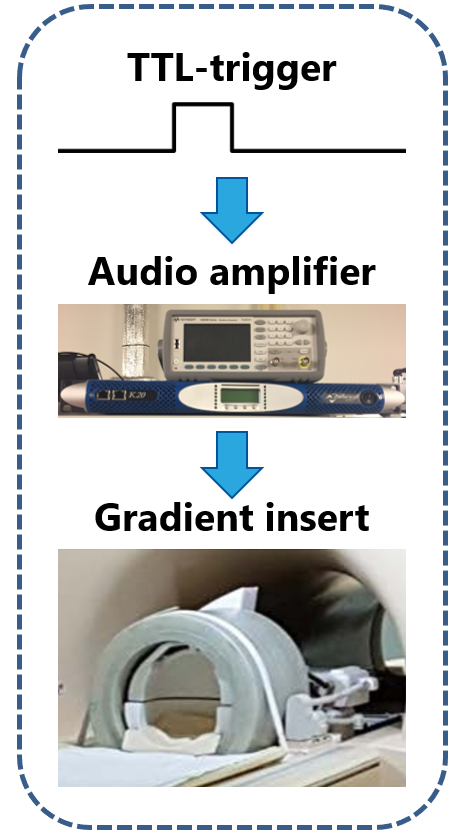
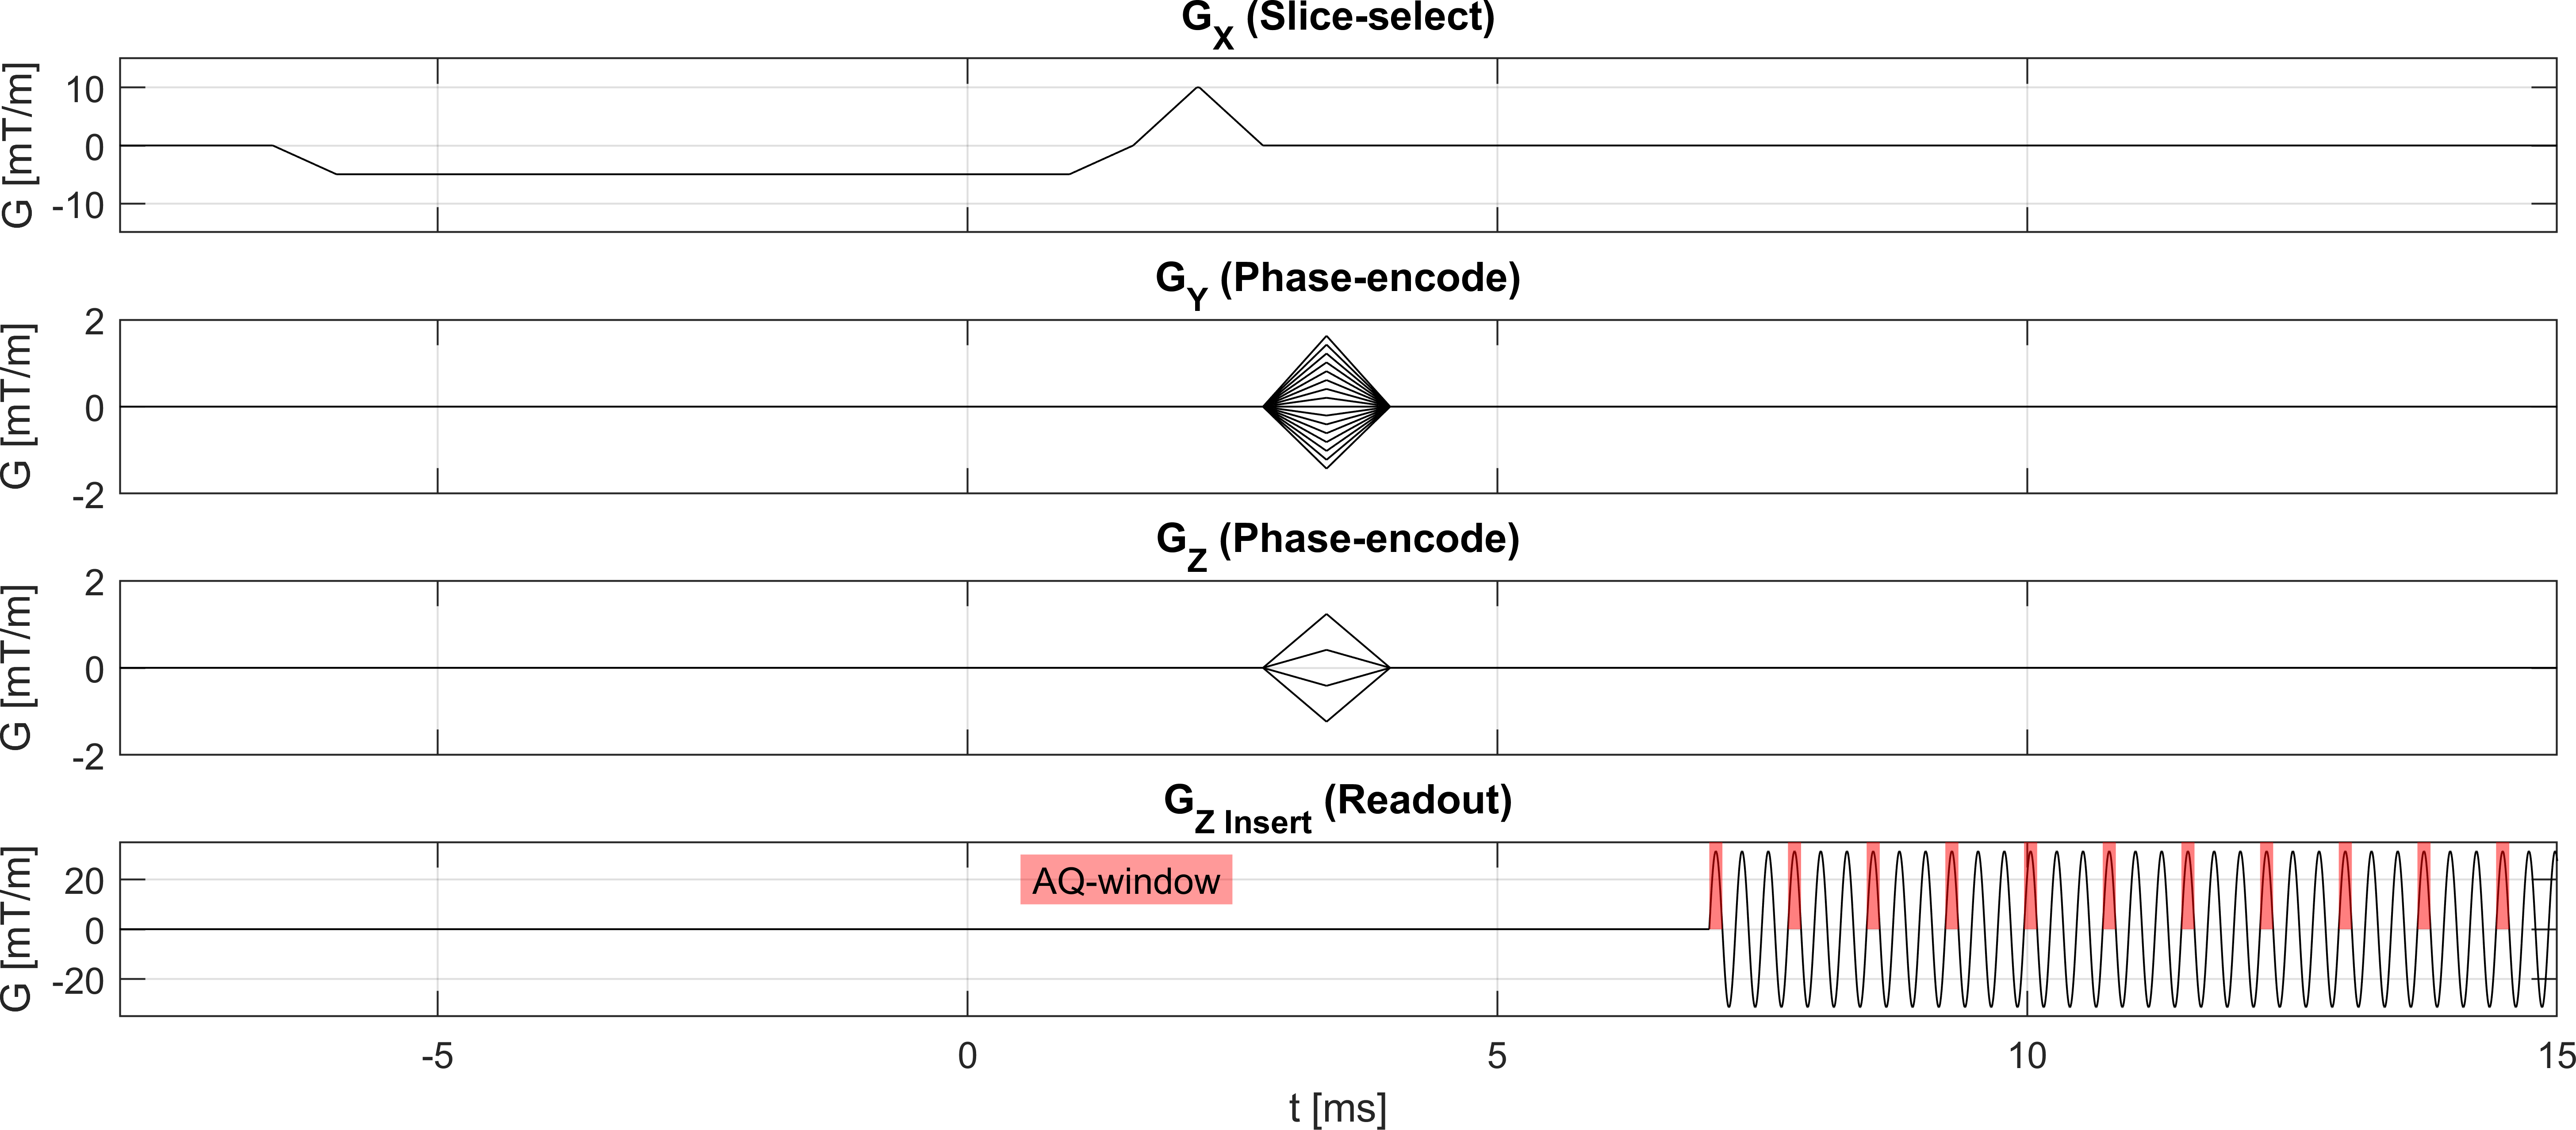
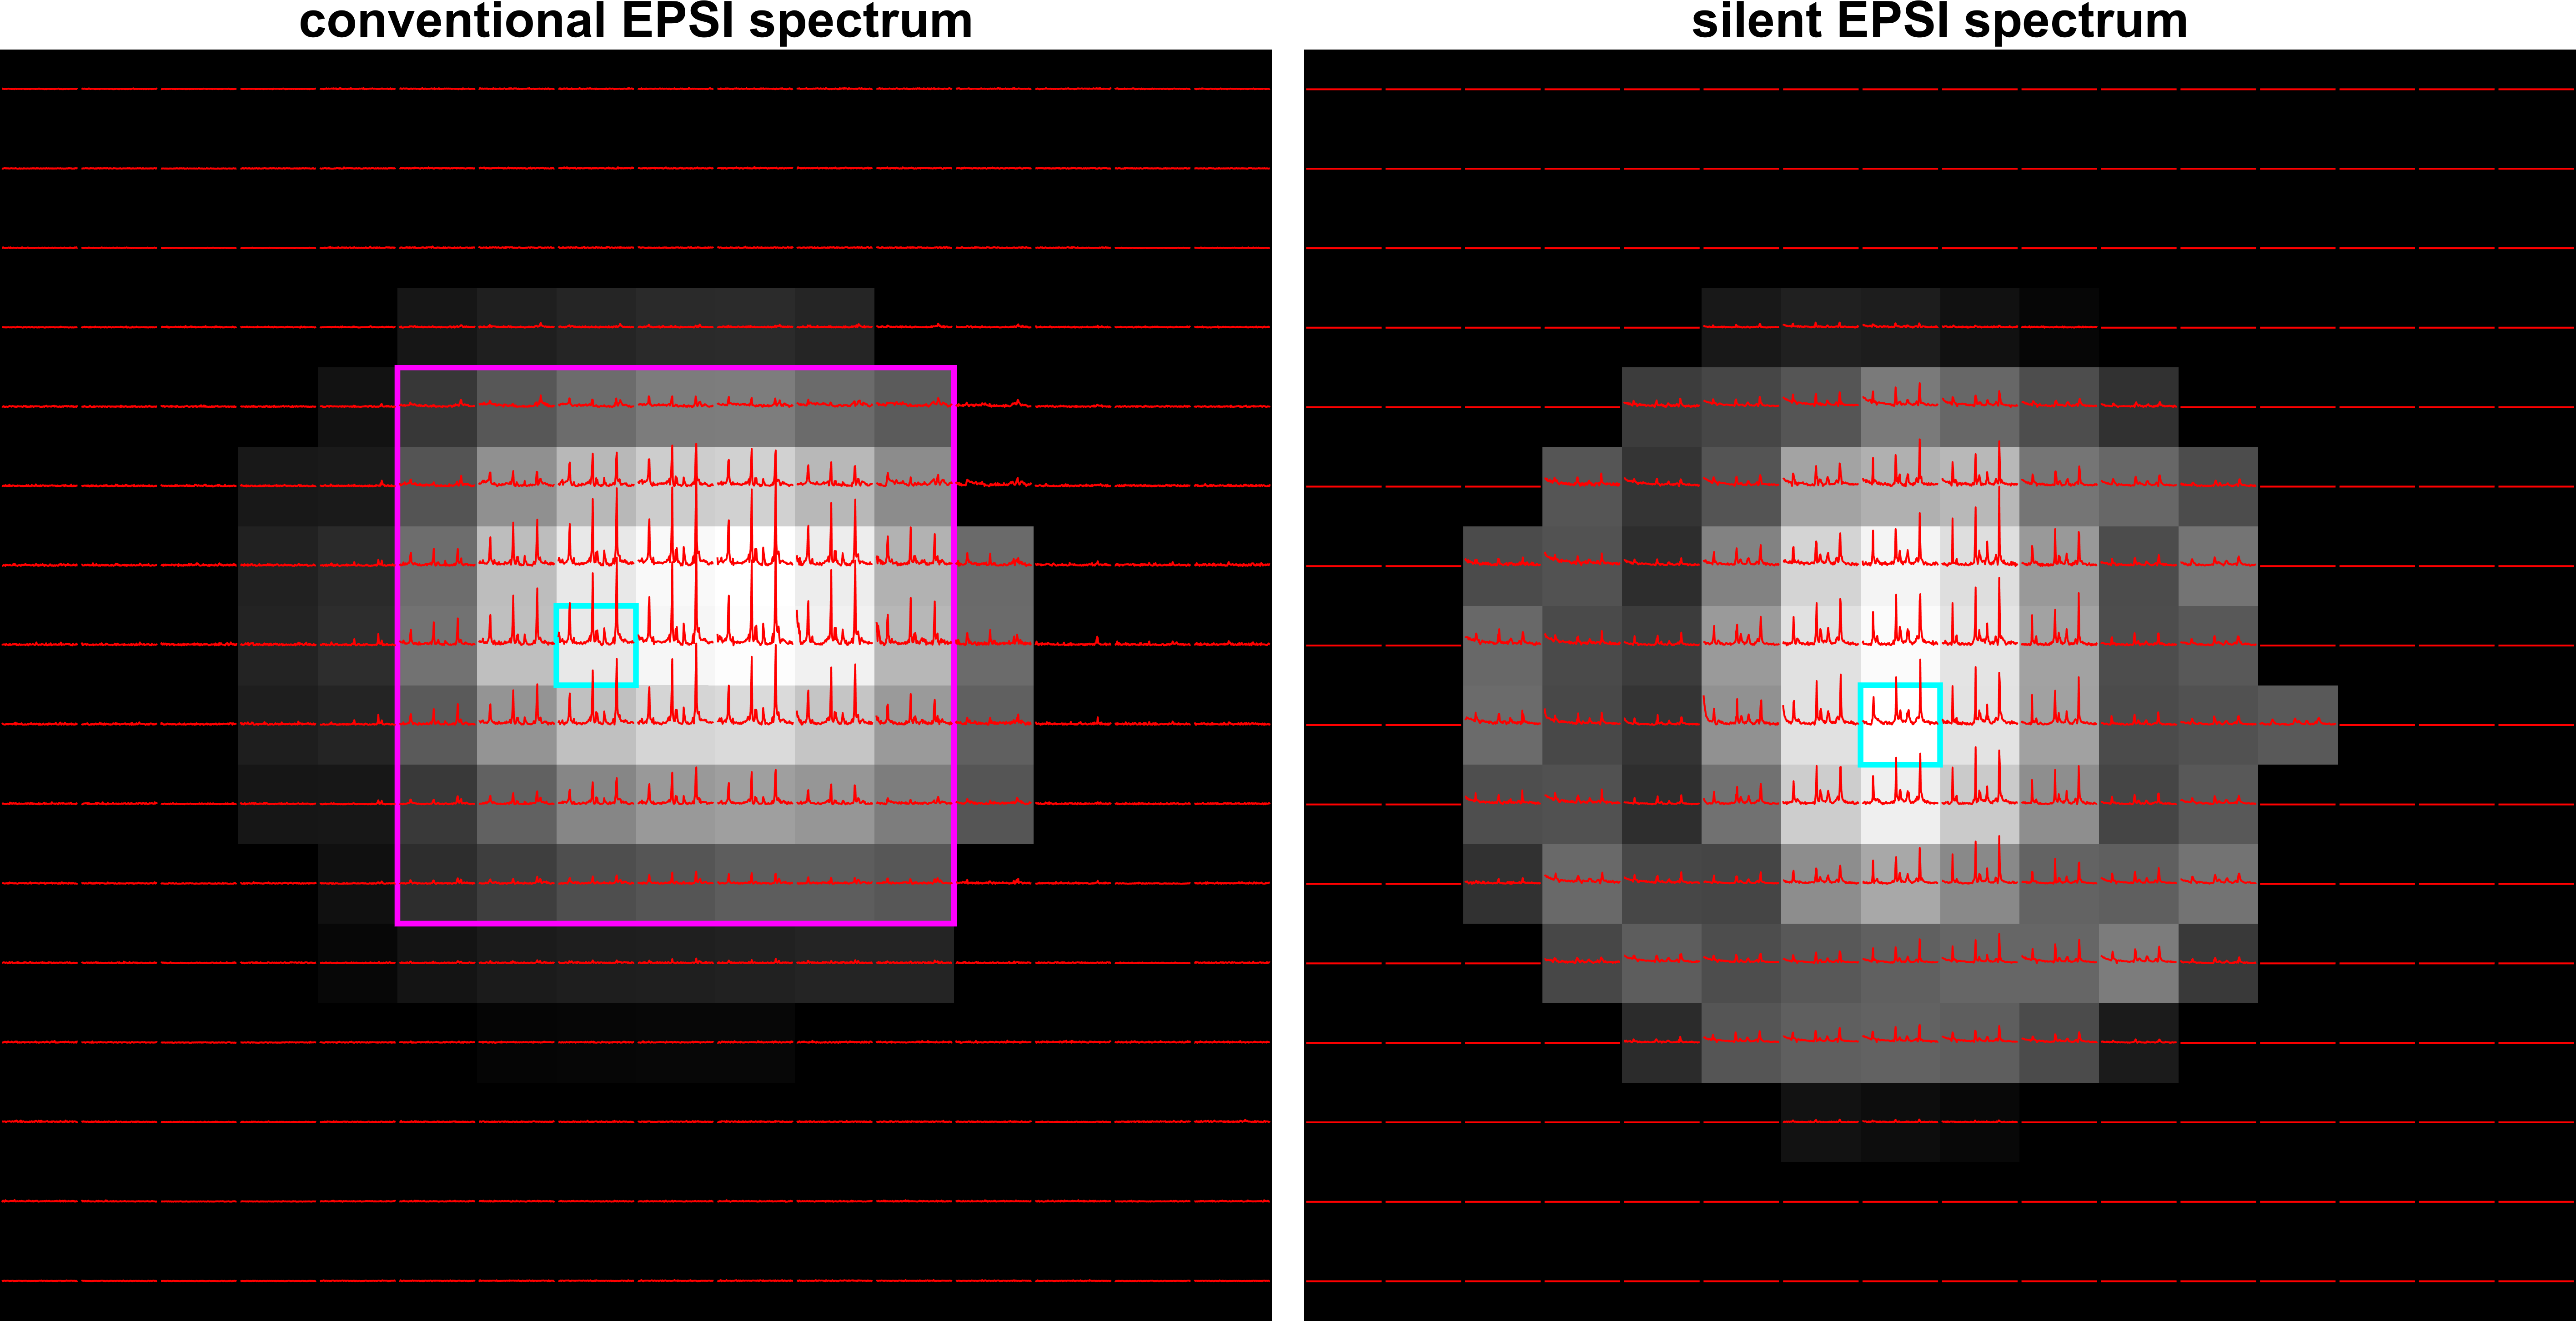
Figure 3 Spectra of metabolite (NAA, creatine, glutamate, ppm range = 4.2…1.0 ppm) phantom overlaid on a water peak image. Voxel-size = 12 mm isotropic, matrix size = 16x16 and scaled to the maximum NAA peak. Left: The spectra for the semi-LASER EPSI acquired with the whole-body gradients. The magenta box indicates the VOI for semi-LASER localization. Right: The spectra for the silent EPSI sequence acquired with the gradient insert driven at 20 kHz, all spectra are scaled to the maximum NAA peak in the phantom. The cyan boxes indicate the voxels used for plotting the spectra in Figure 4.