2907
Ex vivo whole brain metabolic fingerprinting at 7T - protocol optimization and preliminary results1Highfield MR Centre, Department of Biomedical Imaging and Image-guided Therapy, Medical University of Vienna, Vienna, Austria, 2Christian Doppler Laboratory for Clinical Molecular MR Imaging, Vienna, Austria, 3Institute for Neurology, Medical University of Vienna, Vienna, Austria, 4Center for Brain Research, Institute of Neuroimmunology, Medical University of Vienna, Vienna, Austria
Synopsis
MRS has rarely been applied for postmortem measurements except for single-voxel studies, which can be explained by the fact that rapid degradation of metabolite levels makes scanning of fresh specimen highly critical.SVS contrary to MRSI cannot cover whole affected regions, while pathological changes may not be visible on anatomical images, yet. To investigate changes ex-vivo, a true whole-brain MRSI approach is critical. Our study shows the potential of ultra-highfield whole-brain FID-MRSI for metabolic fingerprinting of fresh postmortem brains for correlation with histology, as the link between neurochemical changes and underlying cell-types in many demyelinating/neurodegenerative disorders is still not fully understood.
Introduction
Despite its potential, MR spectroscopy(MRS) has rarely been applied for postmortem measurements except for single-voxel studies. These studies mainly dealt with the effect of postmortem interval(PMI) on the neurochemical composition of sheep brain[1,2], forensic applications in the context of ketoacidosis and intoxication[3,4,5] or psychological diseases such as schizophrenia in order to compare in-vivo MRS to ex-vivo biochemical analysis of tissue homogenates[6,7]. All of these studies try to correlate the biochemical composition seen in MRS with tissue samples, but never correlate the entire fresh postmortem brain to histology. Furthermore, single-voxel MRS has the weakness of potentially not covering emerging lesions, present in neurodegenerative diseases such as Multiple Sclerosis, that are often not yet visible on anatomical images. The purpose of our study was therefore to develop a protocol for ultra-high field whole-brain FID-MRSI of fresh postmortem brains for further correlation to their respective histology, while taking advantage of the increased spatial and spectral resolution at 7T. This is especially desirable as changes in neurochemical composition have been reported in many demyelinating/neurodegenerative disorders, but underlying cell-types are in many cases still a matter of speculation.Methods
Three fresh postmortem brains with no pathology were obtained from the Neuropathology Department of the Medical University of Vienna after approval of the institutional review board. To ensure best measurement conditions the postmortem sample was placed in a 18cm diameter plastic sphere filled with PBS. In order to minimize air bubbles the fresh brain was massaged while being submerged in PBS(Figure 1).Measurements were performed using a 7 T whole-body MR scanner(Magnetom; Siemens Healthcare, Erlangen, Germany) and a 32-channel head coil(NovaMedical, Wilmington, MA).
Prior to spectroscopic data collection, magnetic resonance imaging (MRI) optimized for ex vivo relaxation conditions was performed with axial FLAIR (voxel: 0,9mm isotropic; TR=8000ms; TE=270ms; FoV: 220mm; TI=1830ms) and 3D-MP2RAGE (voxel: 0,8x0,8x0,9mm; TR=5000ms; TE=3,84ms; FoV: 240mm; bandwidth=820Hz) with TI and bandwidth being optimized respectively to ensure good contrast of PBS to tissue and lower the influence of remaining air bubbles.
Whole-brain 3D FID-MRSI[8] was performed with TR/TE* 450/1.3ms; FOV 220x220x130mm3;VOI 220x220x80mm3;matrix size 80x80x53; 39° Ernst flip angle; 2778Hz spectral bandwidth; 1024 samples; WET watersuppression; 24:24min scan time.
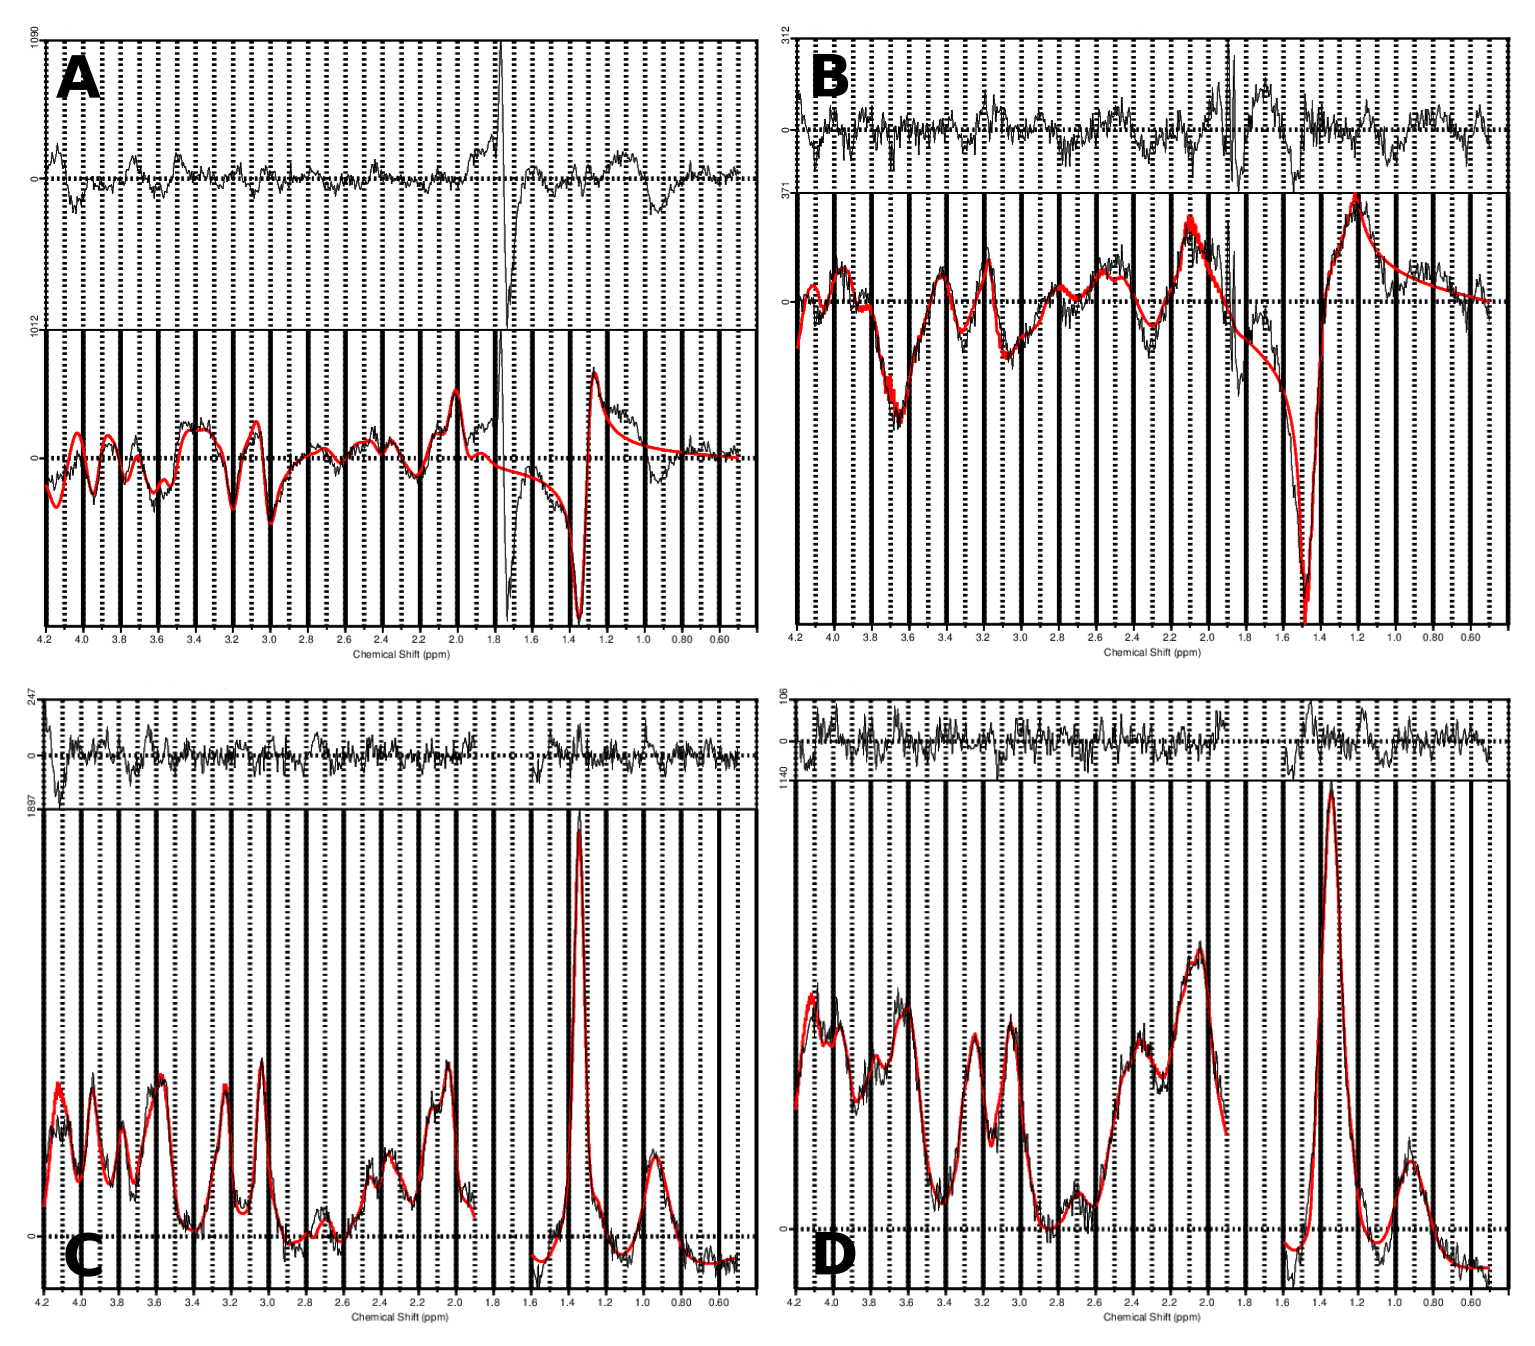
Inhouse developed MATLAB post-processing was performed including iMUSICAL coil combination[9] and Hamming filtered k-space weighting. The mask which was optained using FSL BET[13] was optimized to include the cerebellum. Within LCModel the spectral range 0.5-4.2ppm was fitted using a basis set of 17 metabolites and a measured macromolecule background[10].The lactate signal (quadruplet at 4.1 ppm and doublet at 1.32 ppm) which is very dominant in postmortem spectra due to anaerobic glycolysis, was used as reference peak, as the usual landmarks are missing or weak[5]. In order to cope with a waterside band artifact present at ~1.7ppm at 7T a spectral gap from 1.6 - 1.9ppm was introduced. Metabolic maps, quantification precision (Cramer-Rao Lower Bounds(CRLB)) and spectral quality(linewidth, SNR) were obtained.
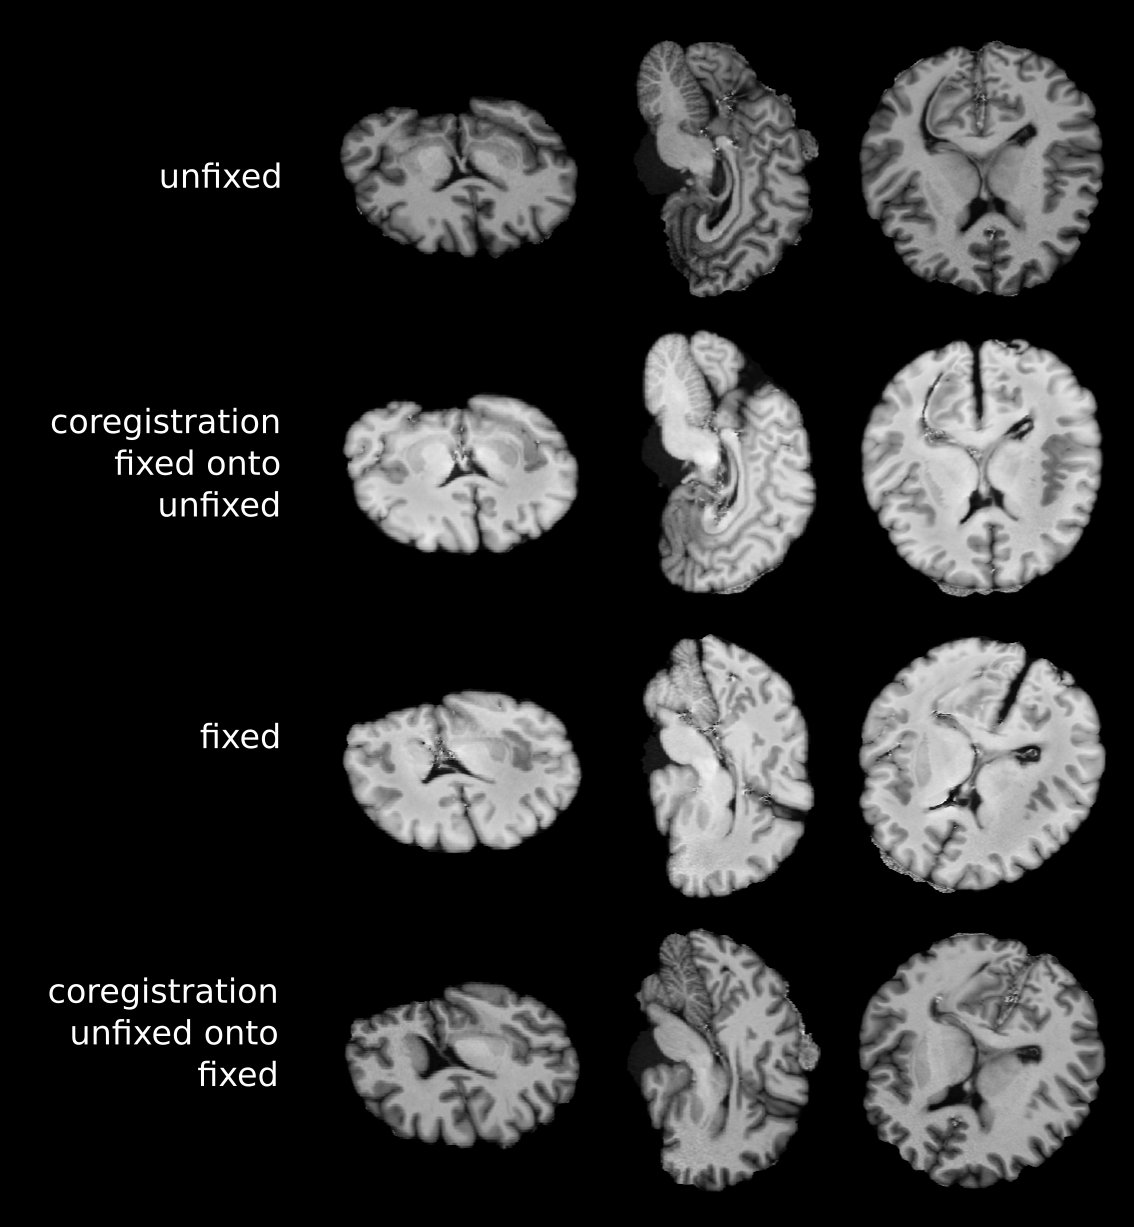
After the measurement, the fresh postmortem samples were immediately immersed in 10% formalin for 3 weeks of fixation. Due to tissue shrinkage, a MP2RAGE-remeasurement of the fixed brain was performed after being placed back into PBS in order to ensure the same measurement conditions. Co-registration was then achieved with a 12-DOF-affine-model using FSL FLIRT[11,12] after previous brain extraction with BET[13].
Results
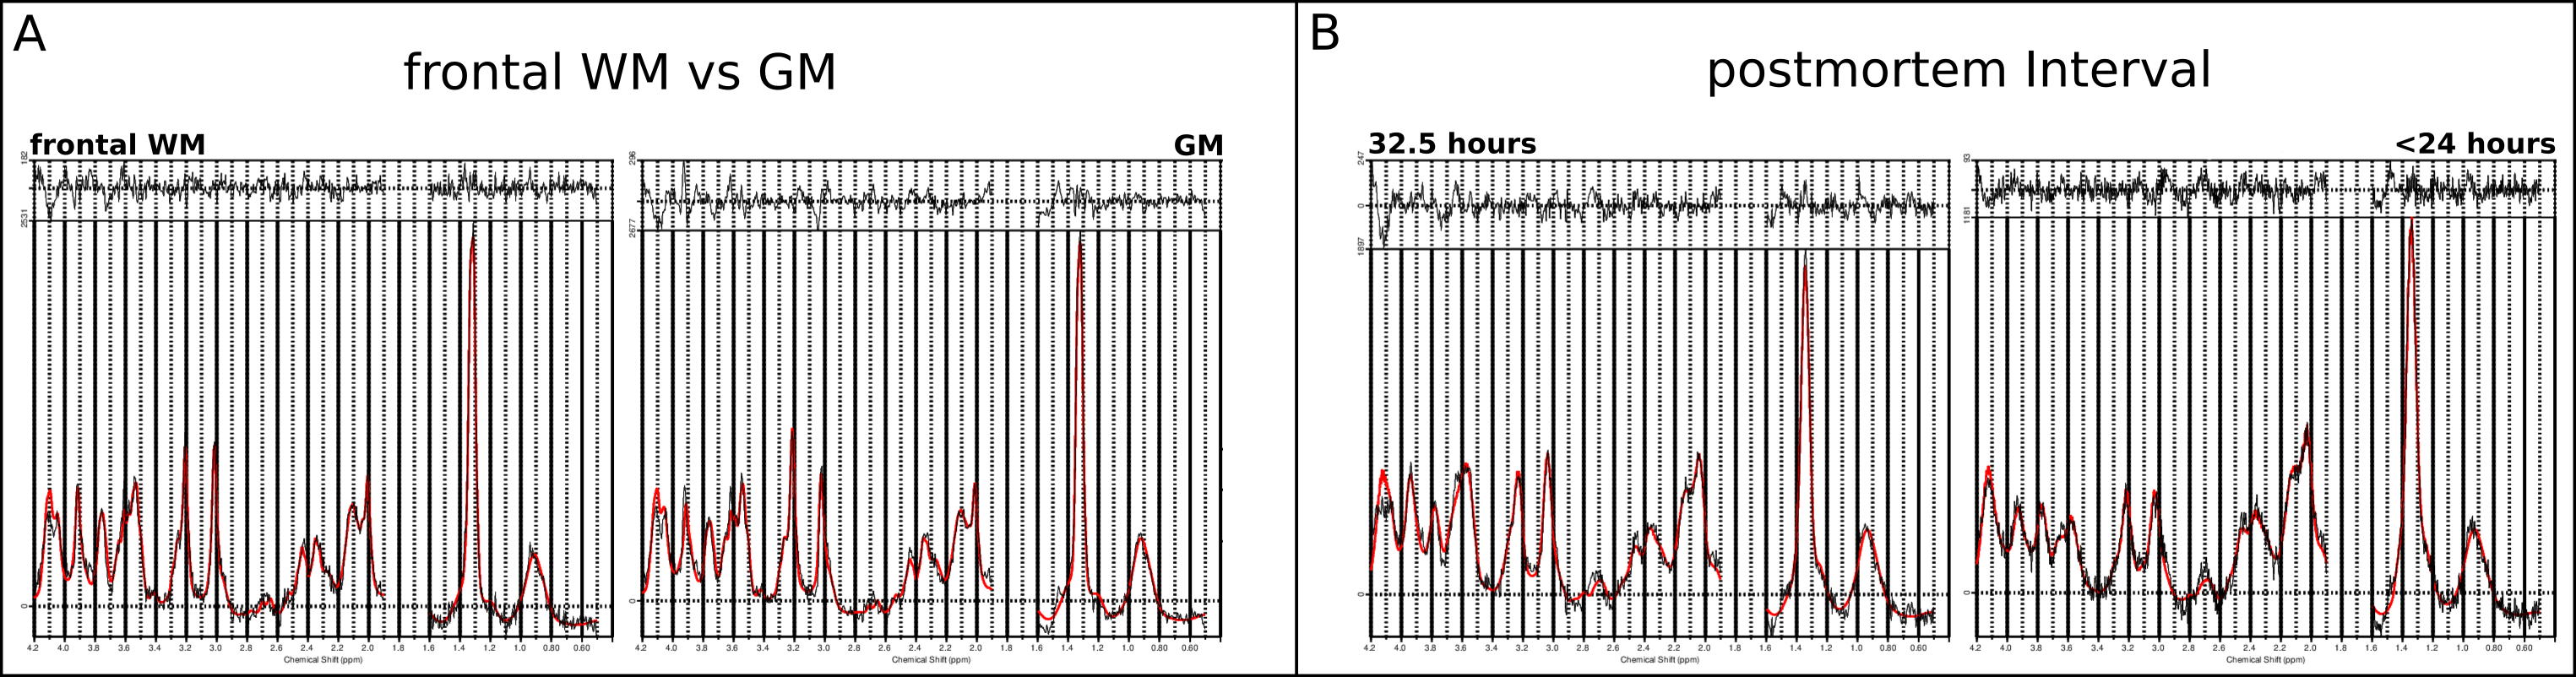
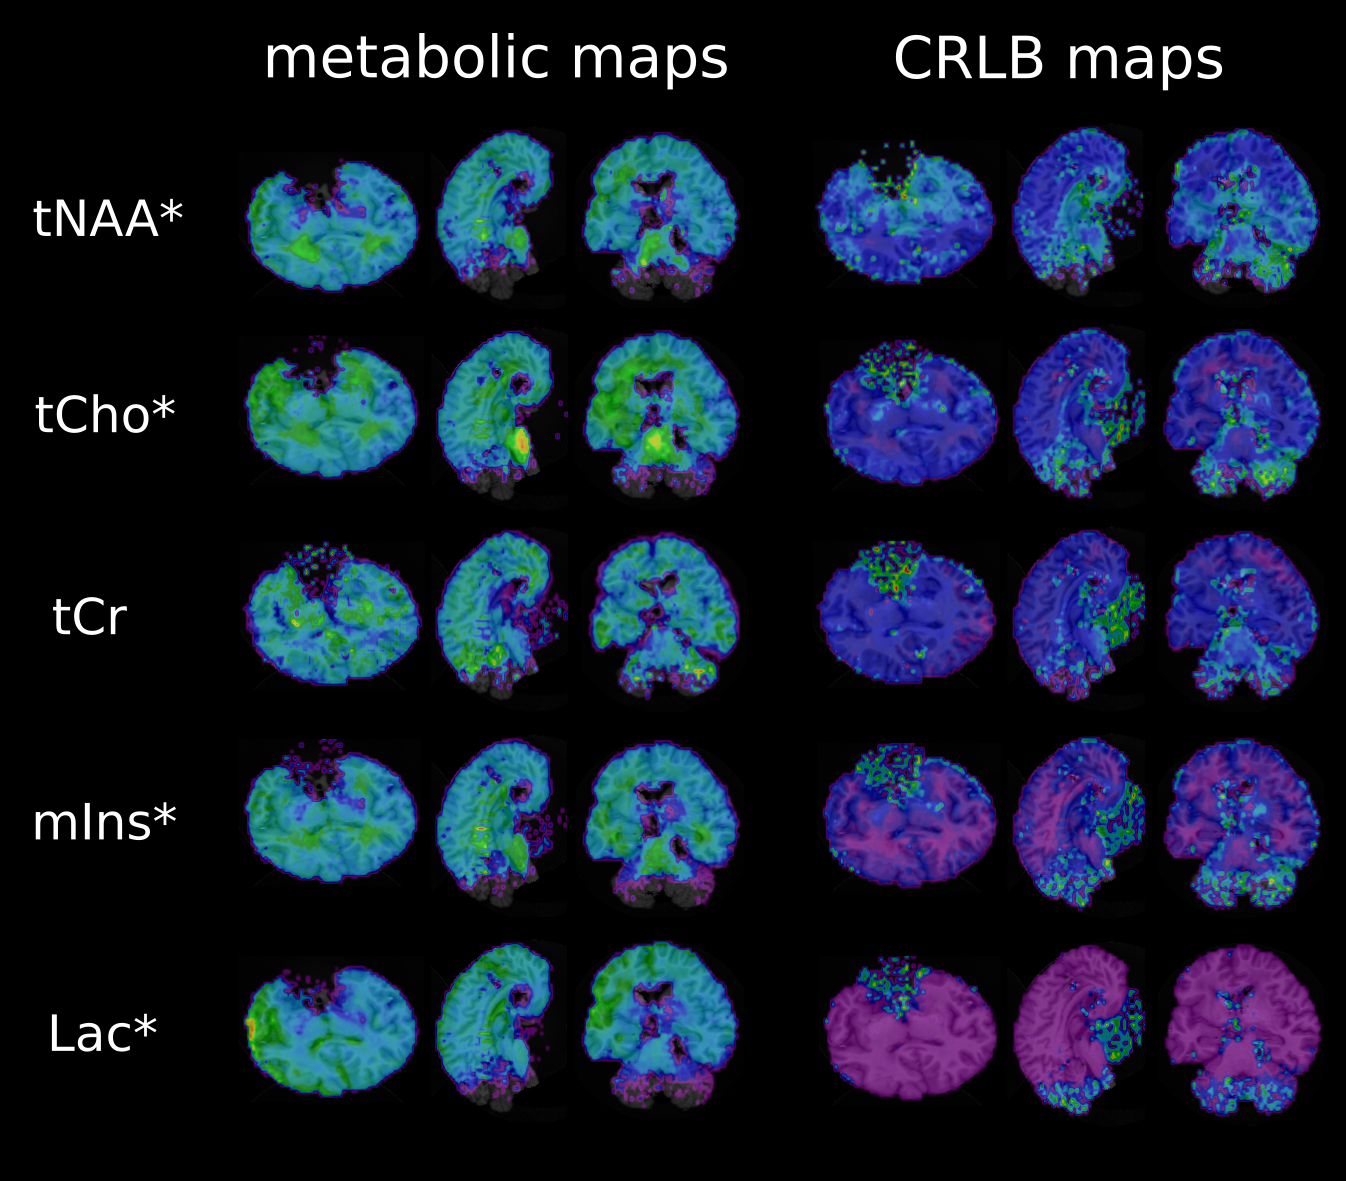
Unlike in in-vivo conditions, the absence of any extra-cranial lipids and different air/tissue interfaces substantially simplified the scanning resulting in fewer artifacts. Following post-processing optimization(Figure 2) high quality metabolic maps and respective CRLB maps of tNAA, tCho, tCr, mIns and Lac were obtained(Figure 5). It was possible to show, that the proportion of tCr and tCho in different brain regions (frontal WM and GM) remain as regularly seen in vivo(Figure 3). Nevertheless, a decrease of tNAA dependent on the postmortem interval(PMI) and a distinct increase in lactate could be observed with the fresher brain showing a more abundant tNAA peak(Figure 3) which is in accordance to literature[2]. Metabolites levels of several other metabolites (e.g., myo-inositol) appear to be similar. Co-registration between fresh and fixed postmortem brain were highly accurate(Figure 4).Discussion
To the best of our knowledge, this is the first attempt of postmortem measurements using a fresh whole-brain specimen in MR spectroscopy. Combining the full sensitivity signal detection of whole-brain FID-MRSI and the advantages of increased spatial and spectral resolution at 7T allowed metabolic mapping of a neurochemical profile in fresh postmortem brain even including the cerebellum. To account for the cerebellar contribution to pathologies the slab will even be enlarged in future measurements.Furthermore it was shown that it is beneficial to aim for postmortem samples with a low postmortem interval and proper cooling in order to achieve near in vivo tNAA concentrations. To attempt a correction for PMI, future measurements will additionally assess temporal changes in metabolite levels.
The successful co-registration enables future MRSI-histology correlation to link neurochemical changes with cell-type specific features, while the good SNR shows the feasibility of even higher spatial resolutions yielding voxel sizes below 2mm3 with measurement times ~30min.
Conclusion
7T ex vivo whole-brain metabolic fingerprinting may soon be able to correlate biochemical characteristics seen in pathologies such as Multiple Sclerosis and other demyelinating/neurodegenerative disorders with cell-type specific features identified by histology.Acknowledgements
No acknowledgement found.References
[1]
Ith et al., Magnetic Resonance in Medicine 2002; doi:
10.1002/mrm.10294
[2]
Ith et al., NMR in Biomedicine 2010; doi: 10.1002/nbm.1623
[3]
Heimer et al., Journal of Forensic and Legal Medicine 2018; doi:
10.1016/j.jflm.2018.07.009
[4]
Heimer et al., International Journal of Legal Medicine 2018; doi:
10.1007/s00414-017-1741-0
[5] Zoelch et al., NMR in Biomedicine
2019; doi: 10.1002/nbm.4081
[6]
Sullivan et al., Nature 2019; doi: 10.1038/s41598-019-41572-9
[7]
Halim et al., Journal of Neuroscience Methods 2008; doi:
10.1016/j.jneumeth.2007.11.017
[8]
Hingerl et al., Magnetic Resonance in Medicine 2018; doi:
10.1002/mrm.26987
[9]
Moser et al., Magnetic Resonance in Medicine 2019; doi:
10.1002/mrm.27822
[10]
Povazan et al., Neuroimage 2015; doi:
10.1016/j.neuroimage.2015.07.042
[11]
M. Jenkinson and S.M. Smith, Medical Image Analysis 2001; doi:
10.1016/S1361-8415(01)00036-6
[12]
M. Jenkinson et al., NeuroImage
2002;
doi: 10.1006/nimg.2002.1132
[13] S.M.
Smith, Human Brain Mapping 2002; doi: 10.1002/hbm.10062
Figures