2905
High-Resolution Whole-Brain 3D Magnetic Resonance Spectroscopic Imaging1Radiology, University of Miami, Miami, FL, United States, 2Biomedical and Metabolic Imaging Branch, The National Institute of Diabetes and Digestive and Kidney Diseases (NIDDK), Bethesda, MD, United States, 3Center for Magnetic Resonance & Optical Imaging, Perelman School of Medicine, University of Pennsylvania, Philadelphia, PA, United States, 4Department of Radiology and Oncology, Johns Hopkins University School of Medicine, Baltimore, MD, United States, 5Department of Radiation Oncology, Emory University School of Medicine, Atlanta, GA, United States
Synopsis
Whole-brain Magnetic Resonance Spectroscopic Imaging (MRSI) is an effective technique for non-invasive quantification of brain metabolite levels 1-3 that can be used to create maps for the study of both regional or diffuse metabolic alterations in various pathologies. Improved spatial resolution can result in significantly better mapping but is often limited by the signal-to-noise ratio (SNR). This abstract presents a whole-brain 3D MRSI acquisition scheme that uses hypergeometric dual-band (HGDB) pulses for lipid suppression over the brain volume, real-time frequency drift correction, and novel post-processing methods to generate whole-brain metabolite maps in humans at 3T.
Purpose
Current widely-used whole-brain 3D MRSI techniques are based on an echo-planar acquisition with spin-echo excitation, chess based water suppression, non-selective lipid inversion-nulling, and GRAPPA based acceleration with nominal voxel sizes of 5.6x5.6x10 mm in the left-right, anterior-posterior, and head-foot directions, respectively and an acquisition time of 15 min. This study presents a novel acquisition scheme that increases SNR to enable the generation of higher-resolution MRSI metabolite maps (nominal voxel volume = ~75 mm3) using dual-band water and lipid suppression.Methods
Seven subjects (5 healthy controls and 2 with lesions) were imaged using the new acquisition scheme. Volumetric whole-brain MRSI was acquired with TR = 950 ms and TE of 17.6 or 50 ms. Water and lipid suppression were carried out using the hypergeometric dual-band pulses 4 to create a passband between 1.8 and 4.2 ppm with Mz/Meq >0.99 with Bloch equation simulations to derive the parameters for the individual HG pulses. Real-time frequency measurement and adjustment were carried out by sampling the water frequency every TR. The removal of inversion based lipid nulling resulted in a significant improvement in SNR that enabled higher spatial sampling in the phase encoding direction to yield an nominal resolution of 2.65x5.2x5.45 mm with a FOV of 170x260x120 mm left-right, anterior-posterior, and head-foot directions, respectively with a nominal voxel volume of 75.16 mm3 with an acquisition time of 15 minutes using a GRAPPA factor of 1.3 in the phase-encoding direction.MRSI data were processed using the MIDAS package (http://mrir.med.miami.edu).2,5 This included B0 and phase correction using the water reference data prior to any further processing in the frequency domain. Additional processing included generating masks for brain and lipid regions, k-space extrapolation to reduce the contribution of extracranial lipid into the brain,6 a spectrally selective lipid suppression scheme using Hankel Lanczos Singular Value Decomposition (HLSVD) 7, linear registration between the T1-weighted MR and MRSI, and signal intensity normalization following the creation of individual metabolite maps. The spectral datasets were interpolated to 128x128x48 points and spatial smoothing was applied after B0 correction. Automated spectral analysis was carried out for N-acetylaspartate (NAA), creatine and phosphocreatine (Cr), choline, glycerophosphocholine, and phosphocholine (Cho).8 Additional maps were generated for the fitted spectral linewidth and the Cramer-Rao lower bounds (CRLB) of fitting for each metabolite.
Results and Discussion
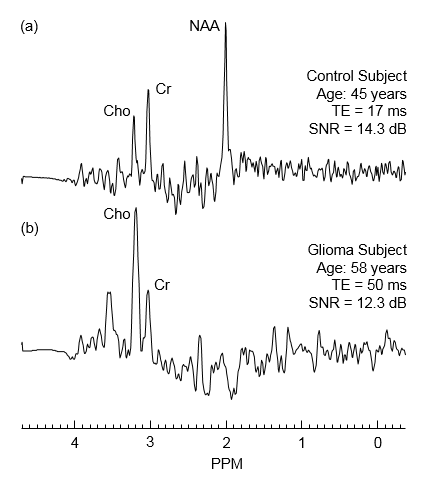
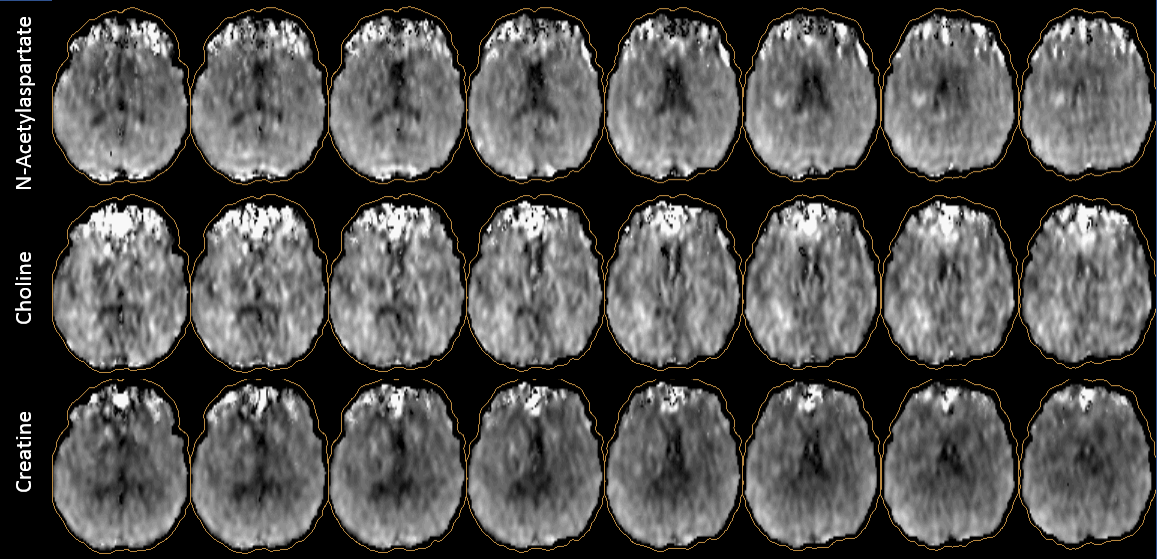
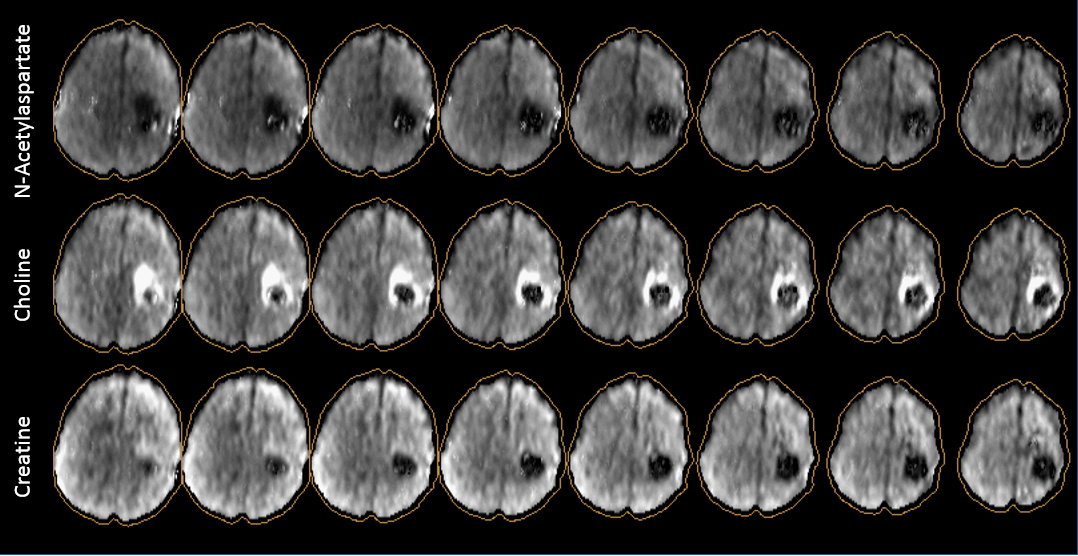
The new acquisition methods delivered excellent quality spectra as seen in Figure 1 with Figure 1a showing a short TE spectrum from normal white matter areas in a control subject whereas Figure 1b shows a TE 50ms spectrum from a patient with high-grade glioma. The Ernst angle of the excitation pulse was set according to the TR for both acquisitions. SNR estimated as the ratio of the area under the NAA (or Cho in the absence of NAA) peak to the standard deviation of the noise signal estimated between 0 to 1.2 ppm is reported besides the spectra 1. SNR is expressed in decibels (dB) as 10*log10(SNR).Good coverage was observed across the brain with improved performance compared to previous lower resolution implementations of the MRSI sequence as evident from metabolite maps for a control subject (Figure 2) and a patient with high-grade glioma (Figure 3). NAA maps do show some artifacts from lipid components that are not suppressed by the HGDB pulses that overlap with metabolites which resonate between 2.0 and 3.1 ppm. Brain coverage (defined as the percentage of brain voxels with linewidths of <13 Hz) of 73.7 +/- 6.8% (Range 64.5% to 84.7%) was obtained in the 7 datasets.
Previous MRSI methods that employ multiple OVS bands to reduce lipid signals, or those using sparse reconstruction based techniques, are often limited in their ability to map cortical regions. Moreover, lower resolution whole-brain approaches also perform poorly in cortical regions due to lipid bleeding and partial volume effects 9. As seen in Figure 2 the current approach provides excellent mapping of the cortical regions. The high-resolution MRSI in the glioma case of Figure 3 shows the potential for better delineation of tumor boundaries, for instance for improved guidance of biopsies or radiation treatment planning.
Acknowledgements
This work was supported by National Institute of Health (NIH) grants R01CA172210, R01EB016064, NIBIB U01EB028145References
1. Goryawala MZ, Sheriff S, Maudsley AA. Regional distributions of brain glutamate and glutamine in normal subjects. NMR Biomed 2016;29(8):1108-1116.
2. Maudsley AA, Domenig C, Govind V, et al. Mapping of brain metabolite distributions by volumetric proton MR spectroscopic imaging (MRSI). Magn Reson Med 2009;61(3):548-559.
3. Sabati M, Sheriff S, Gu M, et al. Multivendor implementation and comparison of volumetric whole-brain echo-planar MR spectroscopic imaging. Magn Reson Med 2015;74(5):1209-1220.
4. Zhu H, Ouwerkerk R, Barker PB. Dual-band water and lipid suppression for MR spectroscopic imaging at 3 Tesla. Magn Reson Med 2010;63(6):1486-1492.
5. Maudsley AA, Darkazanli A, Alger JR, et al. Comprehensive processing, display and analysis for in vivo MR spectroscopic imaging. NMR Biomed 2006;19(4):492-503.
6. Haupt CI, Schuff N, Weiner MW, Maudsley AA. Removal of lipid artifacts in 1H spectroscopic imaging by data extrapolation. Magn Reson Med 1996;35(5):678-687.
7. Goryawala M, Maudsley AA, Sheriff S. Lipid Suppression in 3D Magnetic Resonance Spectroscopic Imaging. 2017; Honolulu, HI, USA.
8. Soher BJ, Young K, Govindaraju V, Maudsley AA. Automated spectral analysis - III: application to in vivo proton MR spectroscopy and spectroscopic imaging. Magn Reson Med 1998;40(6):822-831.
9. Goryawala
MZ, Sheriff S, Stoyanova R, Maudsley AA. Spectral decomposition for resolving
partial volume effects in MRSI. Magn Reson Med 2018;79(6):2886-2895.
Figures