2902
Optimal phased-array signal combination for polyunsaturated fatty acids measurement in breast cancer using MQC MR Spectroscopy at 3T1Institute of Medical Sciences, School of Medicine, University of Aberdeen, Aberdeen, United Kingdom, 2Department of Clinical Radiology, Aberdeen Royal Infirmary, Aberdeen, United Kingdom, 3Department of Radiology, Royal Marsden Hospital, London, United Kingdom, 4Breast Unit, Aberdeen Royal Infirmary, Aberdeen, United Kingdom
Synopsis
Phased-array signal combination algorithms of adaptively optimised combination (AOC), noise decorrelated combination (nd-comb), whitened singular value decomposition (WSVD), S/N2, S/N, and Signal Weighting, were evaluated for enhancing the SNR of polyunsaturated fatty acids spectra acquired using MQC MRS from breast cancer. Data were acquired from seventeen breast tumours excised from patients, fifteen healthy volunteers and five patients with breast cancer. AOC yielded the maximum SNR improvement and was independent from voxel volume, PUFA content, or water/fat ratio. AOC improved SNR by 24% (relative to non-noise decorrelated algorithms) and shortened acquisition time in patients by 1.5 times while maintaining SNR.
Introduction
Polyunsaturated fatty acid (PUFA) is a key marker for cancer treatment monitoring1. PUFA measurement in breast cancer using conventional magnetic resonance spectroscopy (MRS) is not feasible, due to the overwhelming signals of water2. Multiple quantum coherence (MQC) MRS suppresses water effectively, but sacrifices half of the acquired signal2. Further compounded by the depletion of lipids and in turn low abundance of PUFA in tumour3, improvement in SNR is essential. The combination of signals acquired from phased array coils provides an effective approach for improving SNR4. Investigations on phased-array combination algorithms have focused so far on conventional MRS in the brain5-8, with significant different spectral appearance and metabolite composition compared to breast. We therefore systematically examined current combination algorithms on PUFA spectra acquired using MQC MRS in breast tumours.Methods
Seventeen invasive ductal carcinoma specimens (8 grade II and 9 grade III) freshly excised from patients with breast cancer (mean age, 61 years; age range, 42–78 years) with wide local excision surgery, fifteen healthy female volunteers (mean age, 66 years; age range, 58–76 years) and five patients (mean age, 65 years; age range, 59–69 years) with invasive ductal carcinoma (3 grade II and 2 grade III) were enrolled in the study. The study was approved by the NHS Research Ethics Committee, and written informed consent was obtained from each participant prior to the study.Data Acquisition: Single voxel MRS data were acquired on a 3 T MRI scanner (Achieva TX, Philips Healthcare, Best, Netherlands). The ex vivo and in vivo experiments were performed using a 32-phased array coil and a 16-phased array breast coil respectively. PUFA spectrum was acquired using MQC PRESS sequence with repetition time (TR) of 1250 ms, echo time (TE) of 130 ms, 1024 data points, spectral bandwidth of 2000 Hz. Reference spectra without water suppression were acquired using single voxel PRESS sequence with TR/TE of 1250/144 ms, 1024 data points, spectral bandwidth of 2000 Hz. Data were collected from both breasts in volunteers with a voxel size of 2×2×2 cm3 containing mainly the adipose tissue. In specimens and patients, the voxel was positioned snug fit to the tumour.
Data Processing: Raw data were processed using in house software written in MATLAB (MathWorks, Natick, MA, USA) using the algorithms of adaptively optimised combination (AOC)6, noise decorrelated combination (nd-comb)7, whitened singular value decomposition (WSVD)8, S/N2, S/N, Signal, and Equal Weighting5. The amplitude and phase shift were determined from the dominant peak (either water at 4.7 ppm or lipid at 1.3 ppm) in the reference spectrum. The SNR of each combined spectrum was defined as the PUFA peak height divided by the standard deviation of the real part of spectrum within the range of 9.0 - 10.6 ppm. The SNR improvement was defined as percentage increase of SNR referenced to the SNR derived from the Equal Weighting algorithm (baseline). Water, methyl fat (0.9 ppm) and methylene fat (1.3 ppm) from the reference spectrum and PUFA were quantified using AMARES algorithm9 in jMRUI software (v5.0, TRANSACT, Leuven, Belgium)10. PUFA content was expressed as percentage ratio of PUFA divided by the sum of methyl and methylene fat in reference spectrum. Water to fat ratio was defined as the ratio of water divided by the total lipids. In patients, the mean SNR for each repeated acquisition was computed across all the 5 patients using AOC and S/N2 Weighting.
Statistical Analysis: Statistical analysis was performed in SPSS (Release 24.0, SPSS Inc., Chicago, USA). For normally distributed data, a repeated measures ANOVA test was performed to assess the group difference between the algorithms while Wilcoxon signed-rank tests were used for non-normally distributed data. Spearman’s rank tests were further performed to examine the dependency of the SNR improvement, derived from the optimal algorithm, on PUFA content, voxel volume, and water/fat ratio. A p-value < 0.05 was considered as statistically significant.
Results
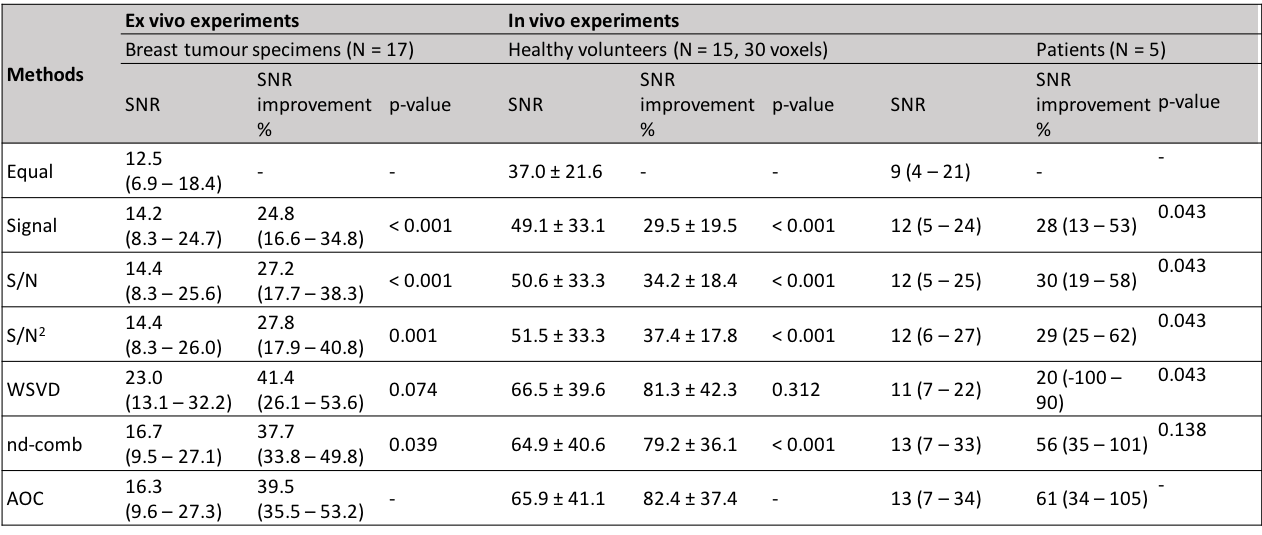
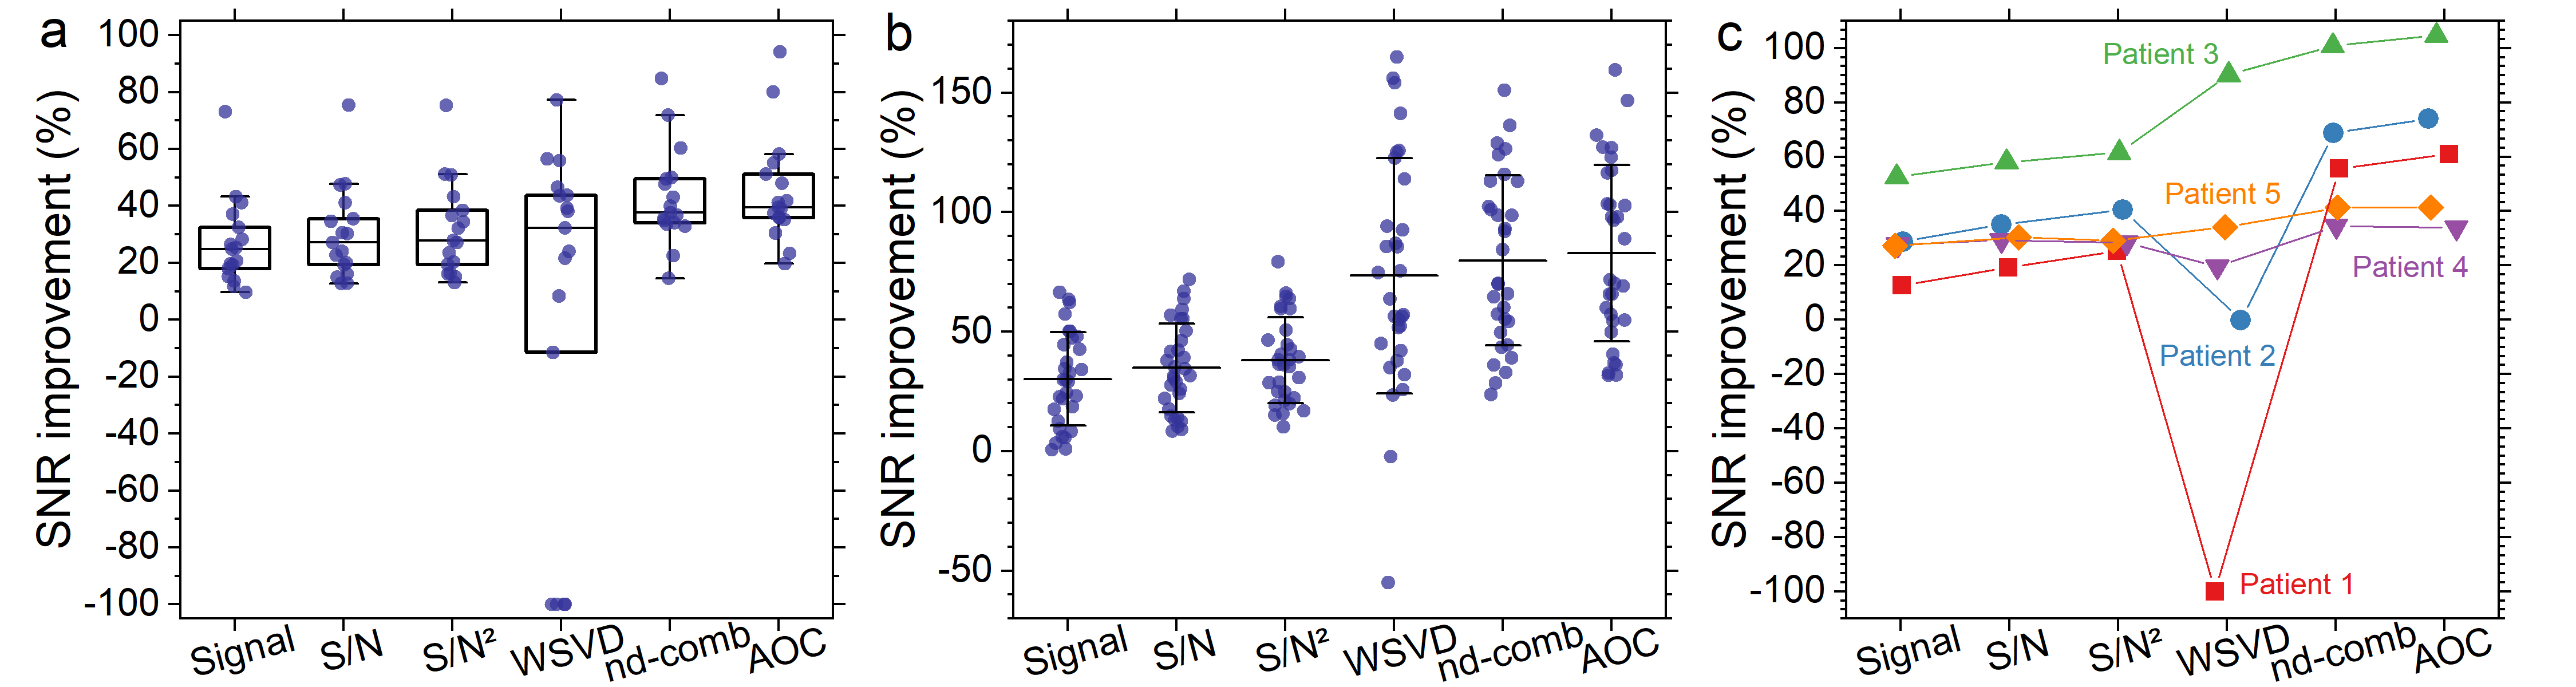
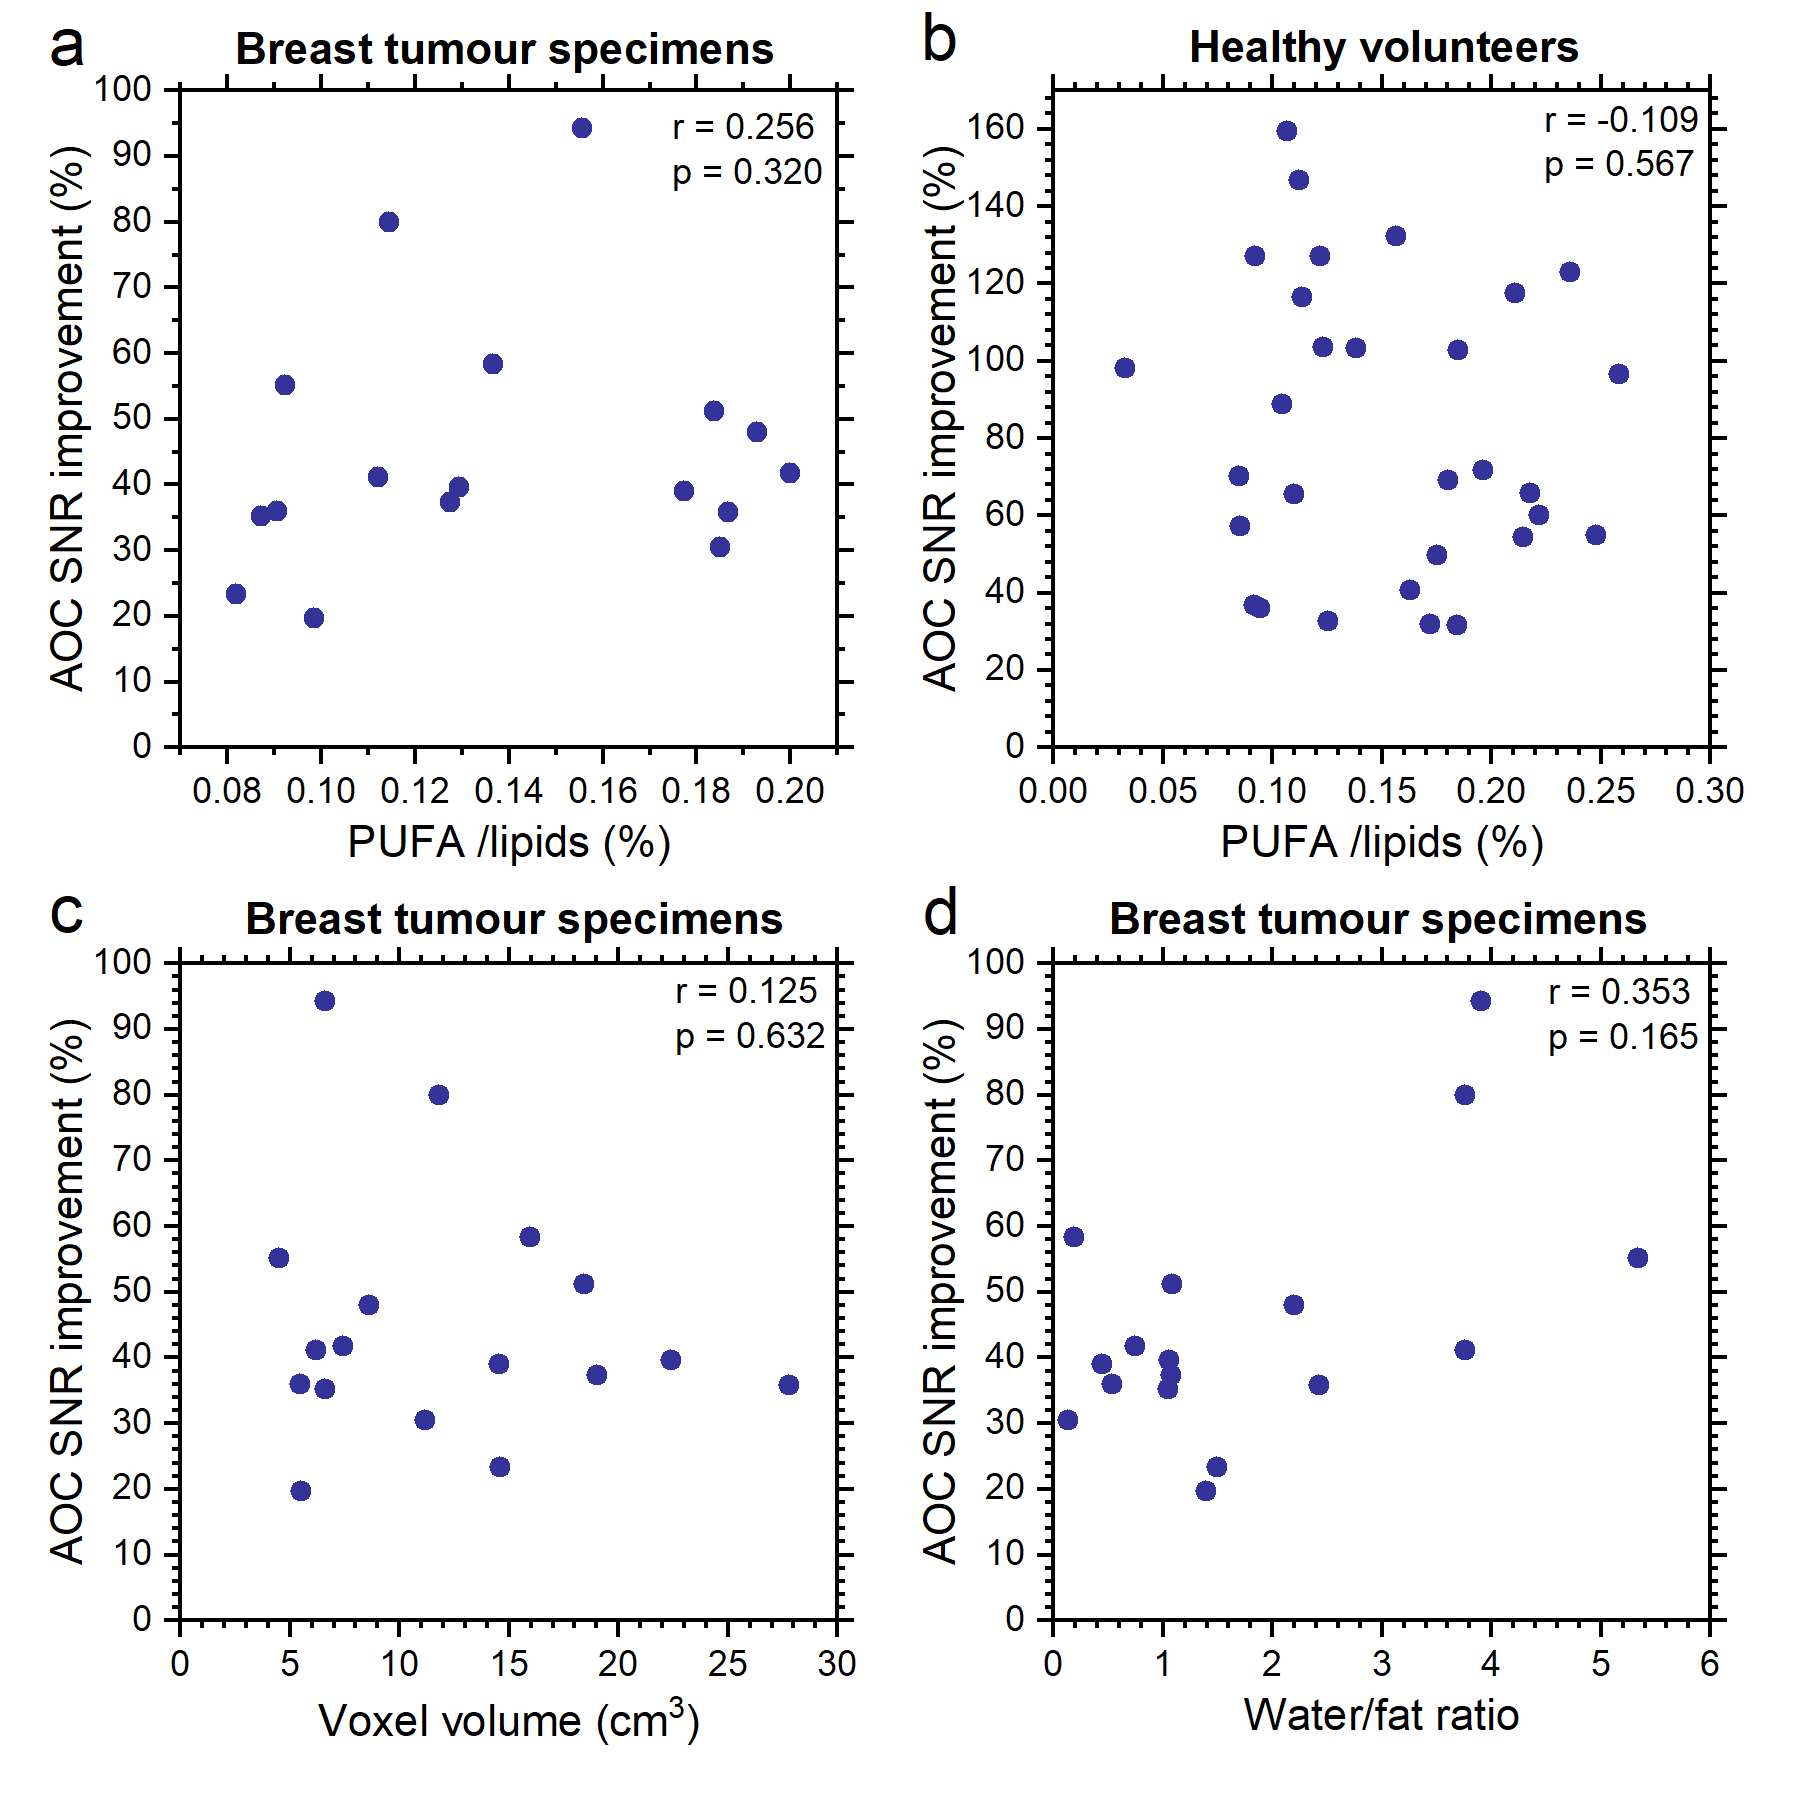
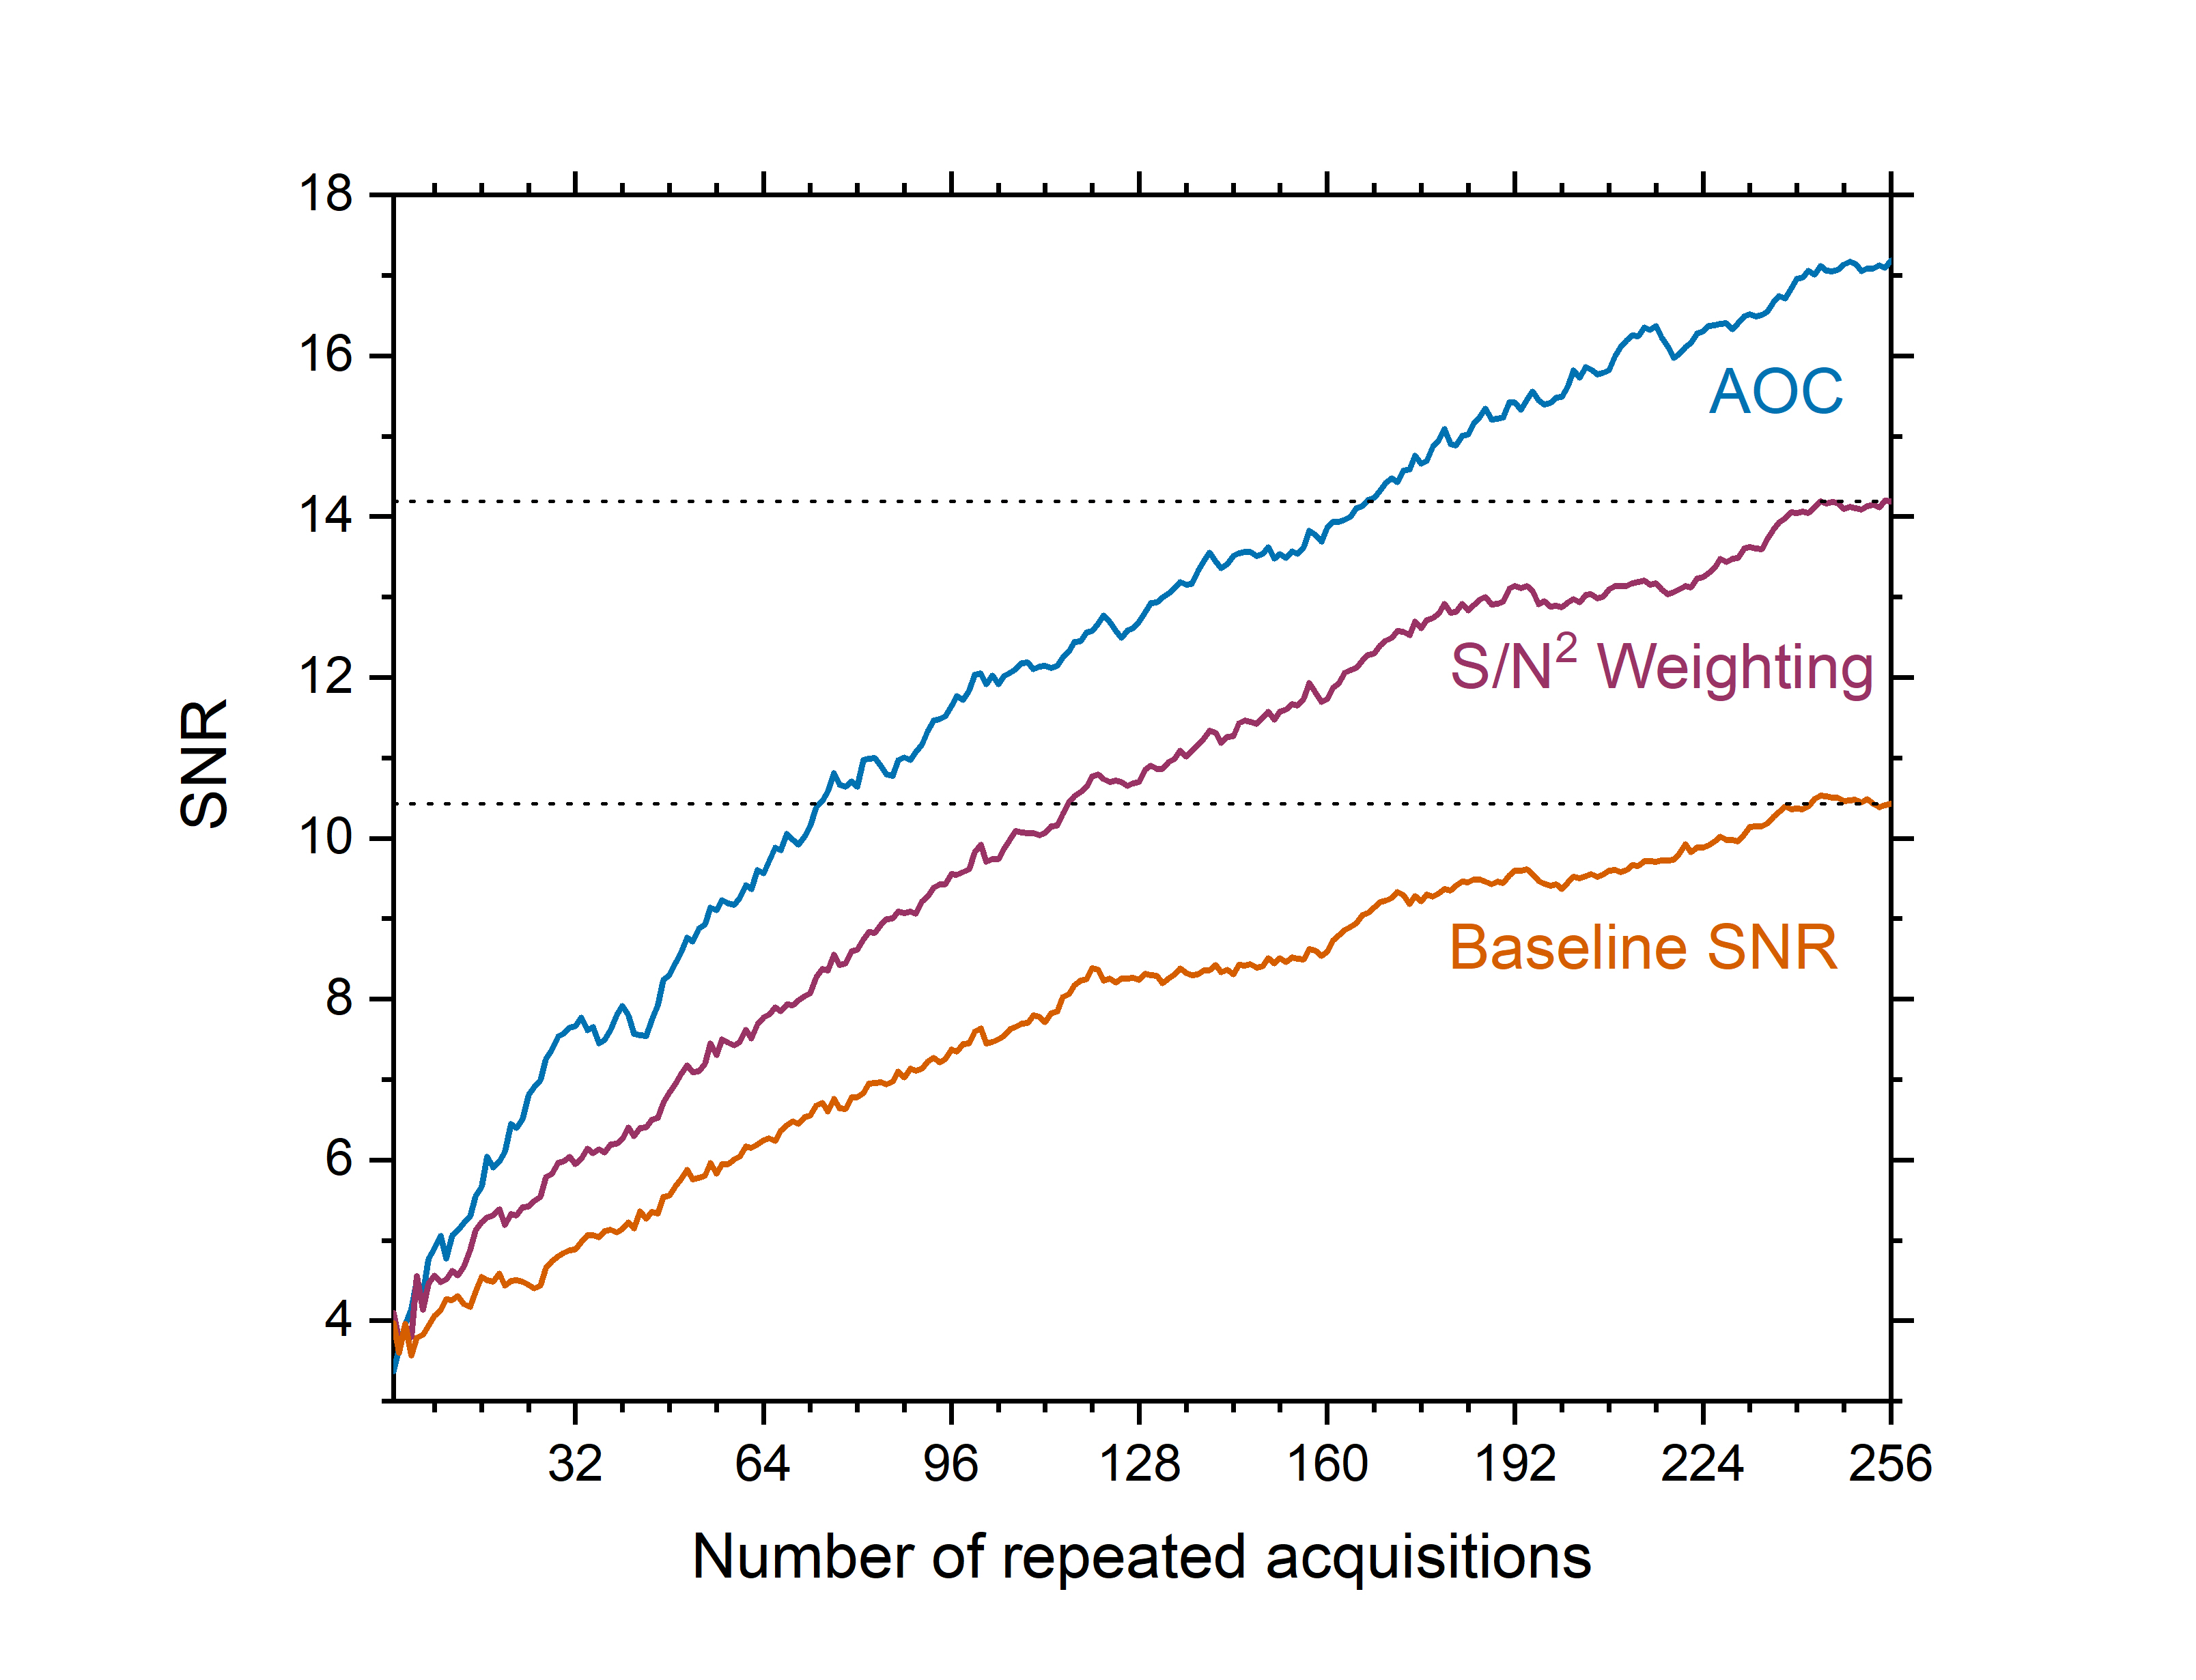
AOC yielded the maximum SNR improvement in specimens (median, 39.5%; interquartile range: 35.5–53.2%, p<0.05), volunteers (82.4 ± 37.4%, p<0.001), and patients (median, 61%; range: 34–105%) (Table 1, Figure 1). There was no significant correlation between the SNR improvement from AOC against PUFA content for breast tumour specimens (Figure 2a) or healthy volunteers (Figure 2b), voxel volume (Figure 2c) and water/fat ratio in breast tumour specimens (Figure 2d). Using AOC, the number of repeated acquisitions for PUFA spectra could be as low as 175 (117 – 185) instead of 256 to achieve same output SNR as S/N2 Weighting (Figure 3). Hence, AOC improves SNR by 24% (4-28%) and therefore PUFA acquisition in patients could be 1.5 times faster compared to S/N2 Weighting.Discussion
AOC, among current algorithms, yielded the highest SNR improvement in excised breast tumours, healthy volunteers and patients. Moreover, AOC showed robustness against voxels with relatively low baseline SNR. AOC can be used for breast tumours with wide range of volumes, PUFA, water or fat contents, demonstrating the applicability in clinical settings.Conclusion
AOC is the optimal algorithm for PUFA spectra acquired using MQC MRS in breast to improve quantification accuracy or reduce acquisition time.Acknowledgements
The author would like to thank Dr Matthew Clemence (Philips Healthcare Clinical Science, UK) for clinical scientist support, Ms Bolanle Brikinns, Ms Louisa Pirie, Ms Linda Lett, and Ms Kate Shaw for patient recruitment support, Ms Dawn Younie for logistic support, Mr Roger Bourne and Ms Mairi Fuller for providing access to the patients as well as Mrs Beverly MacLennan, Mrs Nichola Crouch, Mr Mike Hendry, and Ms Laura Reid for radiographer support.References
1. Schmitz JE, Kettunen MI, Hu D-E, Brindle KM. 1H MRS-visible lipids accumulate during apoptosis of lymphoma cells in vitro and in vivo. Magn Reson Med. 2005;54(1):43-50.
2. He Q, Shkarin P, Hooley RJ, Lannin DR, Weinreb JC, Bossuyt VIJ. In vivo MR spectroscopic imaging of polyunsaturated fatty acids (PUFA) in healthy and cancerous breast tissues by selective multiple-quantum coherence transfer (Sel-MQC): A preliminary study. Magn Reson Med. 2007;58(6):1079-1085.
3. Hartz JW, Morton RE, Waite MM, Morris HP. Correlation of fatty acyl composition of mitochondrial and microsomal phospholipid with growth rate of rat hepatomas. Lab Invest. 1982;46(1):73-78.
4. Roemer PB, Edelstein WA, Hayes CE, Souza SP, Mueller OM. The NMR phased array. Magn Reson Med. 1990;16(2):192-225.
5. Hall EL, Stephenson MC, Price D, Morris PG. Methodology for improved detection of low concentration metabolites in MRS: Optimised combination of signals from multi-element coil arrays. NeuroImage. 2014;86:35-42.
6. Fang L, Wu M, Ke H, Kumar A, Yang S. Adaptively optimized combination (AOC) of magnetic resonance spectroscopy data from phased array coils. Magn Reson Med. 2015;75(6):2235-2244.
7. Martini N, Santarelli MF, Giovannetti G, et al. Noise correlations and SNR in phased-array MRS. NMR Biomed. 2010;23(1):66-73.
8. Rodgers CT, Robson MD. Receive array magnetic resonance spectroscopy: Whitened singular value decomposition (WSVD) gives optimal Bayesian solution. Magn Reson Med. 2010;63(4):881-891.
9. Vanhamme L, van den Boogaart A, Van Huffel S. Improved method for accurate and efficient quantification of MRS data with use of prior knowledge. J Magn Reson. 1997;129(1):35-43.
10. Naressi A. Java-based graphical user interface for the MRUI quantitation package. Magnetic Resonance Materials in Biology, Physics, and Medicine. 2001;12(2-3):141-152.
Figures