2897
MODIFIED HERCULES MULTI-METABOLITE EDITING with SEMI-LASER LOCALIZATION at 3T
Steve CN Hui1,2, Muhammad G Saleh1,2, Georg Oeltzschner1,2, Mark Mikkelsen1,2, Sofie Tapper1,2, and Richard AE Edden1,2
1Russell H. Morgan Department of Radiology and Radiological Science, The Johns Hopkins University, Baltimore, MD, United States, 2F.M. Kirby Research Center for Functional Brain Imaging, Kennedy Krieger Institute, Baltimore, MD, United States
1Russell H. Morgan Department of Radiology and Radiological Science, The Johns Hopkins University, Baltimore, MD, United States, 2F.M. Kirby Research Center for Functional Brain Imaging, Kennedy Krieger Institute, Baltimore, MD, United States
Synopsis
An improved editing scheme was proposed for the Hadamard Editing Resolves Chemicals Using Linear-combination Estimation of Spectra (HERCULES). The original editing pulse at 4.18 ppm was replaced by a new wider-band pulse at 4.04 ppm to facilitate signal acquisition for aspartate, ascorbate and lactate. Furthermore, the new scheme (HERCULES-2) was implemented within the semi-LASER and PRESS sequences. HERCULES-2 with semi-LASER yielded increases in overall signal intensities in most targeted metabolites, robust to B1 inhomogeneity, facilitating the precise quantification of edited spectra.
Introduction
Hadamard Editing Resolves Chemicals Using Linear-combination Estimation of Spectra (HERCULES) is a multiplexed J-difference editing scheme, originally implemented with PRESS localization1. The Hadamard combinations of four sub-experiments with different editing pulse profiles allow the edited detection of multiple low-concentration brain metabolites including γ-aminobutyric acid (GABA), aspartate (Asp), ascorbate (Asc), lactate (Lac), N-acetylaspartate (NAA), N-acetylaspartylglutamate (NAAG) and glutathione (GSH). In the original HERCULES editing scheme, dual- and single-band editing pulses with the same bandwidth are applied at 1.90 ppm (targeting GABA), and 4.58 ppm (targeting GSH and NAAG) and 4.18 ppm (targeting Asp, Asc, Lac), symmetrically about 4.38 ppm to facilitate the measurement of NAA. This original scheme suffers from inefficient editing of Asp and Asc and signal losses associated with PRESS localization, particularly for Lac2,3. In this abstract, we propose a new sequence, HERCULES-2, which uses semi-LASER4 localization and has an improved editing scheme with a broader inversion lobe around 4 ppm (targeting Asp, Asc and Lac).Methods
To improve the editing efficiency for Asc and Asp, the HERCULES editing lobe at 4.18 ppm (sub-experiments B and D) was replaced by a new wider-band lobe centered on 4.04 ppm, while maintaining the original lobes at 4.58 ppm and 1.90 ppm and the inversion symmetry at 4.38 ppm for NAA as shown in Figure 1a. Sub-experiments applied 20-ms editing pulses at: (A) 4.58 ppm; (B) 4.04 ppm; (C) 4.58 and 1.9 ppm; and (D) 4.04 and 1.9 ppm with corresponding waveforms in the time domain as shown in Figure 1b. Full-width half-maximum (FWHM) inversion bandwidth was 61.9 Hz for the inversion lobes at 1.90 and 4.58 ppm, and 97.7 Hz for the lobe at 4.04 ppm. A cosine modulation was used to generate the symmetrical dual-band pulse for sub-experiment C. The single-band sinc-Gaussian editing pulse for sub-experiment A was frequency-shifted to 1.9 ppm and added to B to generate the asymmetric dual-band pulse required for sub-experiment D. The editing pulses were added to semi-LASER localization as shown in the pulse sequence diagram in Figure 1c. Adiabatic refocusing pulses with sweep width/duration 8000 Hz/4 ms, bandwidth 2970Hz, and peak B1 13.5 mT were used.Simulations
To quantify signal efficiency between the original editing pulse (HERCULES-1) and the wider-band pulse (HERCULES-2), simulations were conducted for the targeted metabolites as well as total creatine (tCr) using the FID-A toolbox with accelerated simulation using the one-dimensional projection method5,6. Ideal excitation, experimental refocusing and editing pulses were used. Each simulation was performed on a 21 x 21 matrix covering 4.5 x 4.5 cm2 (i.e., the voxel length plus 50% in each dimension). Signals from HERCULES-1 and -2 with PRESS localization were compared using the tCr signal from the sum spectrum as the reference. A second comparison was performed for HERCULES-2 between PRESS and semi-LASER localization. Simulations were carried out at the voxel center for the same targeted metabolites. Two additional sets of simulations were performed using 90% and 110% of the correct B1 for both PRESS and semi-LASER to test the effect of B1 variation.
In vivo testing
Four healthy volunteers (female/male: 1/3) were scanned in a 3T Philips MR scanner with TR/TE 3000/80 ms; spectral width 2000 Hz; 2048 datapoints; 160 transients; CHESS water suppression and a 27-mL voxel in the medial parietal lobe, as shown in Figure 2. Data were analyzed using Gannet7. NAA linewidth at full-width half-maximum and signal-to-noise ratio (SNR) estimations from the HERCULES-2 PRESS and semi-LASER data were calculated.
Results
For simulations, signal ratios of Lac/tCr, Asp/tCr and Asc/tCr increased by 8.5%, 80.8% and 21.1%, respectively, between HERCULES-1 and -2 PRESS, whereas other targeted metabolites remained similar (Table 1). Signal ratios of all targeted metabolites increased using HERCULES-2 semi-LASER compared with PRESS, especially for Lac/tCr, NAA/tCr, NAAG/tCr and Asc/tCr (Table 1). Signal acquisitions varied less strongly with B1 for semi-LASER than for PRESS, as shown in Figure 3. HERCULES separates edited signals from targeted metabolites (GABA, Asp, Asc, Lac, NAA, NAAG and GSH) in three Hadamard-combination spectra: A+B+C+D contains the ‘unedited’ signals; –A–B+C+D yields a GABA-edited spectrum; and A–B+C–D yields a primarily “GSH-edited” spectrum with signals from NAAG, Asc, Asp, and Lac, as shown in Figure 4. In vivo analysis revealed 7% higher SNR for NAA in the semi-LASER data whereas linewidths were similar.Discussion
The proposed wider-band editing lobe at 4.04 ppm and the implementation of semi-LASER sequence improved editing efficiencies and signal intensities, facilitating the precise quantification of edited spectra. With the new HERCULES-2 scheme, higher signal ratios were obtained, especially for Asc/tCr and Asp/tCr, due to the broader inversion profile of the 4.04-ppm lobe. PRESS uses bandwidth-limited, B1-sensitive amplitude-modulated slice-selective refocusing pulses, resulting in signal losses and chemical shift displacement error, exacerbating spatially dependent scalar coupling evolution and editing efficiency losses8. Simulations and in vivo experiments demonstrated that semi-LASER minimized such errors using high-bandwidth, B1-insensitive adiabatic pulses, which yielded consistent signal lineshapes and improved signal gains, especially for Asc/tCr, NAAG/tCr and Lac/tCr. HERCULES-2 with semi-LASER improved the editing efficiency and was insensitive to B1 and chemical shift-related artifacts.Acknowledgements
This work was supported by NIH grants R01 EB016089, R01 EB023963 and R21 AG060245.References
- Oeltzschner G, Saleh MG, Rimbault D, Mikkelsen M, Chan KL, et al. Advanced Hadamard-encoded editing of seven low-concentration brain metabolites: Principles of HERCULES. Neuroimage. 2019;185:181-190.
- Yablonskiy DA, Neil JJ, Raichle ME, Ackerman JJ. Homonuclear J coupling effects in volume localized NMR spectroscopy: pitfalls and solutions. Magn Reson Med. 1998;39:169-178.
- Kaiser LG, Young K, Matson GB. Elimination of spatial interference in PRESS-localized editing spectroscopy. Magn Reson Med. 2007;58:813-818.
- Scheenen TW, Klomp DW, Wijnen JP, Heerschap A. Short echo time 1H-MRSI of the human brain at 3T with minimal chemical shift displacement errors using adiabatic refocusing pulses. Magn Reson Med. 2008;59:1-6.
- Simpson R, Devenyi GA, Jezzard P, Hennessy TJ, Near J. Advanced processing and simulation of MRS data using the FID appliance (FID‐A)—An open source, MATLAB‐based toolkit. Magn Reson Med. 2017;77:23-33.
- Zhang Y, An L, Shen J. Fast computation of full density matrix of multispin systems for spatially localized in vivo magnetic resonance spectroscopy. Med Phys. 2017;44:4169-4178.
- Edden RA, Puts NA, Harris AD, Barker PB, Evans CJ. Gannet: A batch‐processing tool for the quantitative analysis of gamma‐aminobutyric acid–edited MR spectroscopy spectra. J Magn Reson Imaging. 2014;40:1445-1452.
- Edden RA, Barker PB. Spatial effects in the detection of γ‐aminobutyric acid: Improved sensitivity at high fields using inner volume saturation. Magn Reson Med. 2007;58:1276-1282.
Figures
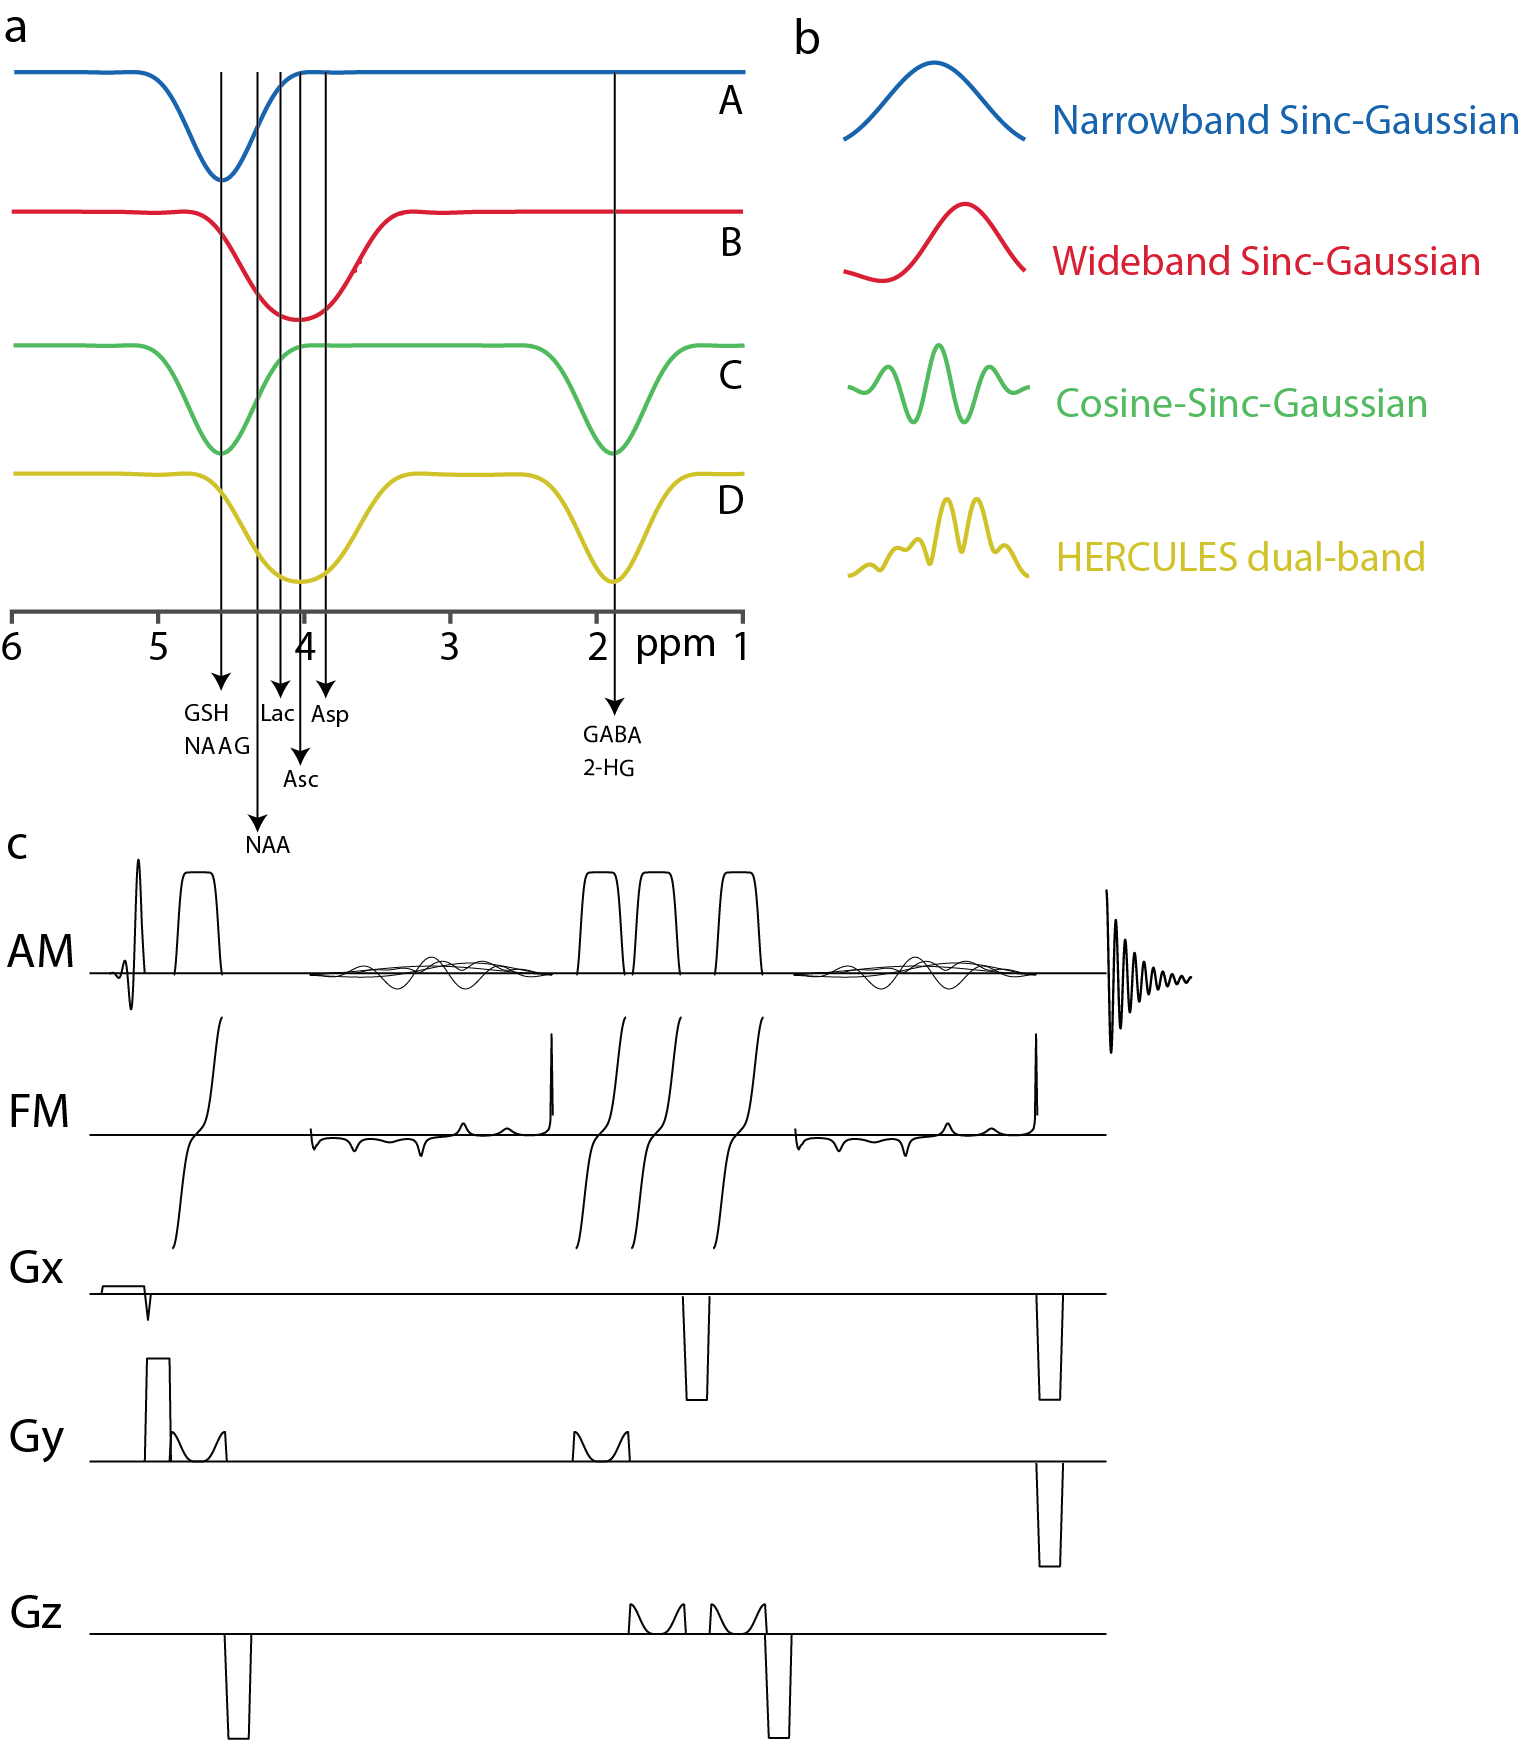
Figure
1. (a) Editing scheme for HERCULES-2 with a wider-band lobe at 4.04 ppm and
narrow-band lobes at 1.9 and 4.58 ppm; (b) corresponding editing waveforms; (c)
pulse sequence diagram for HERCULES-2 with semi-LASER. Excitation was performed
using the frequency-modulated pulse. Refocusing was performed using two pairs
of broadband adiabatic GOIA pulses with amplitude and frequency modulation. Gx,
Gy, and Gz are gradients in the x, y, and z directions respectively.
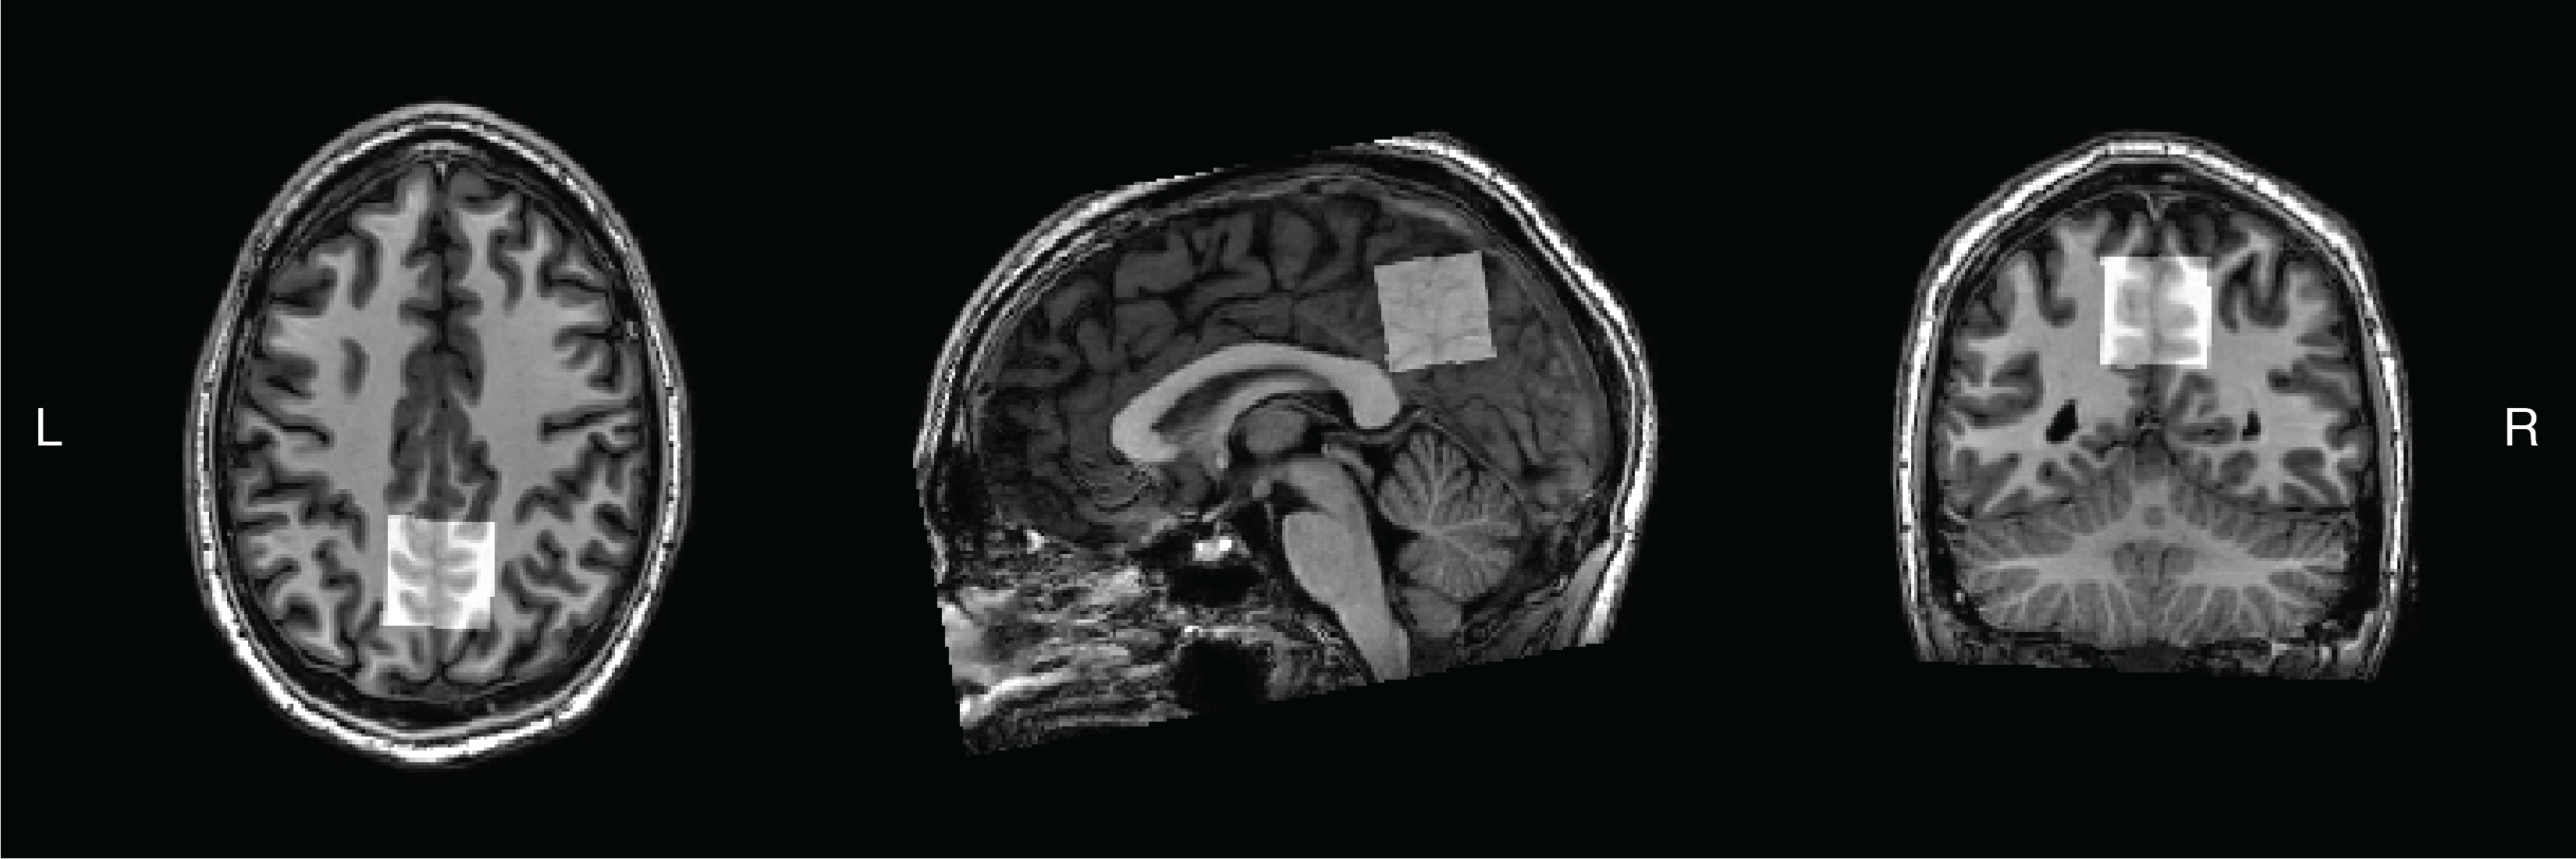
Figure
2. Location of the 27-mL voxel in the medial parietal lobe.
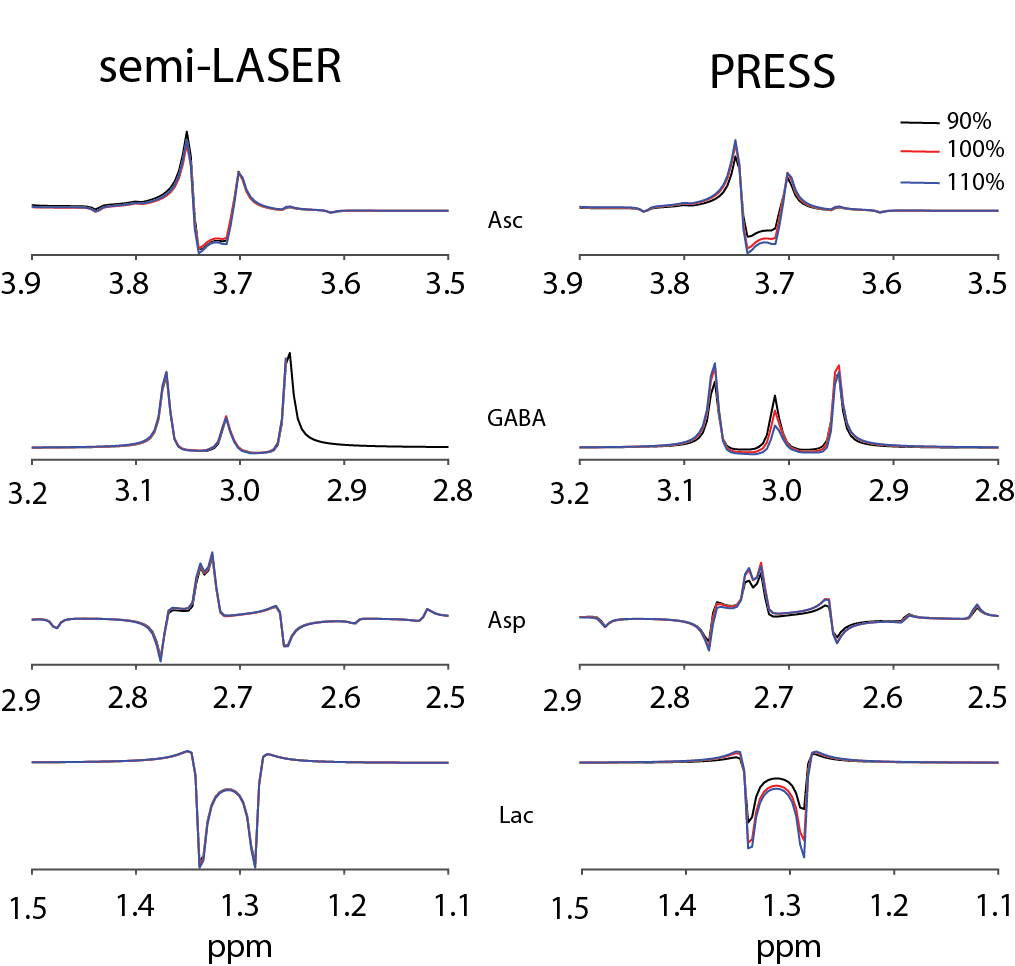
Figure 3.
Signal intensities of Asc, GABA, Asp and Lac across B1 variations based
on PRESS and semi-LASER localization.
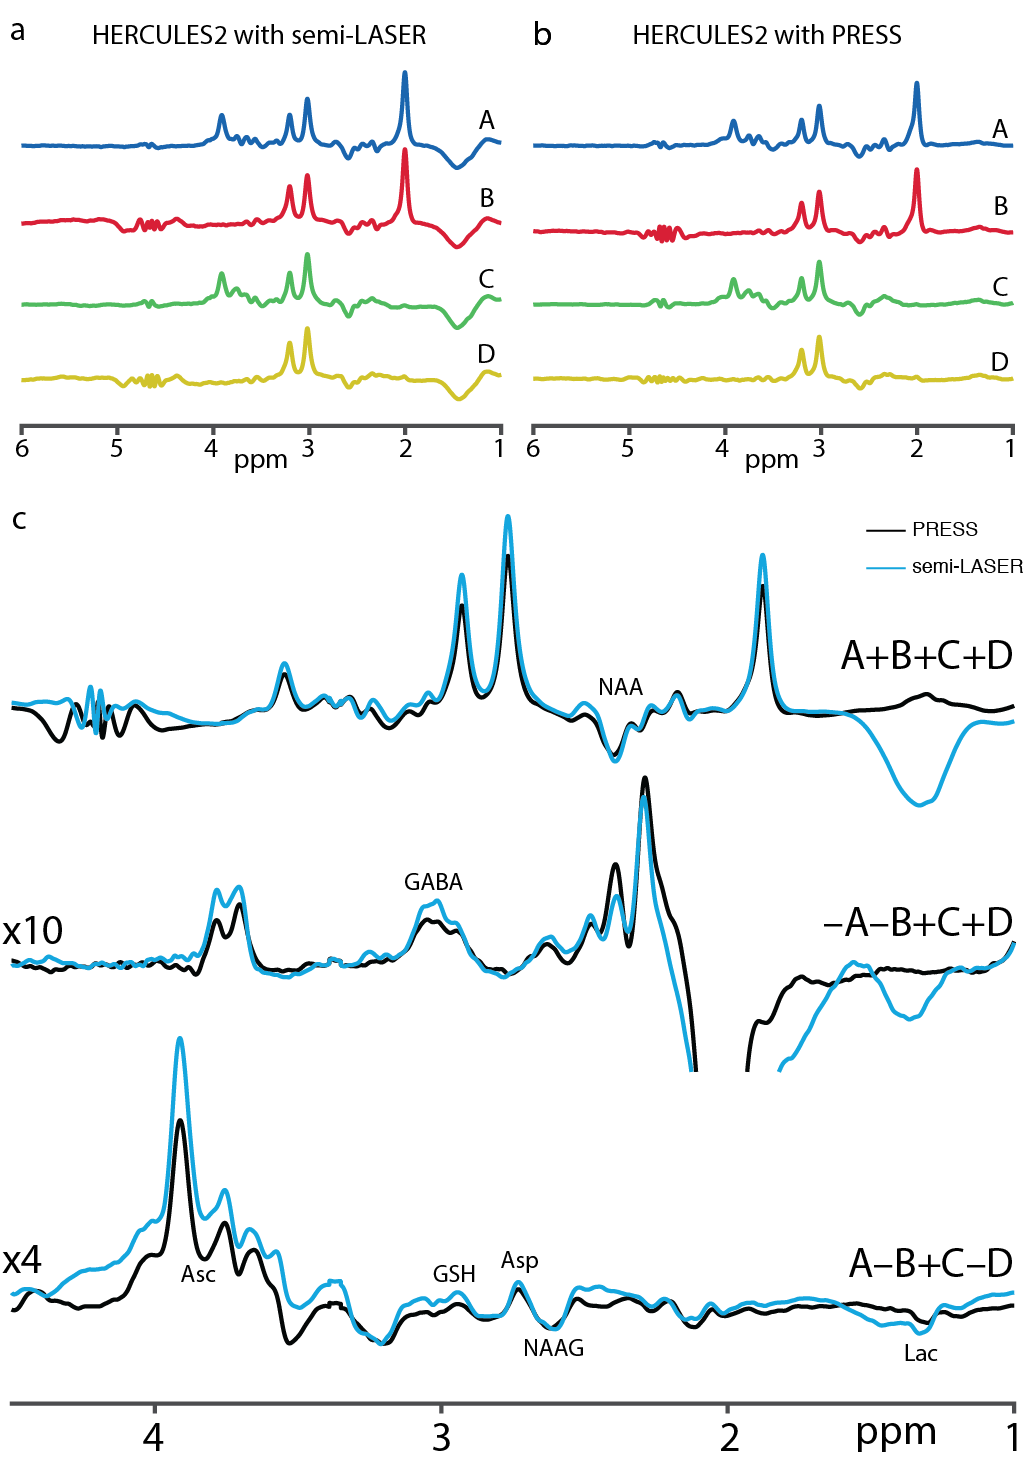
Figure
4. (a) An example of the sub-spectra acquired with semi-LASER localization, (b)
sub-spectra acquired with PRESS localization and (c) in vivo average sum and
edited spectra from the HERCULES-2 editing scheme acquired with PRESS (black)
and semi-LASER (blue). The Hadamard combinations for the sum (A+B+C+D), GABA-edited
(-A-B+C+D) and GSH-edited (A-B+C-D) spectra are shown.
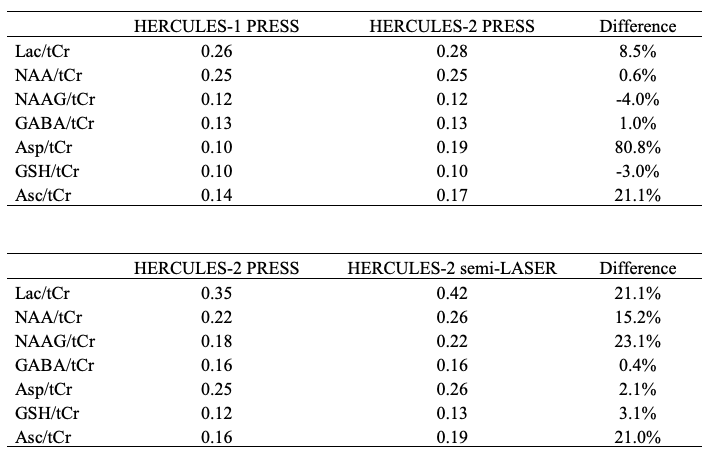
Table 1. Comparison of signal ratios
between HERCULES-1 and 2 with PRESS localization using 21 points simulations,
and between HERCULES-2 PRESS and semi-LASER using voxel center simulations.