2896
An Untargeted Metabolomics Approach to MRS in the Human Brain: A Comparison between LCModel and MRS-based Classifier-Development System1Health Sciences, Purdue University, West Lafayette, IN, United States, 2Department of Medicine, Medical School, University of Minnesota, Minneapolis, MN, United States, 3Center for Magnetic Resonance Research, Department of Radiology, University of Minnesota, Minneapolis, MN, United States, 4Weldon School of Biomedical Engineering, Purdue University, West Lafayette, IN, United States
Synopsis
MRS quantification tools such as LCModel require the use of prior knowledge and can be time-consuming. Therefore, we propose an untargeted metabolomics approach to in vivo 1H-MRS using pattern recognition and machine learning to analyze spectral features. The ability of our approach to measure changes in brain glucose while blood glucose levels were increased was studied using high quality spectra and reliable data acquisition methods. Results showed similar time-course glucose signals and sensitivity to changes in glucose concentrations for both LCModel and our pattern recognition analysis. Thus, demonstrating that untargeted metabolomics techniques can be used for in vivo MRS quantification.
Introduction
The translation of metabolomics NMR approaches in molecular medicine and in vivo 1H-MRS allows automatic analysis of unresolved in vivo spectra by utilizing pattern recognition processes and machine learning methods1,2. Unlike commonly used MRS quantification tools, untargeted metabolomics approaches do not require any prior knowledge. They have been successfully implemented to identify the characteristic spectral features associated with brain tumors2,3 and multiple sclerosis4. In this study, we explored the utility of untargeted metabolomics approaches to measure the change in brain glucose concentrations when blood glucose levels were increased in a step function5.Methods
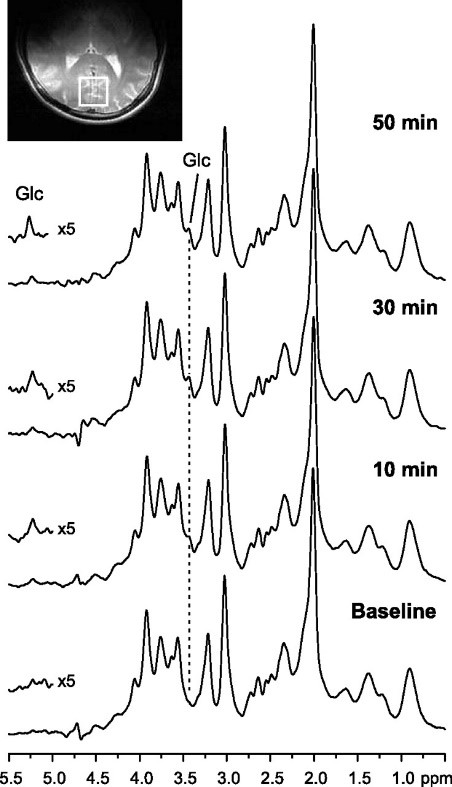
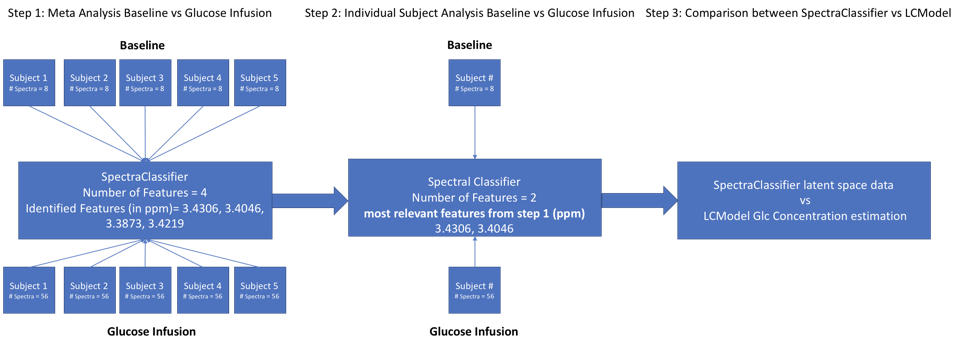
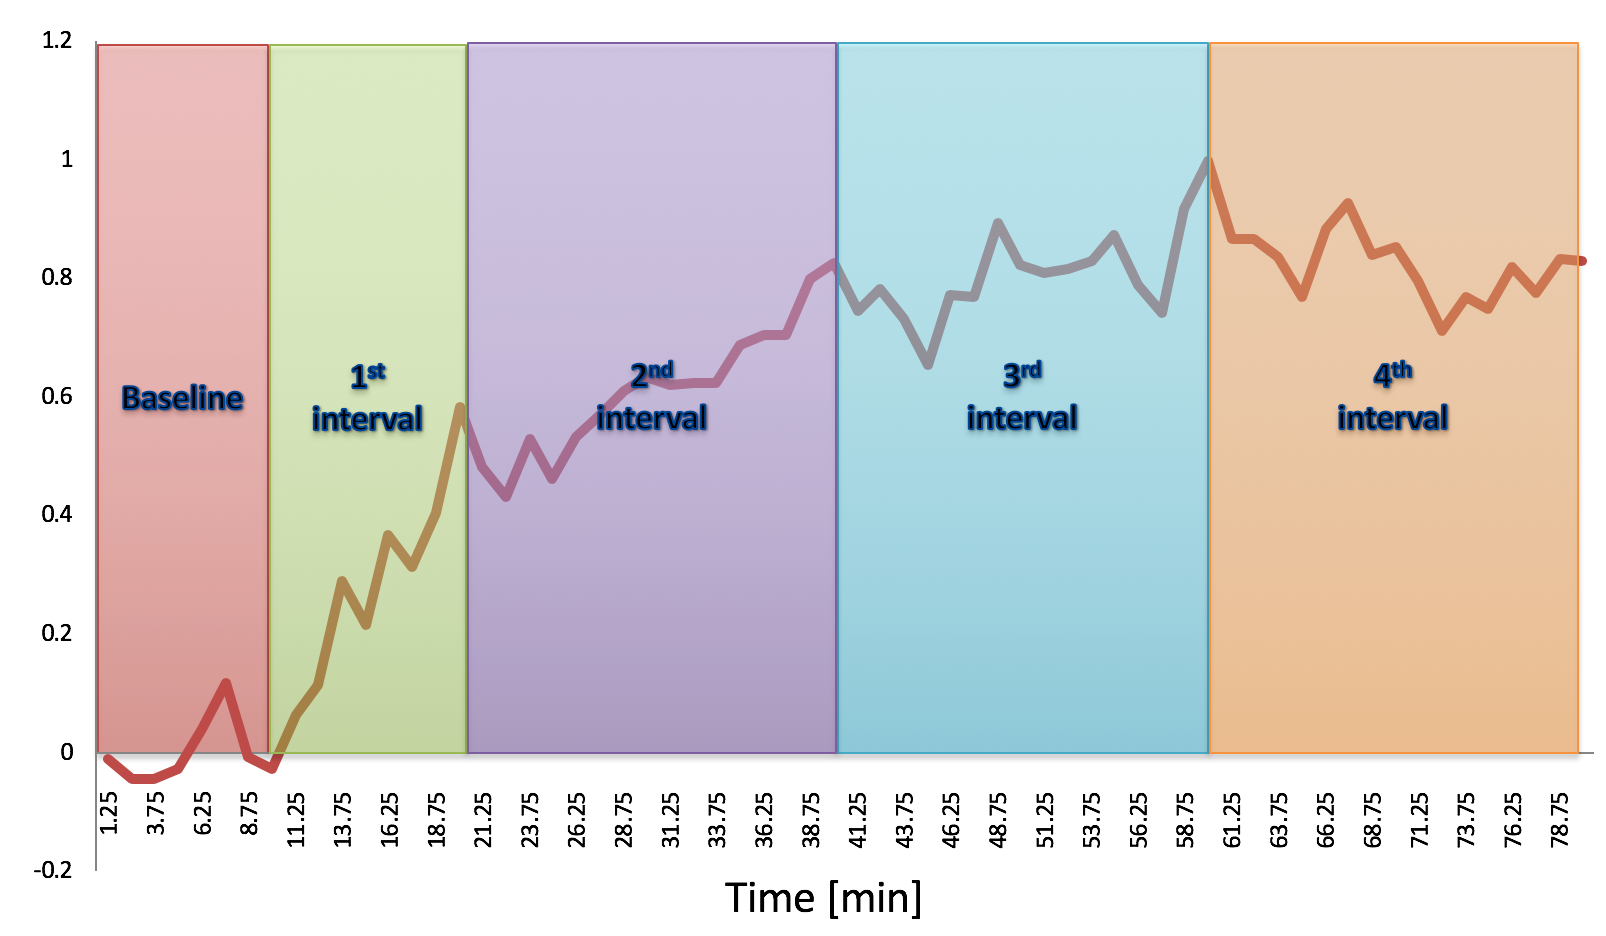
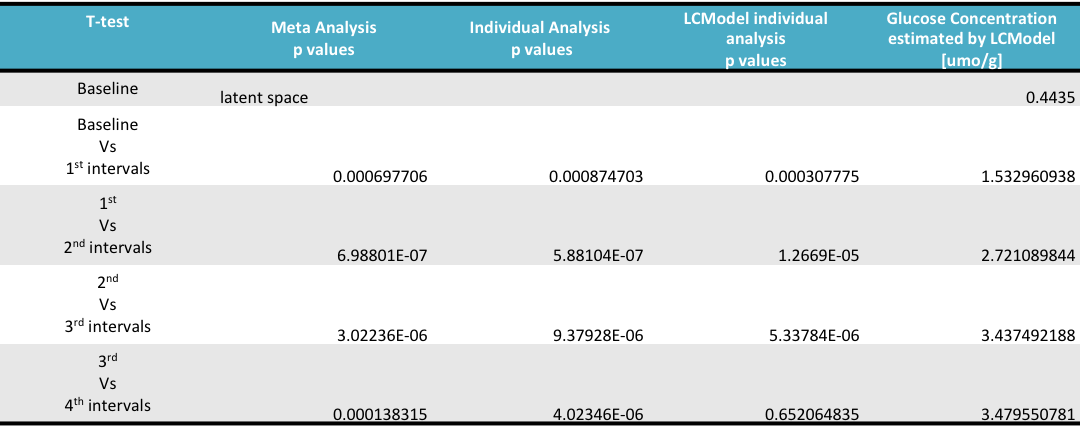
All measurements were performed on a 4 T / 90 cm magnet (Oxford/Varian). A quadrature 14 cm 1 H surface coil was used. Localization was achieved with STEAM (TE = 5 ms, TR = 4.5 s) as described previously5. Five healthy volunteers (3 M / 2 F, 31 ± 16 (SD) years old) participated in the study. A baseline spectrum was obtained from the occipital lobe (22-27 ml VOI, 10 min acquisition). Then the volunteers received an IV of 40-60 mL glucose bolus (50% dextrose) over 1-2 min followed by continuous infusion of glucose (20% dextrose) as necessary to maintain the plasma concentration at ~17 mmol/l for ~2h (Figure 1). During the infusion, 1H MR spectra were continuously obtained in single scan mode from the occipital lobe, which were individually frequency and phase-corrected to minimize the effects of motion on spectral linewidths and signal-to-noise ratio (SNR). MR spectra continuously acquired during the glucose infusion were summed over every 16 scans to provide 1.25 min resolution. Metabolites were quantified using LCModel6,7. The frequency range for LCModel analysis was between 0.5 and 4.2 ppm. After transforming the pre-processed signals to the frequency domain, the baseline spectrum was subtracted from the spectrum for the pattern recognition analysis. The normalization of the spectral data vector to the water spectrum was performed on the basis of the data points in the region 0.5 to 4.2 ppm. The same spectral range was used as an input to SpectraClassifier 3.1, an automated MRS-based classifier-development system8. Feature selection was performed with Correlation-based Feature Subset Forward Selection, and the resulting features were used as an input to a Fisher Linear Discriminant Analysis (LDA). Then the steps in Figure 2 were followed. To evaluate the sensitivity of both approaches to changes in glucose level (LCModel and SpectraClassifier), a two-tailed t-test was used for comparison between consecutive time intervals (Figure 3, baseline vs. first, first vs. second …).Results
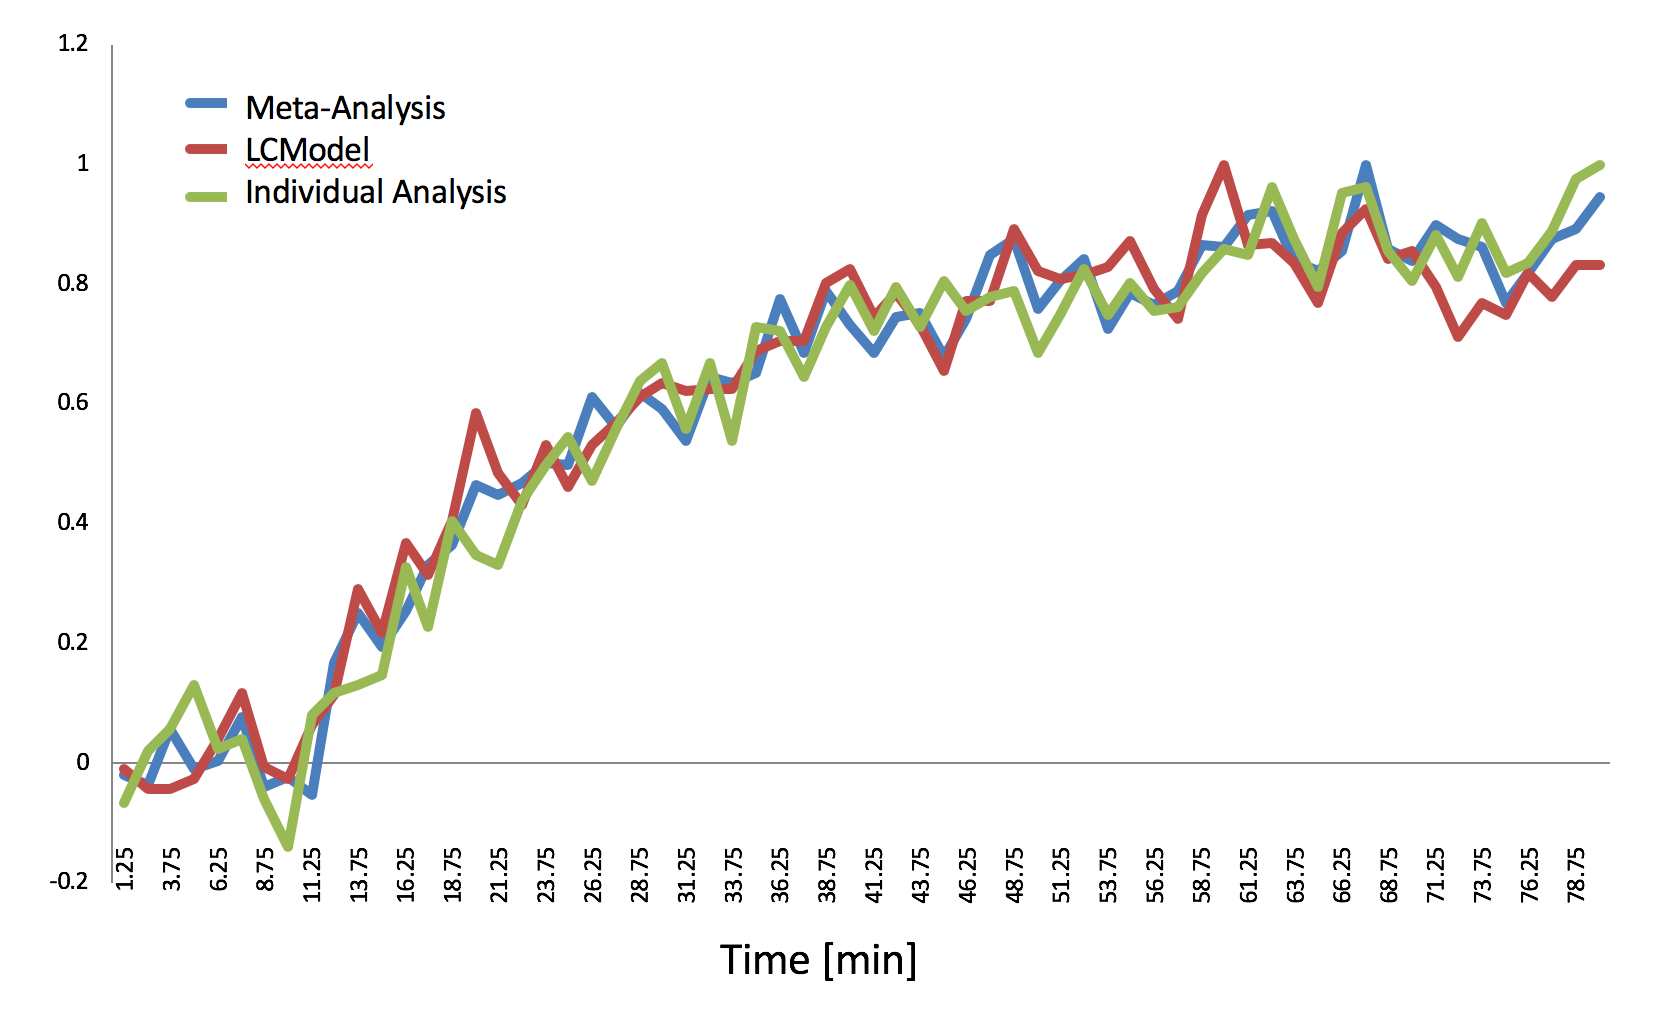
The time-courses of projection space LDA classifier for the meta- (Step 1), individual- (Step 2) and LCModel analyses are illustrated for a single subject (Figure 4, referenced to the first time point and then normalized to maximum value). The sensitivity analysis for the consecutive interval analysis was reported in Table 1. We demonstrated that the pattern recognition approach successfully separated interval three from interval four, where glucose concertation increase was around 1% estimated by LCModel.Conclusion and Discussion
We have shown that untargeted metabolomic analysis can be used for in vivo MRS. The excellent spectral quality and temporal stability achieved in this study resulted in the estimation of a similar time-course of the glucose signal for both proposed pattern recognition analysis procedure and LCModel. Thus, this study also emphasizes the importance of reaching high spectral quality and reliability of data acquisition techniques. Finally, the proposed method could be extended to a larger dataset to model disease subtype, progression, or treatment monitoring, where it may become a valuable tool creating more patient-specific assessments.Acknowledgements
This work was supported by grants R01-NS-035192, P41-EB-0270601, and P30-NS-076408.References
1. Bingol K. Recent advances in targeted and untargeted metabolomics by NMR and MS/NMR methods. High Throughput. 2018; 7(2): 9
2. Griffin, JL & Kauppinen RA. A metabolomics perspective of human brain tumors. FEBS J. 2007. 274(5):1132-9.
3. Verma A, Kumar I, Verma N, Aggarwal P, Ohja R. Magnetic resonance spectroscopy – revisiting the biochemical and molecular milieu of brain tumors. BBA Clin. 2016; 5: 170-178.
4. Vingara LK, Yu HJ, Wagshul ME, Serafin D, Christodoulou C, Pelczer I, Krupp LB, Savatic MM. Metabolomic approach to human brain spectroscopy identifies associations between clinical features and the frontal lobe metabolome in multiple sclerosis. NMR Biomed. 2007. 20:763.
5. Shestov AA, Emir UE, Kumar A, Henry PG, Seaquist ER, Öz G. Simultaneous measurement of glucose transport and utilization in the human brain. Am J Physiol Endocrinol Metab. 2011;301(5):E1040–E1049.
6. Provencher SW. Automatic quantitation of localized in vivo 1H spectra with LCModel. NMR Biomed. 2001;14(4):260-4.
7. Provencher SW. Estimation of metabolite concentrations from localized in vivo proton NMR spectra. Magn. Reson. Med. 1993;30:672–679.
8. Ortega-Martorell S, Olier I, Julià-Sapé M, et al. SpectraClassifier 1.0: a user friendly, automated MRS-based classifier-development system. BMC Bioinformatics. 2010. 11:106.
Figures