2895
Effect of water suppression and metabolite cycling on quantification of 1H MRS spectra in the human brain at 3 Tesla1Center for Magnetic Resonance Research, Radiology, University of Minnesota, Minneapolis, MN, United States
Synopsis
This study investigates the effect of water suppression and metabolite cycling on metabolite quantification and macromolecules in 1H MRS. Single-voxel semi-LASER spectra and metabolite-nulled spectra (macromolecules) were acquired in the posterior cingulate cortex in the human brain at 3T using three different schemes: VAPOR, metabolite-cycling (MC), and metabolite-cycling combined with a single water suppression pulse. Results show that macromolecule signal and several metabolites (ascorbate, total creatine, glutamate, and glutathione) have higher in concentration when using MC compared to VAPOR. Combining MC with a single water suppression pulse results in concentrations in between those obtained with VAPOR and MC.
Purpose
Proton magnetic resonance spectroscopy (1H MRS) is a non-invasive technique that enables the measurement of various metabolites in the brain. In order to detect neurochemicals, water suppression (WS) is critical to get rid of the intense water signal. Several suppression techniques exist, of which VAPOR1 is most commonly used. Lately, metabolite-cycling2 (MC) is becoming popular to suppress water due to the high SNR of water signal which can be used to perform shot-to-shot phase and frequency corrections during post-processing, especially when metabolite signal is too low on single shots (e.g. small voxels). Recently, two MRSI studies3-4 compared VAPOR and MC WS techniques and reported that several neurochemicals in the human brain have higher concentrations with MC compared to VAPOR. These studies either used simulated macromolecule (MM) or excluded MM contribution during data fitting which could affect quantification. Therefore, the aim of the current study was to compare the effects of VAPOR, MC with one WS pulse and MC on metabolites and MM signals in the human brain at 3T using single-voxel MRS.Methods
Healthy subjects (N=4, 53±19 years old, male) were scanned on a 3T Siemens Prisma scanner. The standard body coil was used for transmit and a 32-channel head coil for signal reception. A VOI size of 20×20×20 mm3 was positioned in the posterior cingulate cortex using T1-weighted MPRAGE images. B0 shimming was achieved FAST(EST)MAP which results in water linewidth of 6±1 Hz. Localized spectra were acquired using semi-LASER5 (TR/TE=3000/28ms). Metabolites (64 averages) and water reference (2 averages) scans were acquired with three different WS schemes: VAPOR, MC followed by a single WS pulse (denoted as MC+WS1) and MC alone (no water suppression pulse). All WS techniques were interleaved with OVS pulses. Metabolite-nulled MM data were also acquired in each participant under the same conditions. All spectra were processed using MRspa6 in MATLAB. Metabolite spectra were analyzed with LCModel7 using simulated basis sets and measured macromolecule spectra. Concentrations difference between WS schemes were compared using paired t-test.Results and Discussion
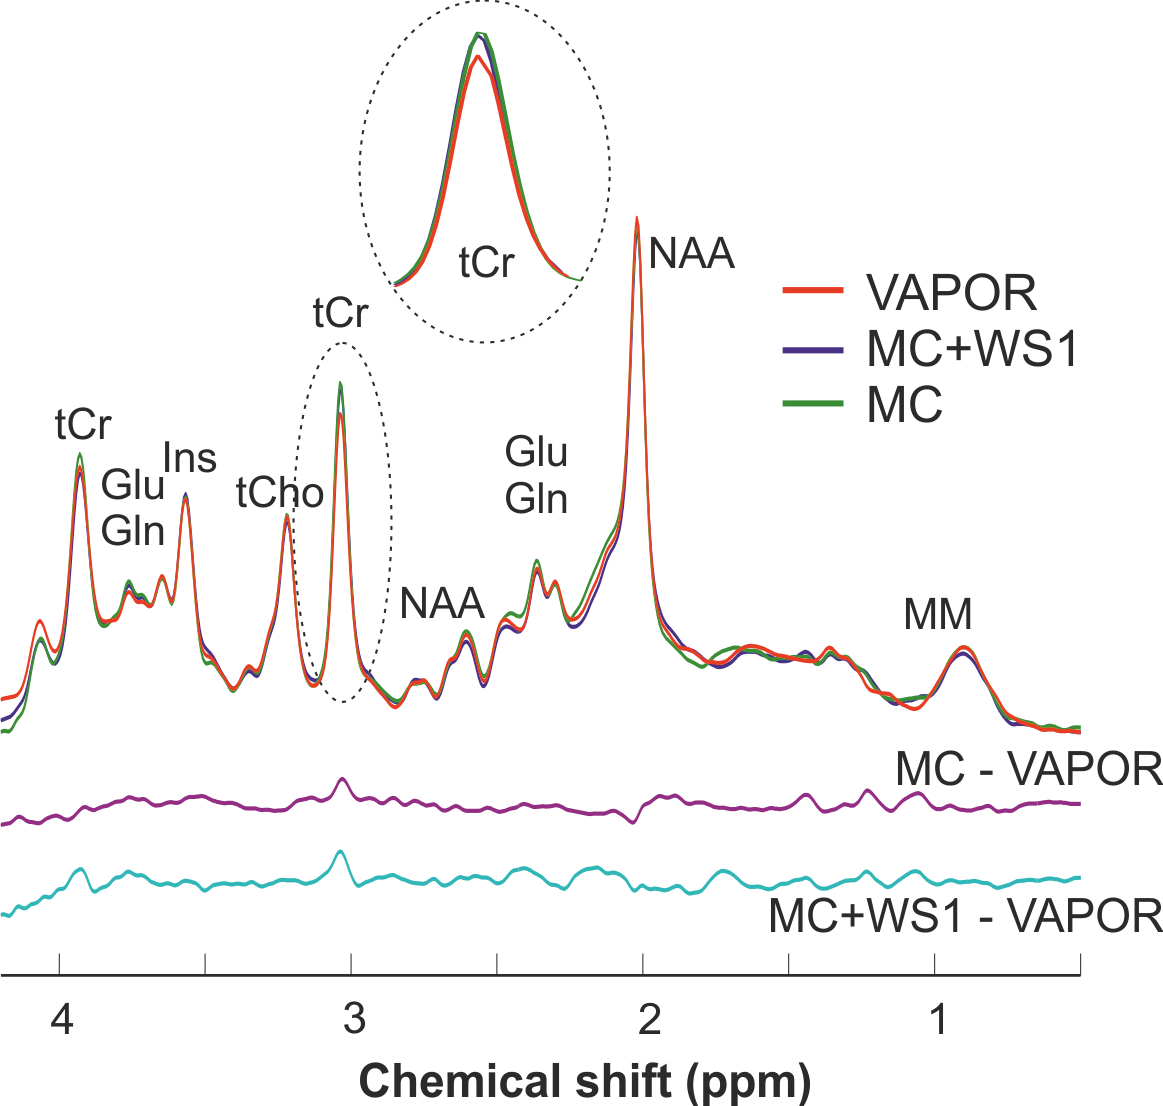
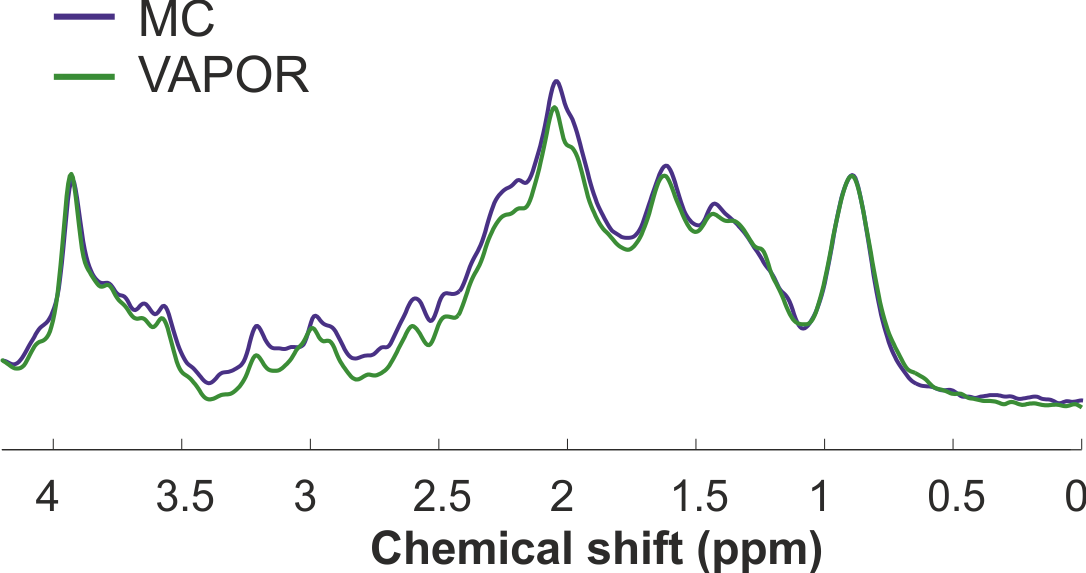
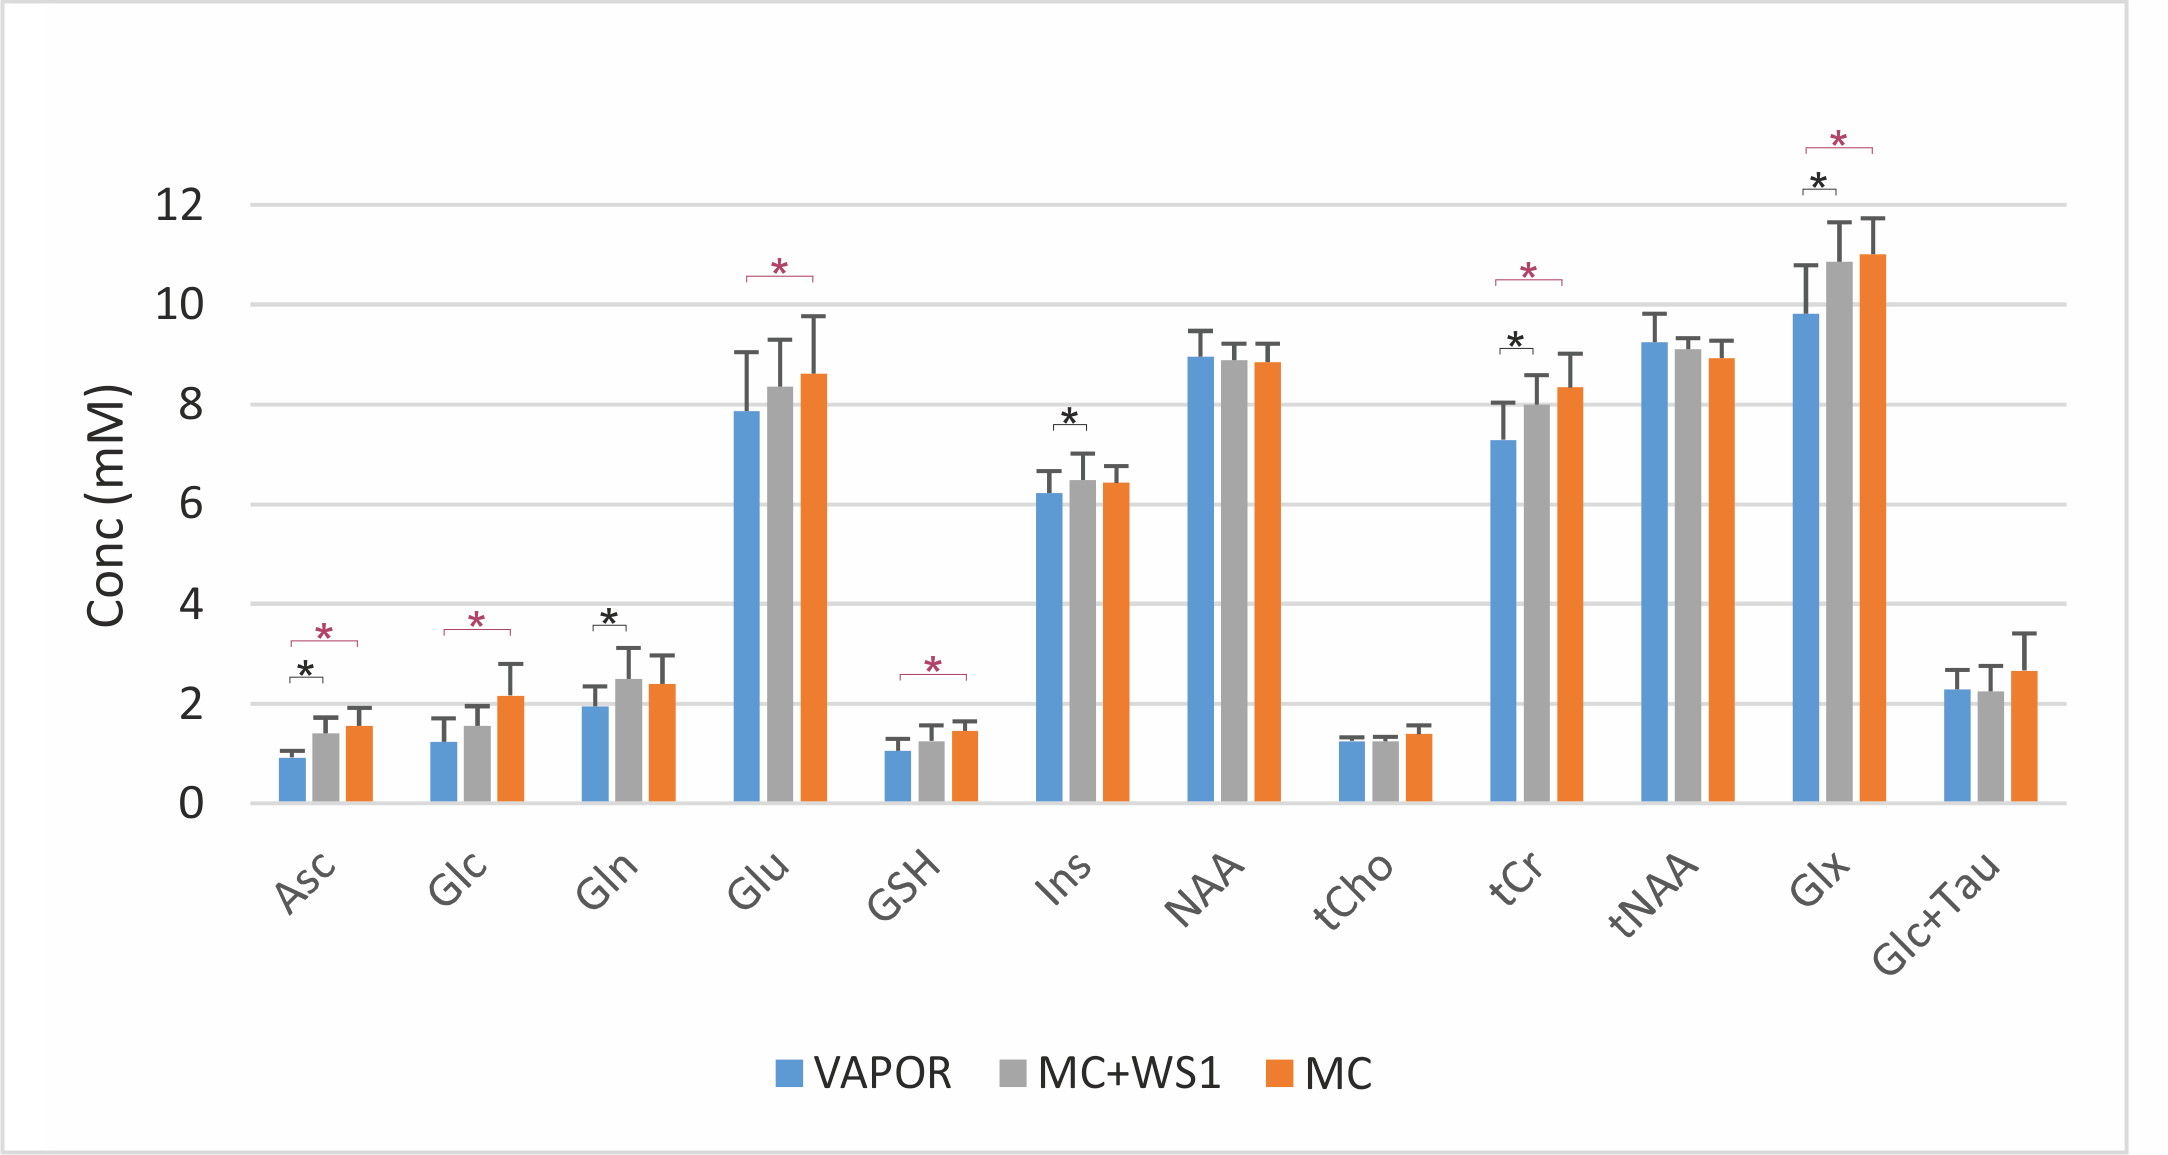
Semi-LASER spectra acquired from one subject clearly showed differences in spectral pattern between VAPOR, MC+WS1, and MC WS schemes (Figure 1). The tCr peak at 3.03 ppm was clearly higher in MC+WS1 and MC compared to VAPOR. Taking a difference between MC and VAPOR and between MC+WS1 and VAPOR confirms our observation since tCr was still present in the residuals (Figure 1). Difference in signal was also observed between 2 and 2.5 ppm and around 3.7 ppm in the spectra suggesting that other low concentration metabolites could be affected.Interestingly, distinct differences were also observed in the measured MM signals between MC and VAPOR; the MM content was higher with MC between 1.5 to 3.7 ppm regions (Figure 2). Therefore the MM spectrum included in the LCModel basis set must be measured with the same water suppression scheme as the metabolite spectrum. Concentrations of the main neurochemicals and statistical differences between WS schemes are reported in Figure 3. Comparison between MC and VAPOR shows several metabolites being statistically higher with MC: ascorbate, glutamate (Glu, 9%), glutathione (GSH, 38%), tCr (14%) and glutamate+glutamine (Glx, 12%). Glc was also higher with MC. Similarly, Asc, glutamine, tCr and Glx were statistically higher with MC+WS1 compared to VAPOR. No statistical difference in concentration was observed between MC and MC+WS1 schemes.
It was previously suggested that changes in [tCr] could be related to magnetization transfer (MT) effect8. Based on this, MT is expected to have a larger effect on metabolites using VAPOR due to the presence of eight WS pulses compared to MC and MC+WS1, as our results show. It was also demonstrated that MT does not affect MM signals in the brain9. However, we did observe differences in the MM distribution between VAPOR and MC. Further investigation is required to explain the higher concentrations observed with MC.
Conclusion
The present study shows significantly higher concentrations for several metabolites as well as distinct MM patterns in the human brain when using MC compared to VAPOR. Therefore, it might not be straight-forward to compare literature values between MRS studies which uses different WS techniques.Acknowledgements
This work was supported by NIH grants: P41 EB027061, P30 NS076408 and 1S10OD017974-01References
[1] Tkac et al Mag Reson Med 1999
[2] Dreher and Leibfritz Mag Reson Med 2005
[3] Emir et al. NMR Biomed 2017
[4] Chang et al. Mag Reson Med 2018
[5] Öz and Tkac Magn Reson Med. 2011
[6] https://www.cmrr.umn.edu/downloads/mrspa/
[7] Provencher Magn Reson Med. 1993
[8] Leibfritz and Dreher NMR Biomed 2001
[9] McLean et al. Magn Reson Med. 2005
Figures