2892
Determination of Brain Metabolite T1 Without Interference from Macromolecule Signals1National Institute of Mental Health, National Institutes of Health, Bethesda, MD, United States
Synopsis
Optimal detection of many metabolites requires a specific TE, at which significant macromolecule signals are often present. The presence of macromolecule signals complicates the measurement of metabolite T1 because different spectral models may be necessary for macromolecules at different inversion recovery stage, therefore, potentially introducing additional errors. To minimize interference from macromolecules, we chose inversion times in such a way that the metabolite signals were changed by as much as 60% while the macromolecule signals were essentially unchanged. This avoided the T1 relaxation effect of macromolecules, and thus simplified data acquisition and post-processing.
INTRODUCTION
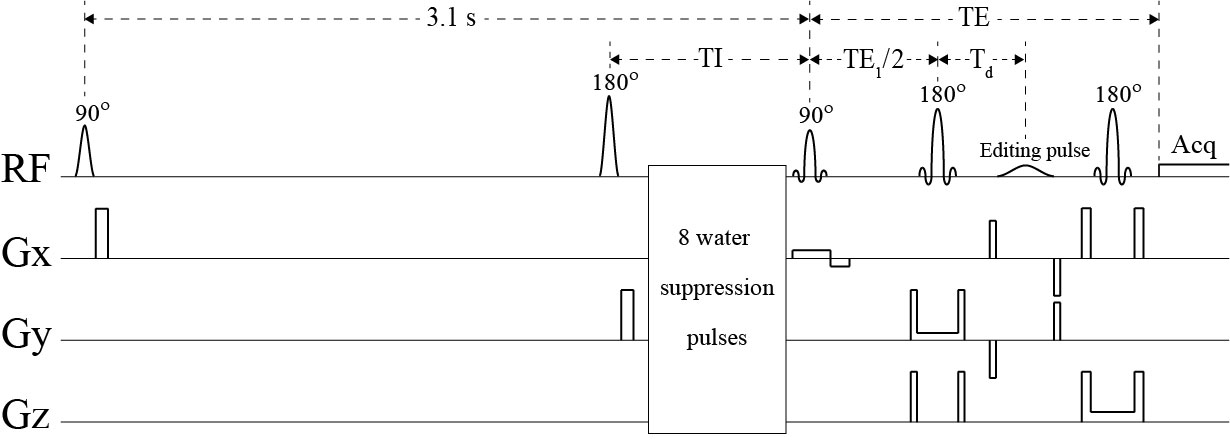
Because of scalar couplings, many metabolites are best detected at a predefined TE. Except at very long TEs, the presence of varying macromolecule signals may interfere with measuring metabolite T1. High field MRS provides increased sensitivity and spectral resolution compared to lower field strengths. However, metabolite T1 relaxation times become longer at high field strengths, which often makes it necessary to characterize metabolite T1 values to obtain accurate quantification of metabolite concentrations and/or optimize the TR of a pulse sequence for optimal signal-to-noise performance. A previously described spectral editing technique1 can simultaneously measure glutamate (Glu), glutamine (Gln), γ-aminobutyric acid (GABA), and glutathione (GSH) at 7 T. The editing RF pulse was set to OFF, ON at 1.89 ppm, and ON at 2.12 ppm. By numerical optimization of sequence timing in the presence of an editing pulse, all four metabolites form relatively intense pseudo singlets at TE = 56 ms with maximized peak amplitudes and minimized peak linewidths in one of the three interleaved spectra. In this work, we propose to combine the spectral editing technique with inversion recovery (IR) to measure metabolite T1 relaxation times in the presence of substantial macromolecule baseline signals.METHODS
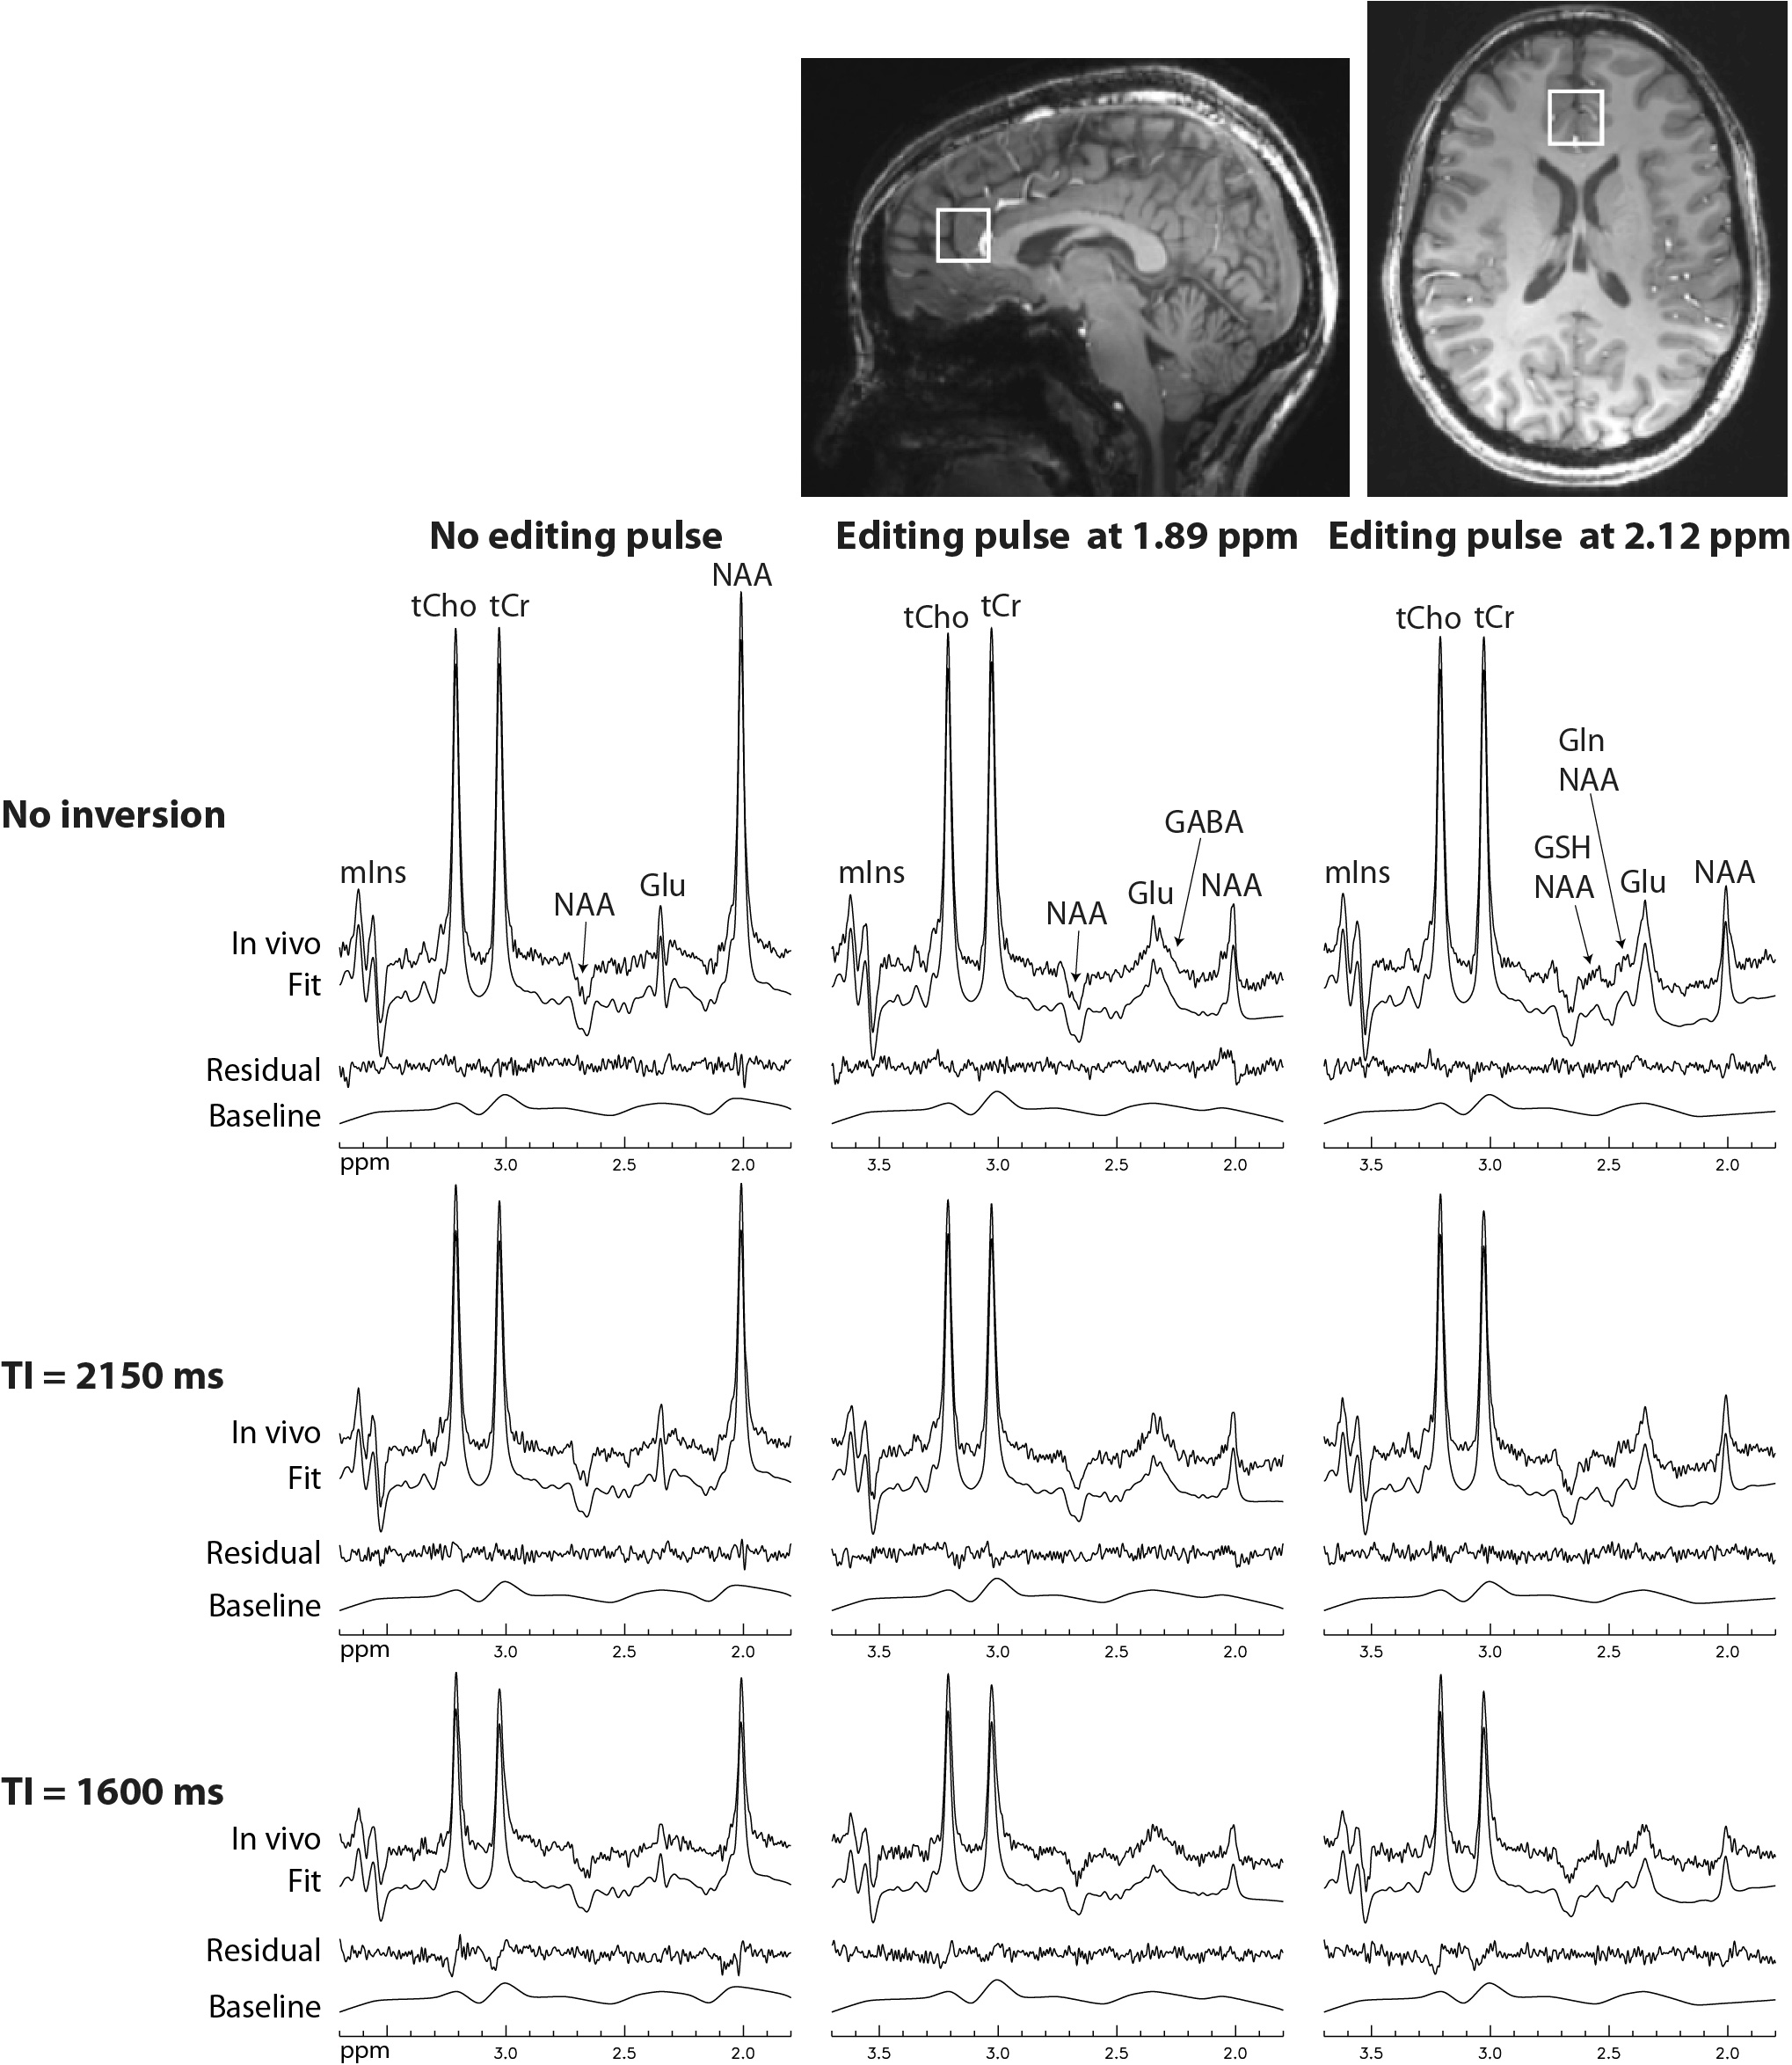
To incorporate IR, a 180° hyperbolic secant pulse was placed before the water suppression pulses in the spectral editing pulse sequence1 (Figure 1). Three IR settings were used: no inversion, TI = 2150 ms, and TI = 1600 ms. With average T1 = ~430 ms, 99% of macromolecules were recovered at TI = 2150 ms and 95% were recovered at TI = 1600 ms2. Therefore, macromolecule signals were minimally affected by the IR pulse. In contrast, with T1 = ~1600 ms, metabolite signals only recovered by 62% at TI = 2150 ms and 41% at TI = 1600 ms. Hence, the metabolite signals were significantly modulated by the TI values.Five healthy volunteers were recruited and consented for the study in accordance with procedures approved by our institutional review board. Experiments were performed on a Siemens Magnetom 7 T scanner. MRS data were collected using the proposed pulse sequence from a 2 × 2 × 2 cm3 voxel in the pregenual anterior cingulate cortex (pgACC) of the volunteers. To compute within-subject coefficient of variation (CV) values on each subject, the same MRS measurement was performed three times in the same exam using the same voxel prescription. Interleaved data acquisitions were performed using nine different parameter settings which were a combination of the three spectral editing settings and three IR settings. The spectra corresponding to the nine parameter settings were simultaneously fitted in the range of 1.8 – 3.7 ppm by a linear combination of numerically computed basis functions of acetate, N-acetylaspartate (NAA), N-acetylaspartylglutamate (NAAG), GABA, Glu, Gln, GSH, aspartate, total creatine (tCr), total choline (tCho), myo-inositol (mIns), taurine, scyllo-inositol, and glycine, as well as cubic spline baselines which approximate the macromolecule signals. Each basis function consisted of three FIDs which correspond to the three different spectral editing settings. The unknown variables in the fitting process were concentrations, T1s, frequency shifts, linewidths, and lineshape of the metabolites, as well as zero-order phases of the nine spectra and control points of the cubic spline baselines. Because of the low concentrations of Gln and GABA, it was difficult to measure their T1 values. Hence, the T1 values of Gln and GABA were set to be the same as that of Glu. Due to the long TIs, macromolecule signals were barely affected by the IR pulse. Hence, baselines were not changed for the three different IR settings.
RESULTS
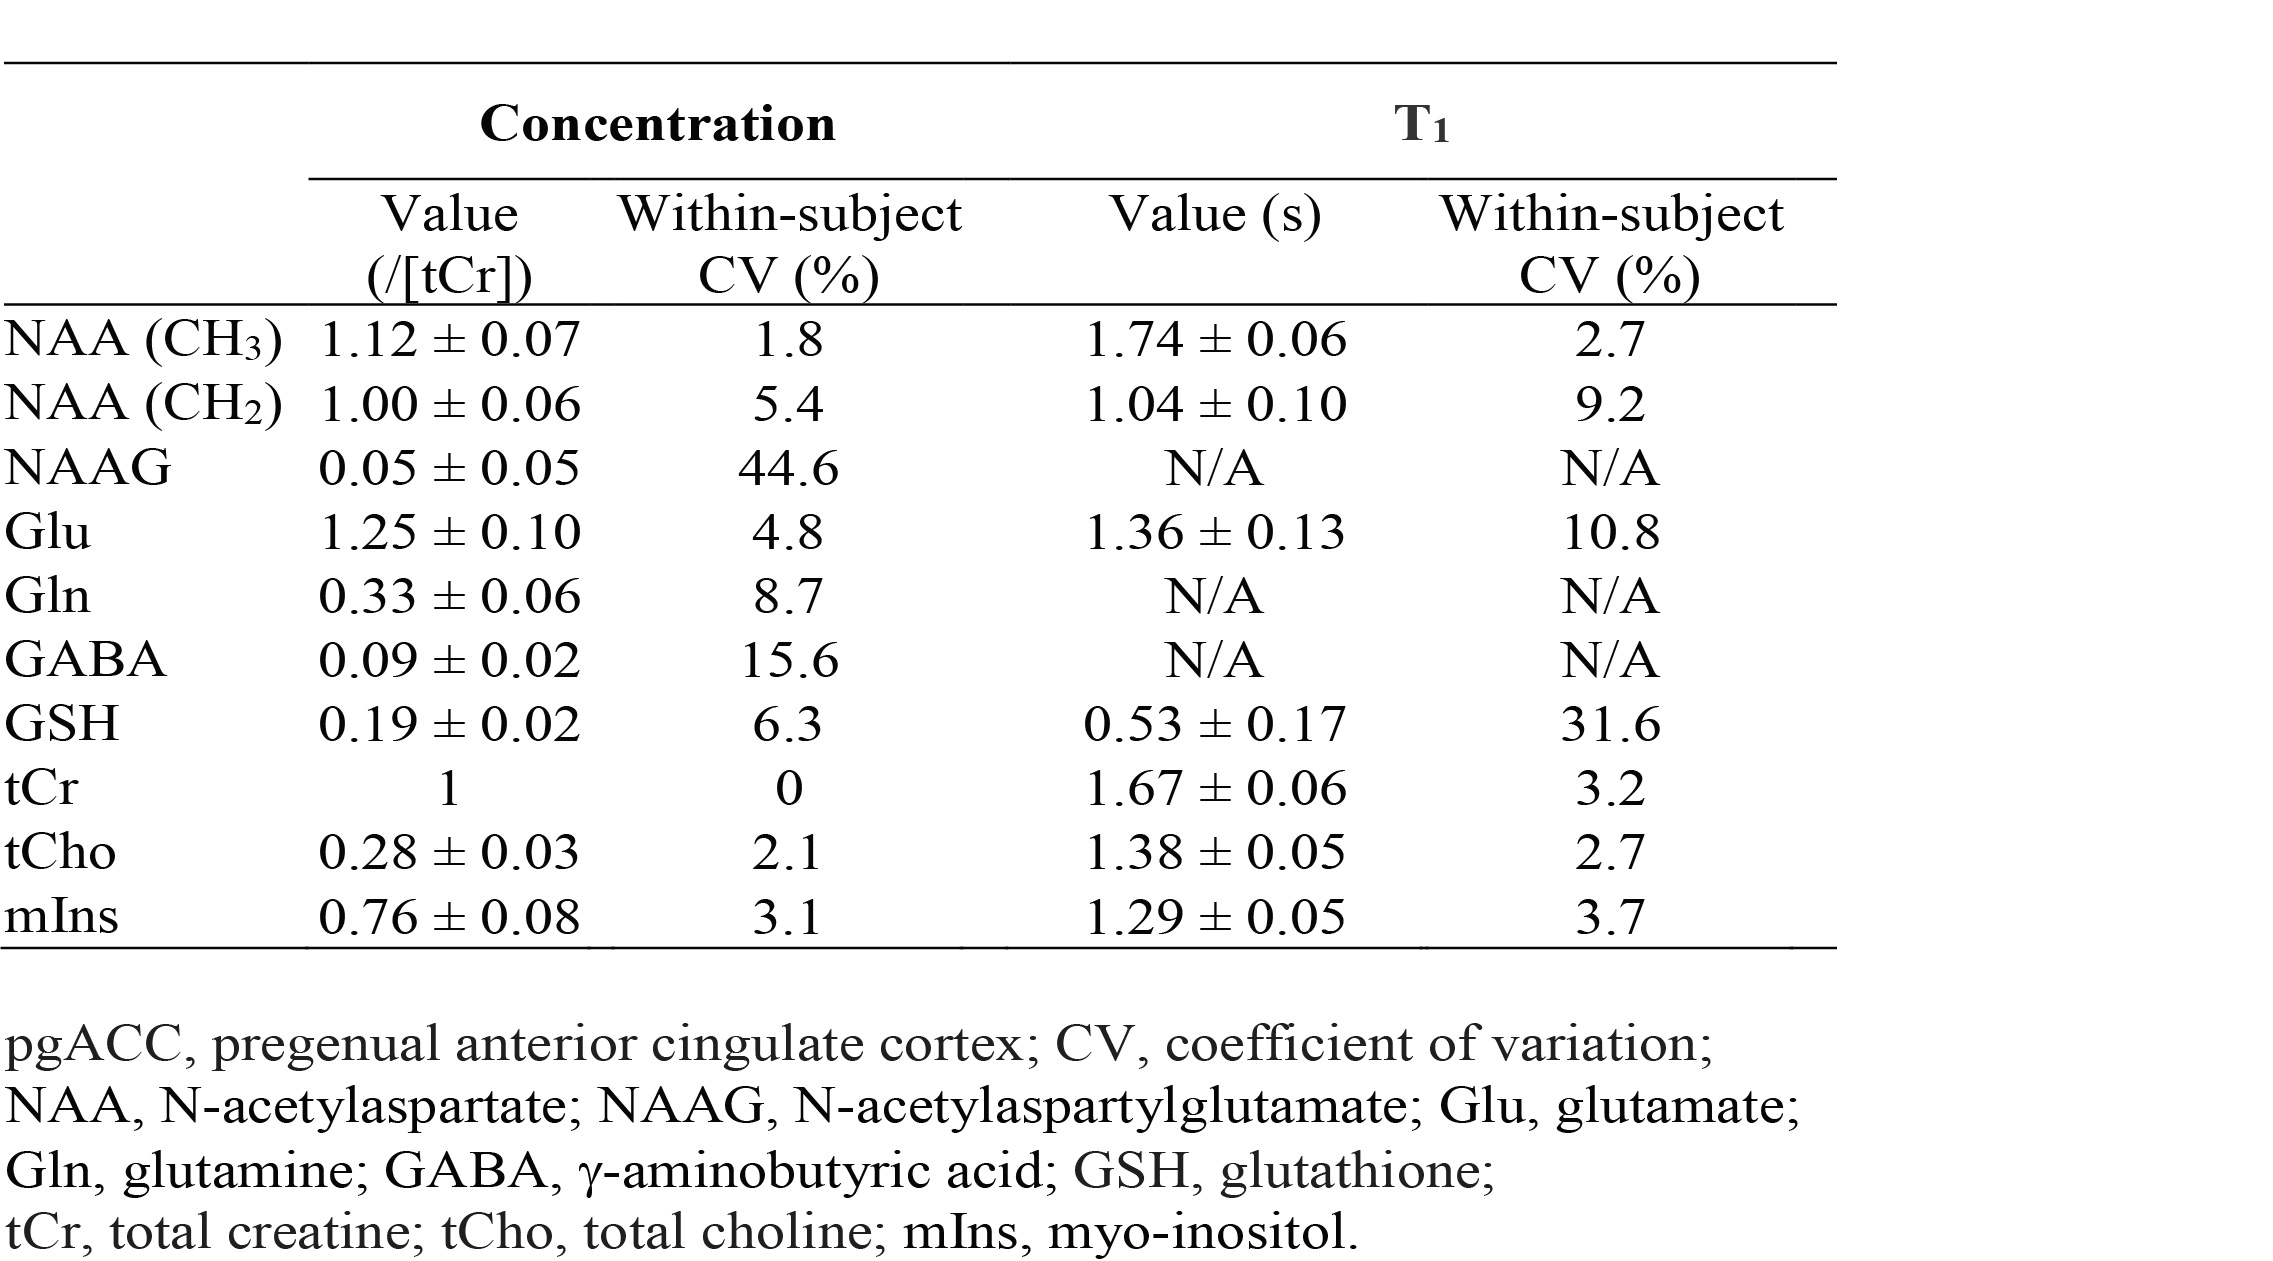
Reconstructed spectra and corresponding fits from one healthy volunteer are displayed in Figure 2. The spectra showed progressively reduced metabolite signals as TI decreased, whereas the same baselines were used for the three different IR settings. The in vivo spectra were fitted very well and the fit residuals were small. Metabolite concentrations (/[tCr]) and T1 relaxation times (n=5) are given in Table 1. The metabolite concentrations and T1 values agree well with previous studies1, 3.DISCUSSION AND CONCLUSION
In this study, the TI values were chosen in such a way that the metabolite signals were changed by as much as 60% while the macromolecule signals were essentially intact. This avoided the complex T1 relaxation effects of different components of macromolecules, and thus simplified data acquisition and post-processing by using the same baselines for data acquired at different TIs. If shorter TI values were used, macromolecule signals could not fully recover and the T1 distribution of macromolecules needs to be determined as in a previous study4, which would require much longer scan time and more time-consuming post-processing. Despite the reduced sensitivity for measuring metabolite T1 values due to using only relatively long TI values, high precision for metabolite concentrations and T1s was still achieved. In summary, this work combined inversion recovery with a previously described spectral editing technique to measure metabolite T1 relaxation times at TE = 56 ms in the presence of substantial macromolecule baseline signals. Metabolite concentrations and T1 relaxation times were measured with high precision.Acknowledgements
This work was supported by the intramural programs of the NIH.References
1. L. An, M.F. Araneta, C. Johnson, J. Shen, Simultaneous measurement of glutamate, glutamine, GABA, and glutathione by spectral editing without subtraction, Magn Reson Med, 80 (2018) 1776-1786.
2. L. An, C. Johnson, M. Victorino, and J. Shen, Determination of Macromolecule Baselines by Variable Inversion-Recovery of Metabolites. ISMRM 2019:0402, Montreal, Canada.
3. L. An, S. Li, J. Shen, Simultaneous determination of metabolite concentrations, T1 and T2 relaxation times, Magn Reson Med, 78 (2017) 2072-2081.
4. L. Hofmann, J. Slotboom, C. Boesch, R. Kreis, Characterization of the macromolecule baseline in localized H-1-MR spectra of human brain, Magnetic Resonance in Medicine, 46 (2001) 855-863.
Figures