2891
Measuring transverse relaxation rates of major brain metabolites from a single spin-echo: Demonstration using single voxel PRESS acquisitions1Radiology, Boston Children's Hospital, Boston, MA, United States, 2Harvard Medical School, Boston, MA, United States
Synopsis
Several studies have reported strong correlations between transverse relaxation rate (R2) of the brain metabolites and neurological/psychiatric diseases. Typically, R2 quantification requires several PRESS acquisitions at different echo-times leading to long scan times. Here, we evaluated the feasibility of a novel technique based on a single-echo PRESS acquisition with full echo sampling for R2 estimation of major brain metabolites (NAA, Cr and Cho) and compared those to the values obtained using five PRESS acquisitions. The proposed method allowed for R2 estimation with 87.7±6.8% accuracy compared to the multiple PRESS acquisitions representing a five-fold decrease in acquisition time in this case.
Purpose
To compare transverse relaxation rates of brain metabolites estimated from single-echo PRESS acquisitions with multiple PRESS acquisitions at different echo times.Introduction
Brain metabolite transverse relaxation rates R2 are highly sensitive to molecular motion mainly through interaction of metabolites with macromolecules. Significant changes in metabolite relaxation rates have been reported in several brain pathologies including Alzheimers1, bipolar disorder2, stroke3 and schizophrenia2,4 and have been shown to be affected by the aging process2,5. In addition, metabolite R2 measurements allow for T2-corrected metabolite concentrations6. Tissue metabolite relaxometry is commonly based on multiple PRESS acquisitions at different echo times resulting in long scan times. In this study, we evaluated the feasibility of using a single-echo PRESS acquisition with full echo sampling7 for brain metabolite R2 estimations and compared them with conventional R2Hahn values obtained from multiple PRESS acquisitions.Methods
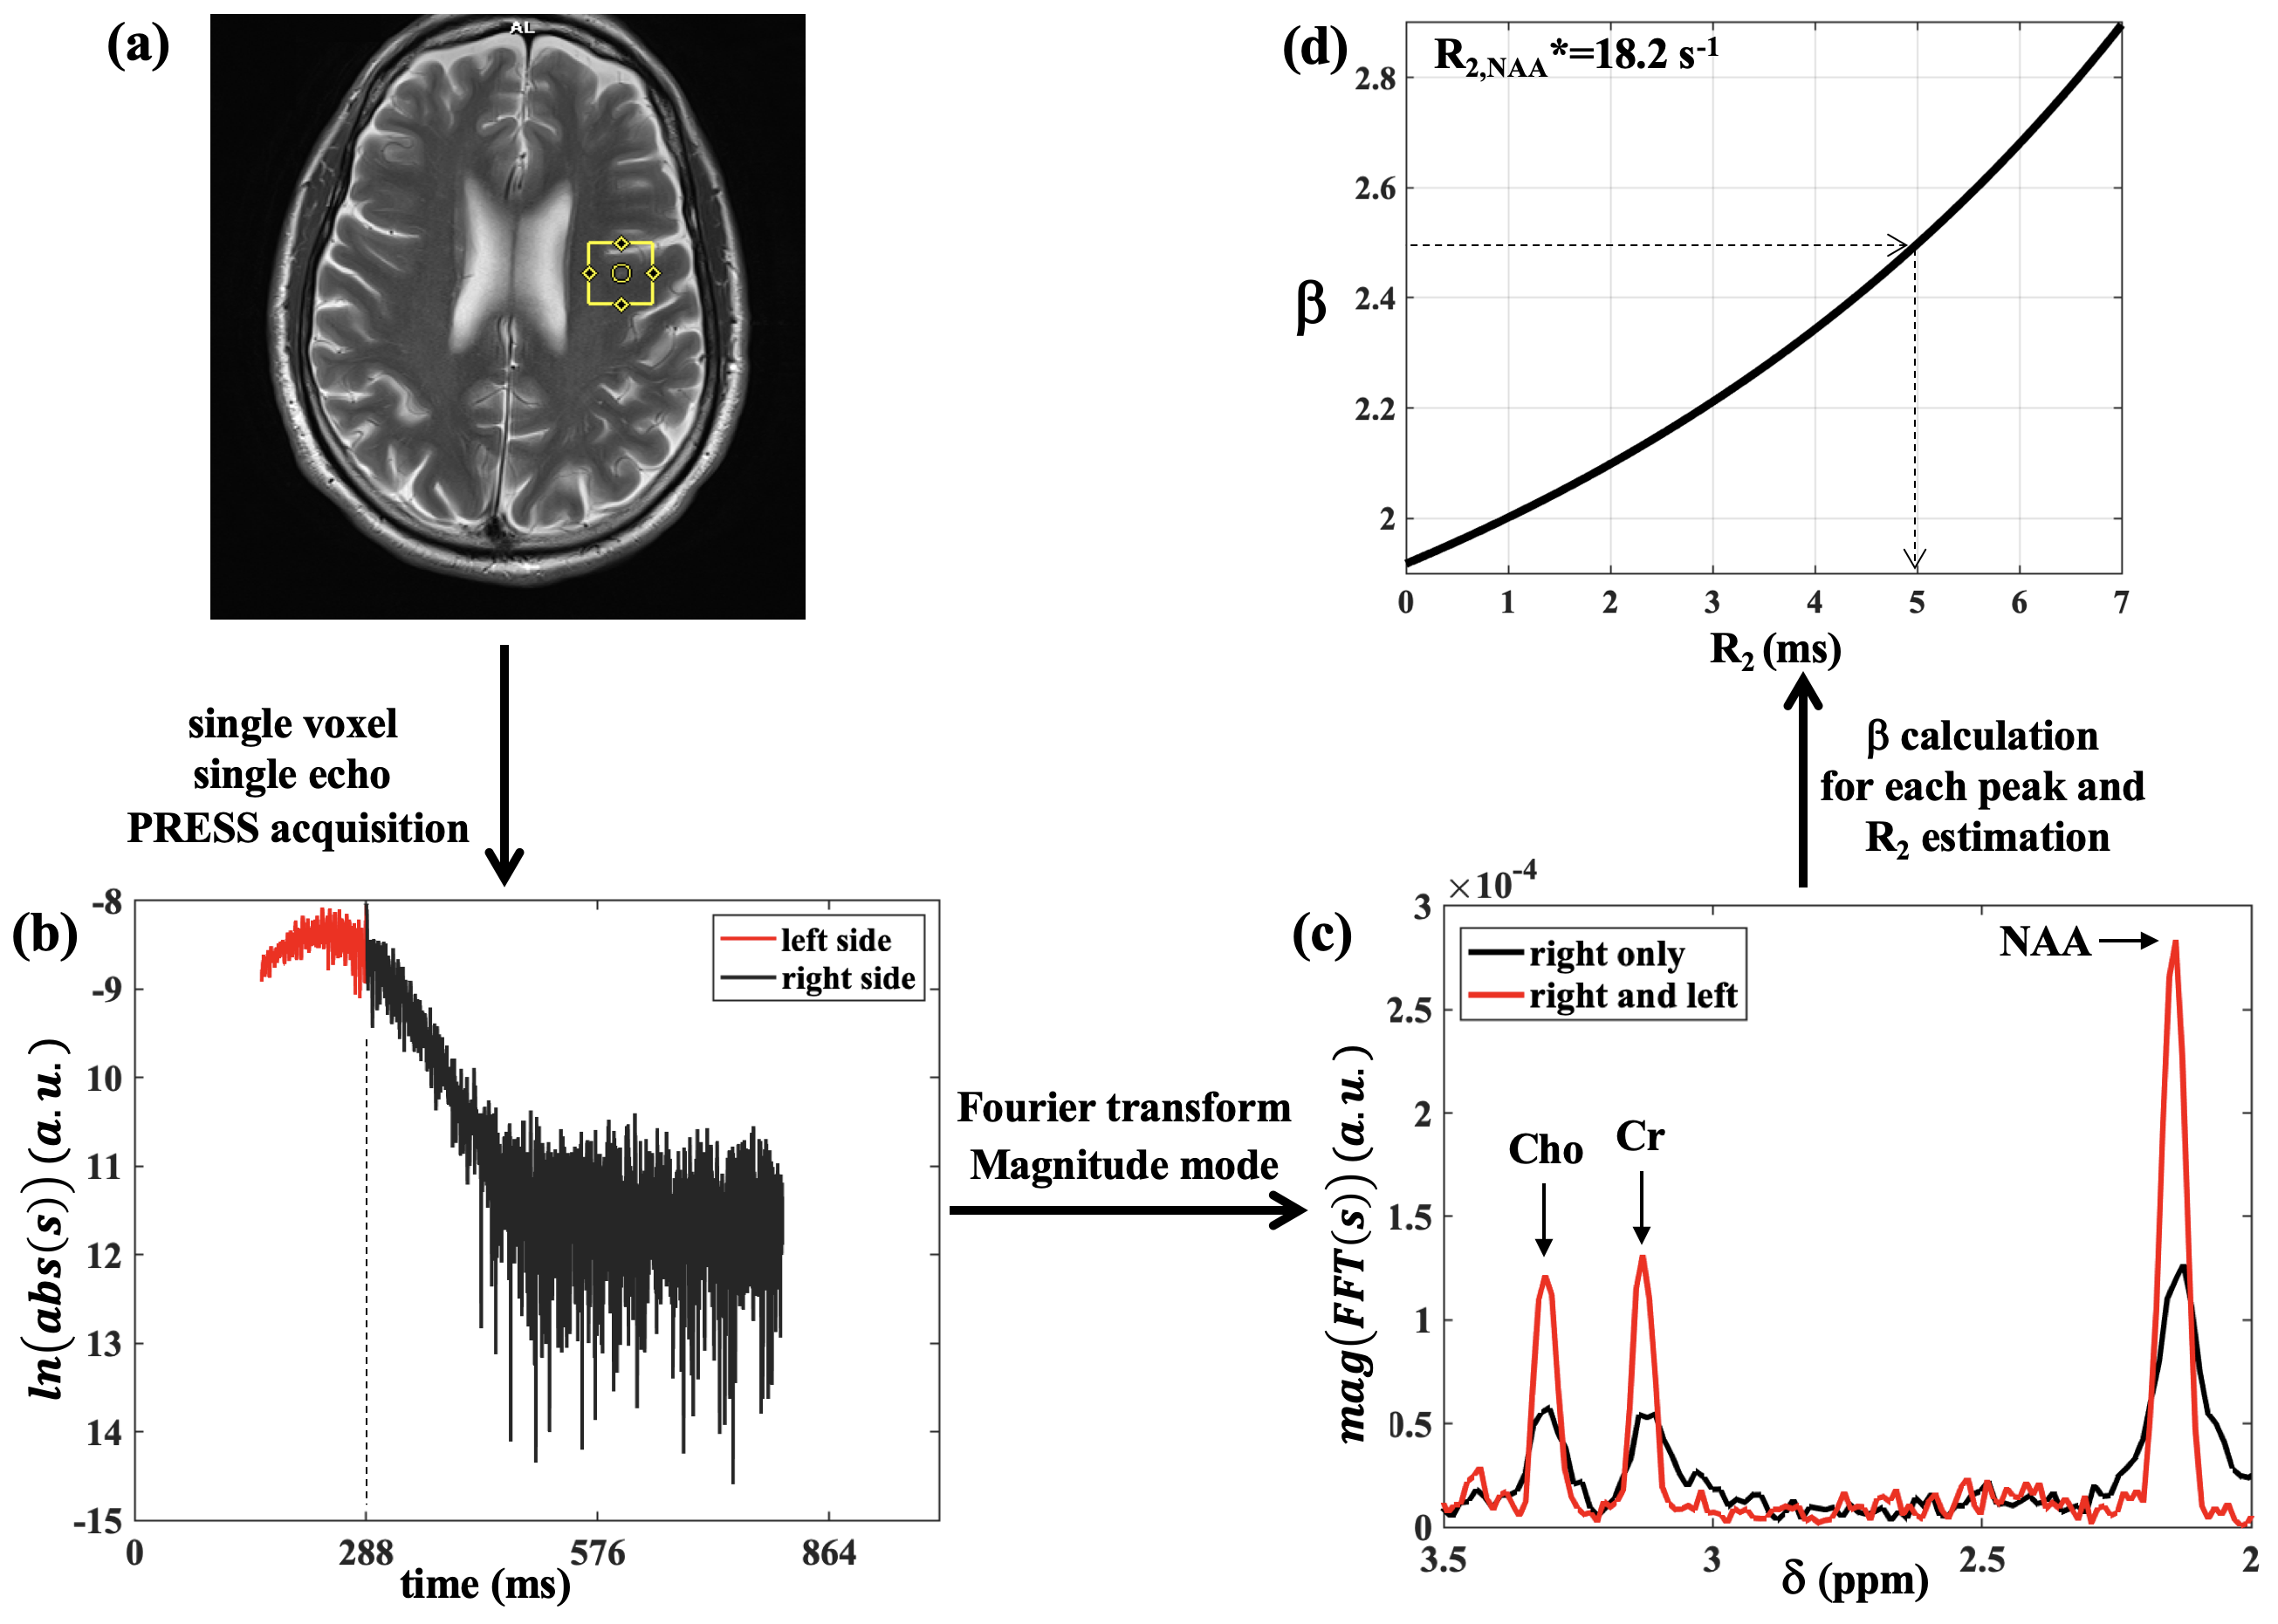
Three healthy adult subjects, having given informed consent, were scanned on a 3T Siemens Trio scanner using a 32-channel head coil. One subject was scanned twice with ~2yr interval (subject A/A’). Single voxel (2×2×2cm3) water-suppressed PRESS data were acquired with five different echo times (TE’s) of 30, 144, 288, 360 and 432ms with a 3 s TR and with 48 or 96 signal averages. To test the methodology in a high SNR regime, similar data acquisition but without water suppression was performed on water phantoms with gadolinium concentrations ranging from 0.21 to 0.83 mM. For the single-echo R2 estimation, the TE = 288 ms data was used; the full echo (right and left side of TE) was sampled with spectral data acquisition beginning shortly after the last refocusing pulse yielding approximately 130 ms of data on the left side of the echo center and 512 ms on the right side. Magnitude-mode spectra from the Fourier transform (FT) of the full echo data (left-side + right-side), and magnitude-mode spectra from the FT of right-side-only data were used to calculate a ratio, β, of peak heights for each metabolite:$$ \beta= \frac{\text{peak height of the FT of the full echo}}{ \text{peak height of the FT of the right side only}} $$
R2 values were then evaluated using the transcendental equation7,8:
$$\beta=1+ \frac{R_2^*(1-e^{-(R_2^*-2R_{2})(\tau_{2}-\tau_{1})})}{R_2^*-2R_{2}} $$
where $$$\tau_{1}=0.007s$$$ is the delay between the first two RF pulses and $$$\tau_{2}=0.144s$$$ is the delay between the last two RF pulses. To calculate R2 *, Lorentzian fits of absorption-mode spectra from the FT of the right-side-only time domain data were used to measure full-widths-at-half maxima (FWHM) and R2* values were estimated as πFWHM. Fig.1d shows β plotted as a function of R2 for the NAA resonance of subject A’ (R2*= 18.2s-1) which was used to estimate the corresponding R2 value from the measured β.
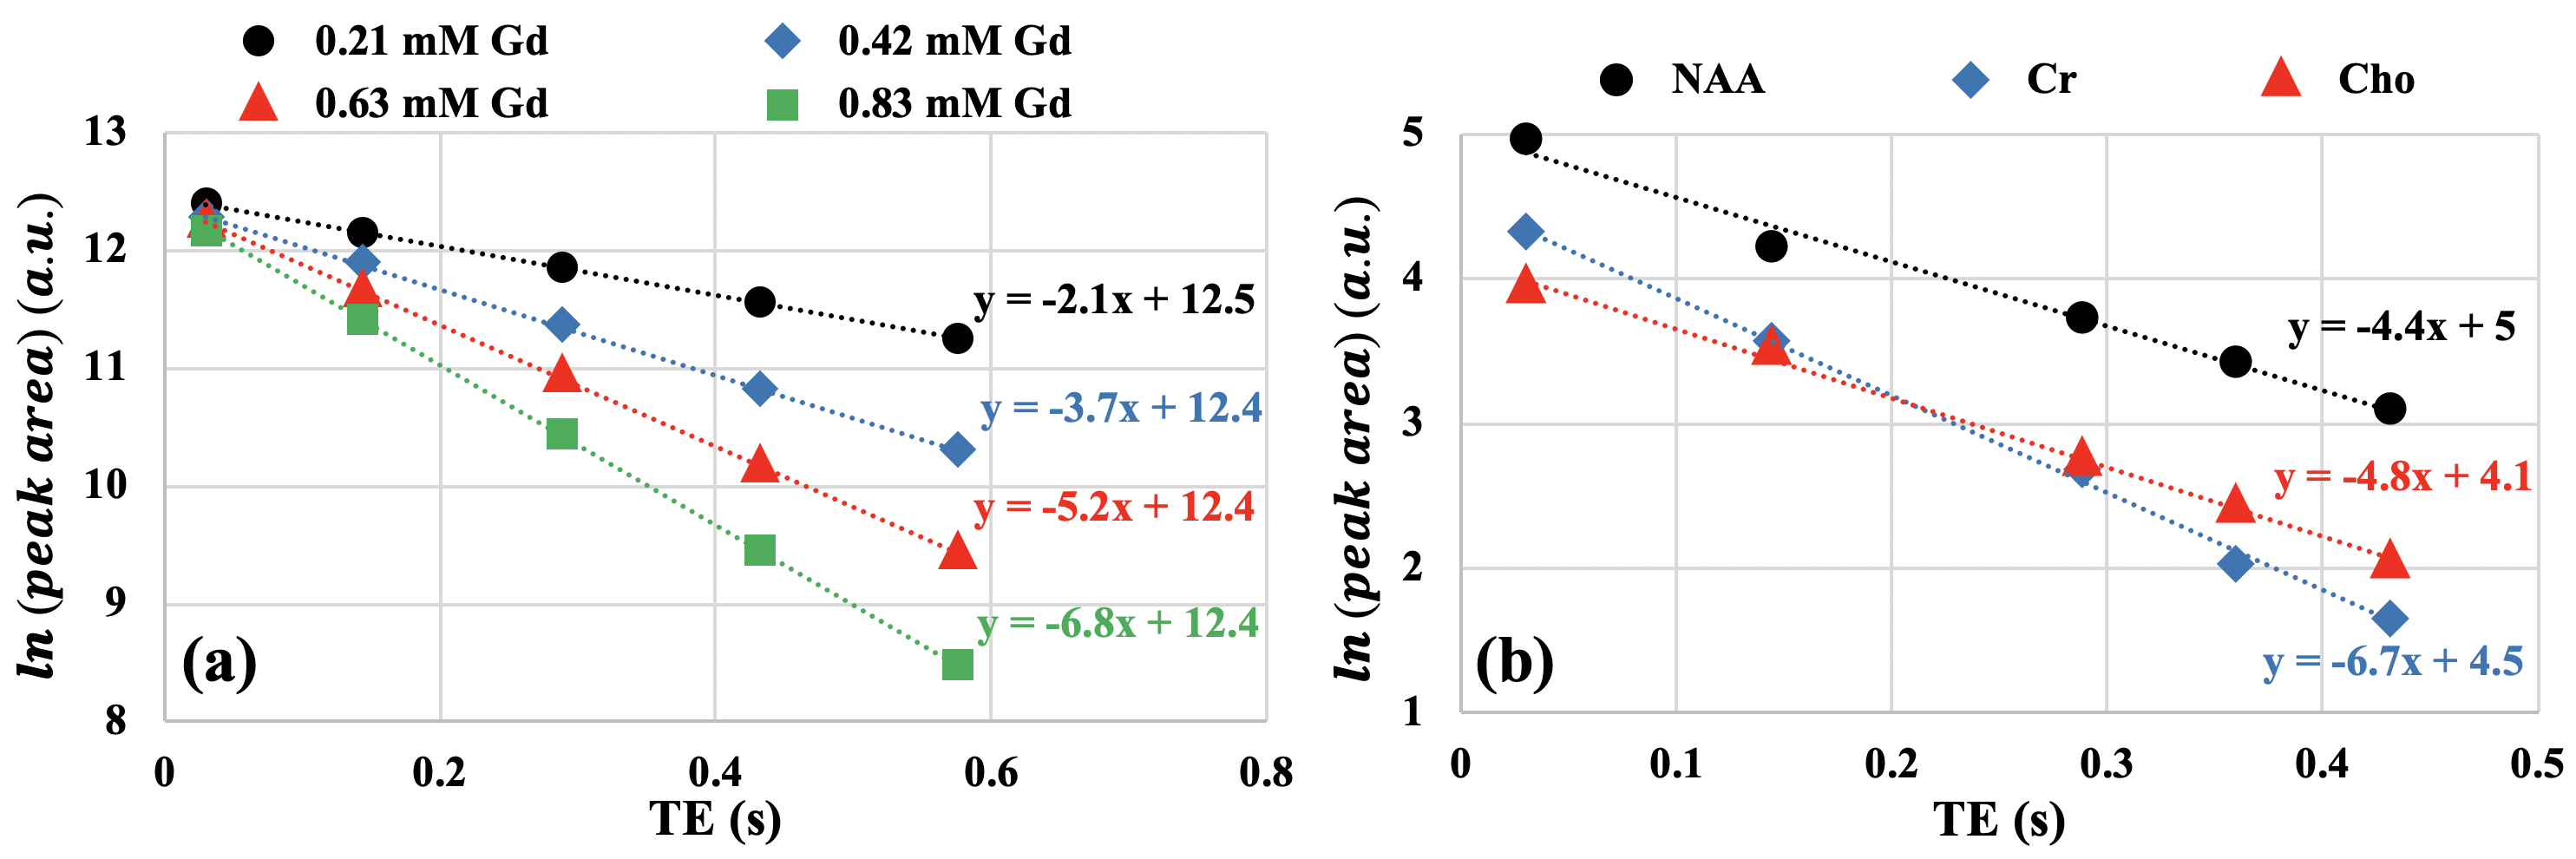
As shown in Fig. 2, R2Hahn values were estimated using mono-exponential fits to the peak areas extracted from Lorentzian fits to the right side absorption mode spectra vs TE to serve as "gold standard" for single echo R2 comparison.
Results
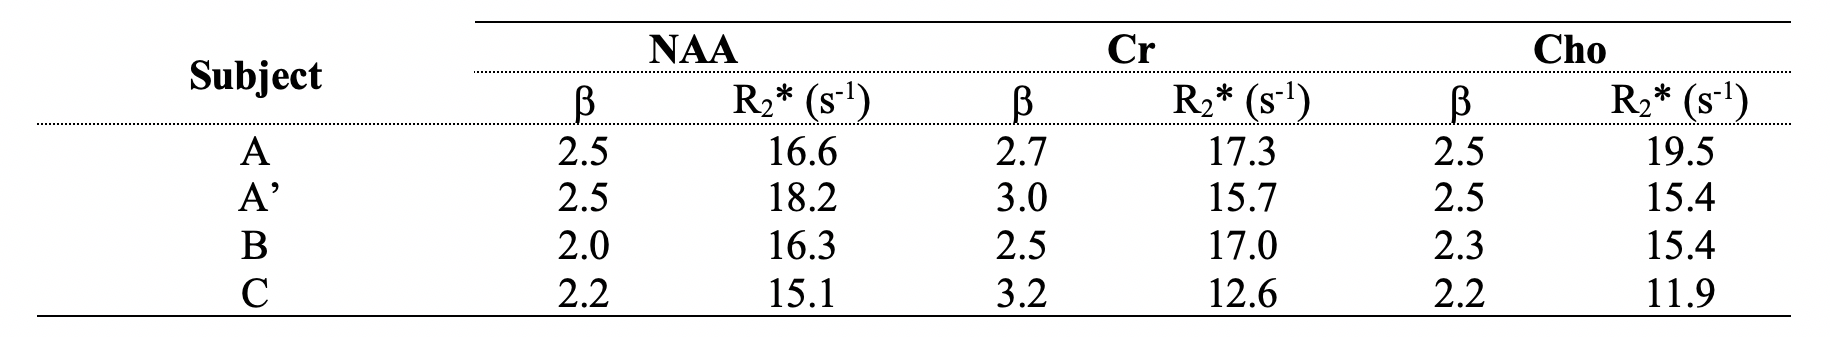
Fig.1 shows representative R2 estimation pipeline for subject A’ which includes location of the voxel for spectra acquisition (periventricular white matter tracts), fully sampled time domain signal (right and left side), magnitude mode spectra of the full echo (right and left) and right side only along with the corresponding β vs. R2 curve for one example.The β and R2* pairs that were used to extract R2 values from single echo acquisition (TE = 288 ms) data in all subjects are provided in Table 1. The mean ± SD R2 values from all subjects for NAA, Cr and Cho evaluated from these pairs were 3.8 ± 1.5 s-1, 6.6 ± 1.4 s-1 and 4.3 ±0.8 s-1, respectively, and compared favourably with the corresponding R2Hahn values of 4.0 ± 0.6 s-1, 6.5 ± 0.4 s-1 and 4.8 ± 0.4 s-1.
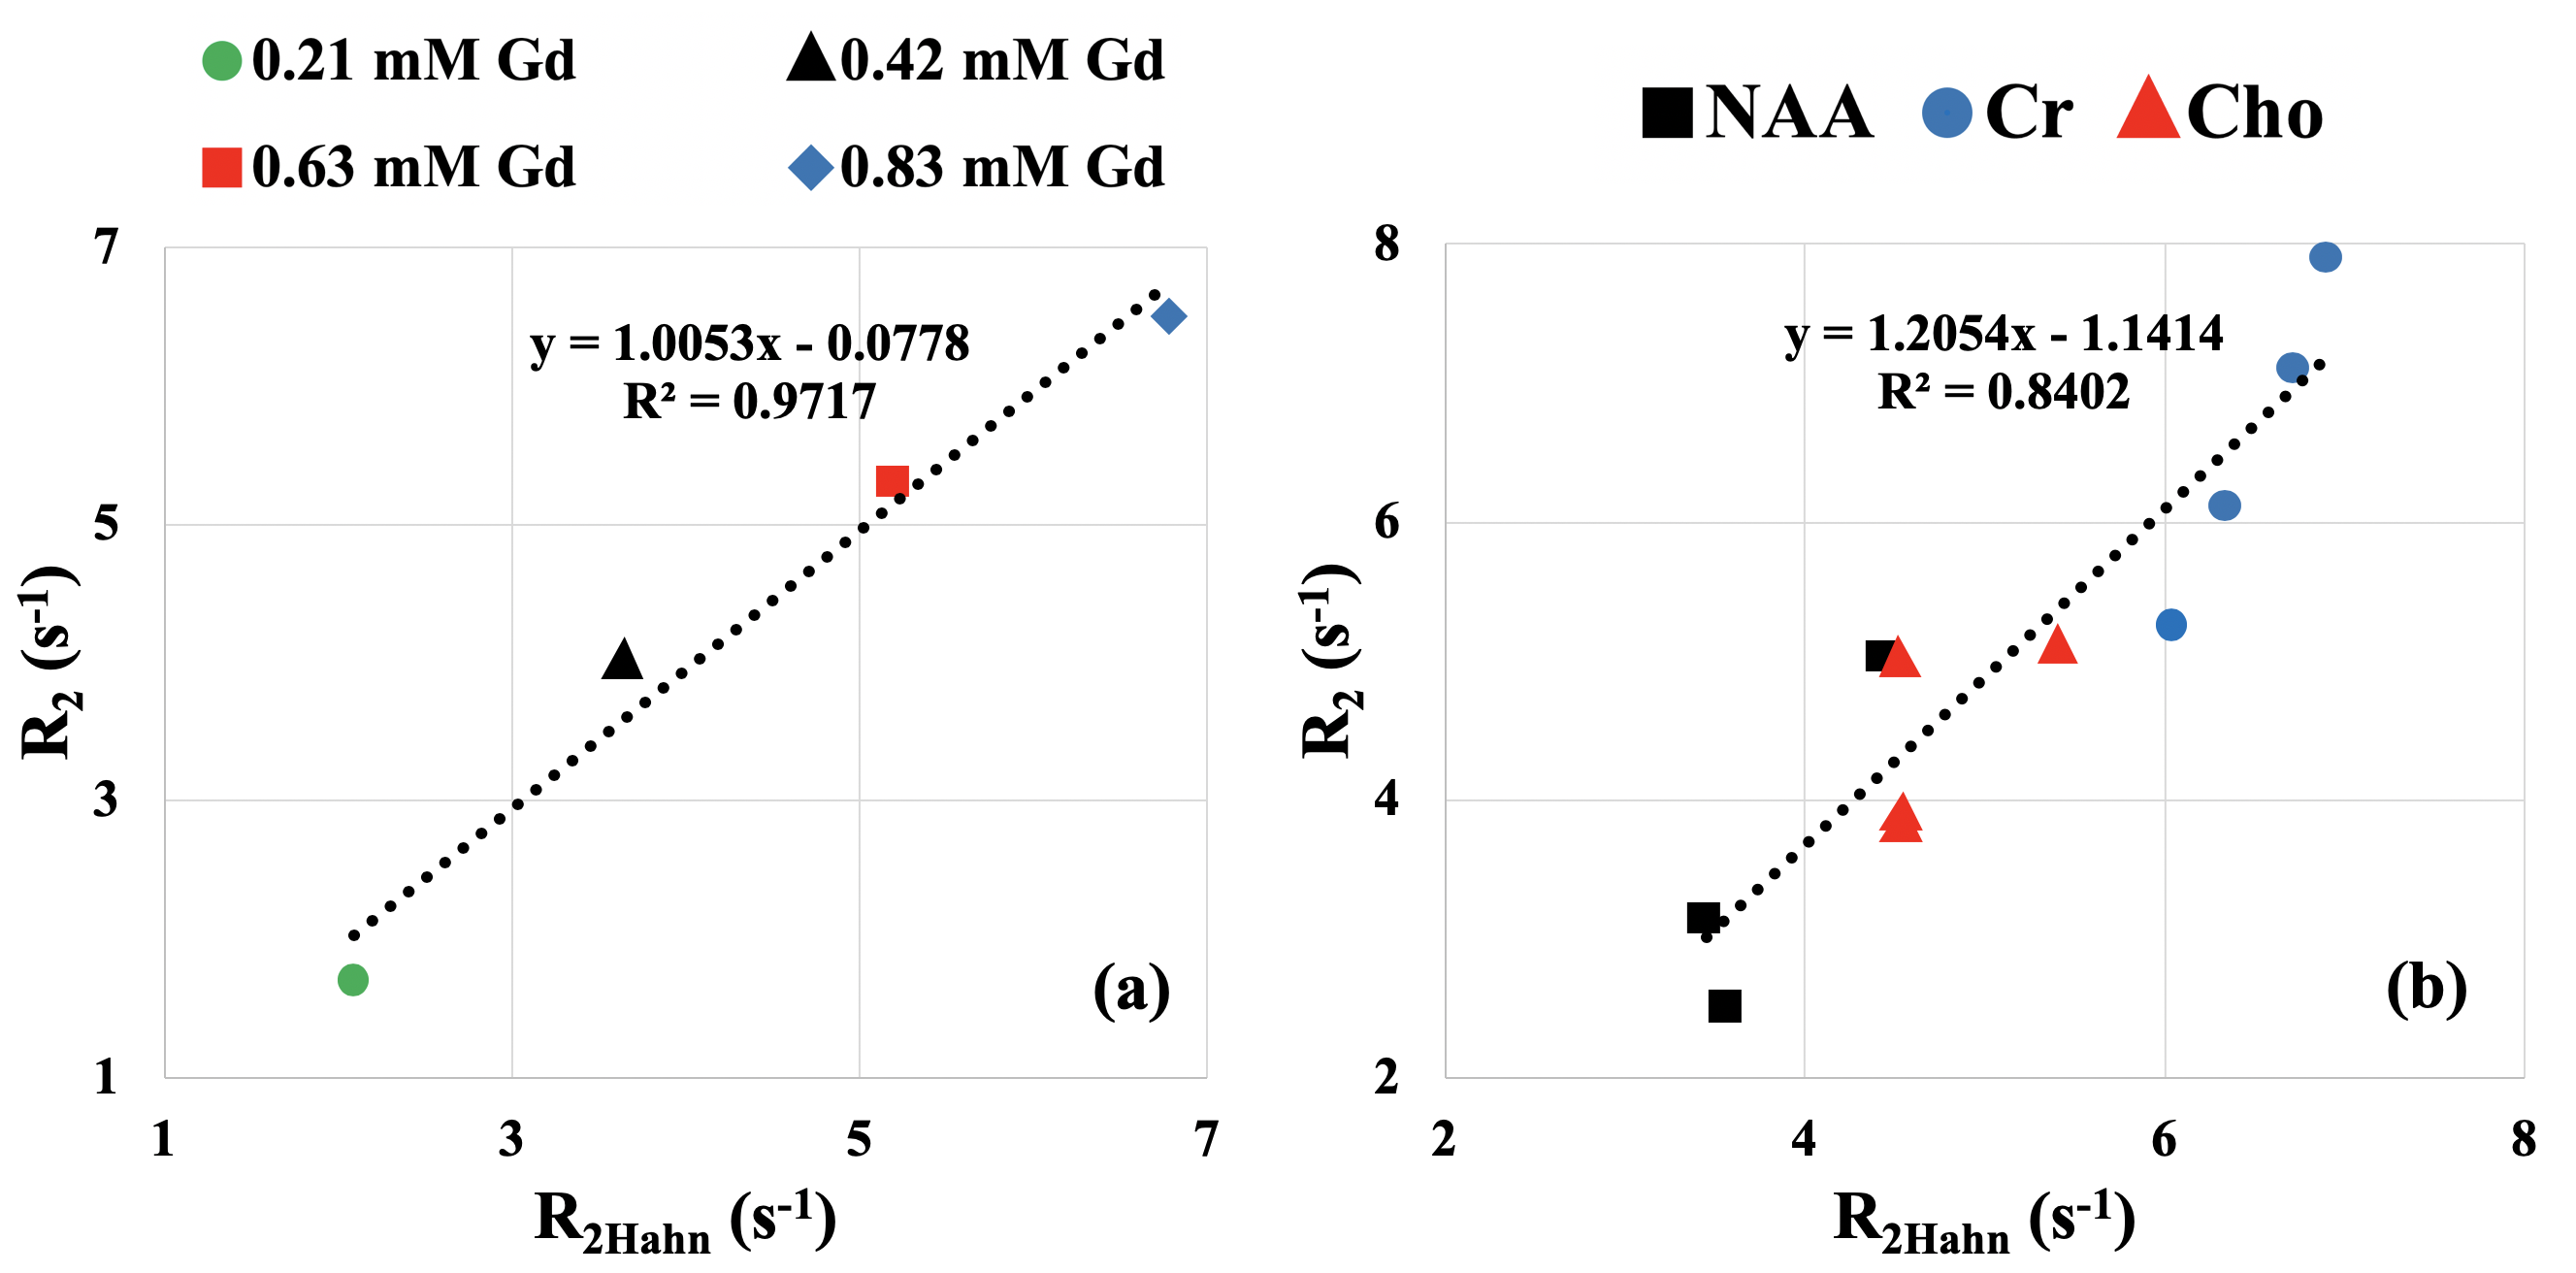
Fig. 3 demonstrates the correlation plots of R2Hahn vs R2 values extracted from the β and R2* pairs for gadolinium-doped water phantoms as well as all subjects. Linear fits to phantom (Fig. 3a) and all subject (Fig. 3b) data yielded slopes of 1.0 (R2 = 0.97) and 1.2 (R2 = 0.84) respectively.
Discussion
Spectroscopic measurements of brain metabolite R2 values are challenging due to low SNR and so generally require long scan times which can be difficult to accommodate particularly in very sick children where such measurements may prove useful2,6. In this work, we applied our recently proposed method for R2 estimation7,8 using a single-echo PRESS acquisition and provided reasonably accurate (with respect to R2Hahn) estimation of R2 under both high SNR regime in phantoms (92±8% accuracy) as well as low SNR brain metabolite (88±7% accuracy) in five times less scan time than that used for the R2Hahn measurements. The precision of the single-echo method relies on a reliable measurement of β, which is more challenging in the low SNR regime of metabolite spectroscopy than in high SNR regime of gadolinium-doped water phantoms. Further work to identify optimal full echo sampling parameters, including TE and the number of signal averages, remains to be done. However, the preliminary results of this study suggest that single-TE brain metabolite relaxometry is quite feasible and may have the potential to replace multiple PRESS acquisitions with different TE’s.Acknowledgements
No acknowledgement found.References
1. Dumoulin M, Zimmerman E, Hurd R, Hancu I. Increased brain metabolite T2 relaxation times in patients with Alzheimer’s disease. In: Proc. Intl. Soc. Mag. Reson. Med. ; 2005.
2. Ongür D, Prescot AP, Jensen JE, et al. T2 relaxation time abnormalities in bipolar disorder and schizophrenia. Magn Reson Med. 2010;63(1):1-8. doi:10.1002/mrm.22148
3. Walker PM, Ben Salem D, Lalande A, Giroud M, Brunotte F. Time course of NAA T2 and ADC(w) in ischaemic stroke patients: 1H MRS imaging and diffusion-weighted MRI. J Neurol Sci. 2004;220(1-2):23-28. doi:10.1016/j.jns.2004.01.012
4. Du F, Cooper A, Cohen BM, Renshaw PF, Öngür D. Water and metabolite transverse T2 relaxation time abnormalities in the white matter in schizophrenia. Schizophr Res. 2012;137(1-3):241-245. doi:10.1016/j.schres.2012.01.026
5. Kirov II, Fleysher L, Fleysher R, Patil V, Liu S, Gonen O. Age dependence of regional proton metabolites T2 relaxation times in the human brain at 3 T. Magn Reson Med. 2008;60(4):790-795. doi:10.1002/mrm.21715
6. Baker EH, Levin SW, Zhang Z, Mukherjee AB. Evaluation of disease progression in INCL by MR spectroscopy. Ann Clin Transl Neurol. 2015;2(8):797-809. doi:10.1002/acn3.222
7. Mulkern R V, Balasubramanian M. Spectroscopic sampling of the left side of long-TE spin echoes: a free lunch? MAGMA. 2018;31(2):321-340. doi:10.1007/s10334-017-0647-7
8. Mulkern R V, Balasubramanian M. On spectrally selective measurements of irreversible and reversible transverse relaxation rates from single voxel, single echo time PRESS acquisitions. In: Proc. Intl. Soc. Mag. Reson. Med. 26. ; 2018:1344.
Figures