2890
T2 relaxation times of seven individual macromolecules in rat brain 1H MR Spectra at 9.4T: single inversion recovery and AMARES post processing1LIFMET, EPFL, Lausanne, Switzerland, 2CIBM, EPFL, Lausanne, Switzerland
Synopsis
At short echo times 1H-MR spectra contain the contribution of mobile macromolecules (MM), i.e. broader resonances characterized by shorter relaxation times (T1,T2) which underlie the narrower peaks of metabolites. There are very few studies assessing MM T2 relaxation times, with only one study reporting T2-s of individual MM peaks in the full ppm range at 9.4T in the human brain. In this work we present a new approach: single inversion recovery with an optimized inversion time combined with AMARES post-processing. Using this technique we quantified 10-MM components and estimated T2 relaxation times (for 7-MM components) in rat brain at 9.4T.
Introduction
At short echo times (TE) 1H-MR spectra contain the contribution of mobile macromolecules (MM), i.e. broader resonances characterized by shorter relaxation times (T1 and T2) which underlie the narrower peaks of metabolites. There are very few studies assessing the MM T2 relaxation times1–3, with only one study reporting T2-s of individual MM peaks in the full ppm range at 9.4 T in the human brain4. Otherwise, only the peaks till 1.7ppm have been reported or full MM2 or grouped MM3 T2s, since measuring T2 of all individual MM is not straightforward due to the overlapping metabolites and requires more complex and sophisticated approaches. In this work we present a new approach: a single inversion recovery (IR) with an optimized inversion time combined with AMARES post-processing, allowing to quantify 10 MM components and estimate T2 relaxation times for 7 MM components in the rat brain at 9.4 T.Methods
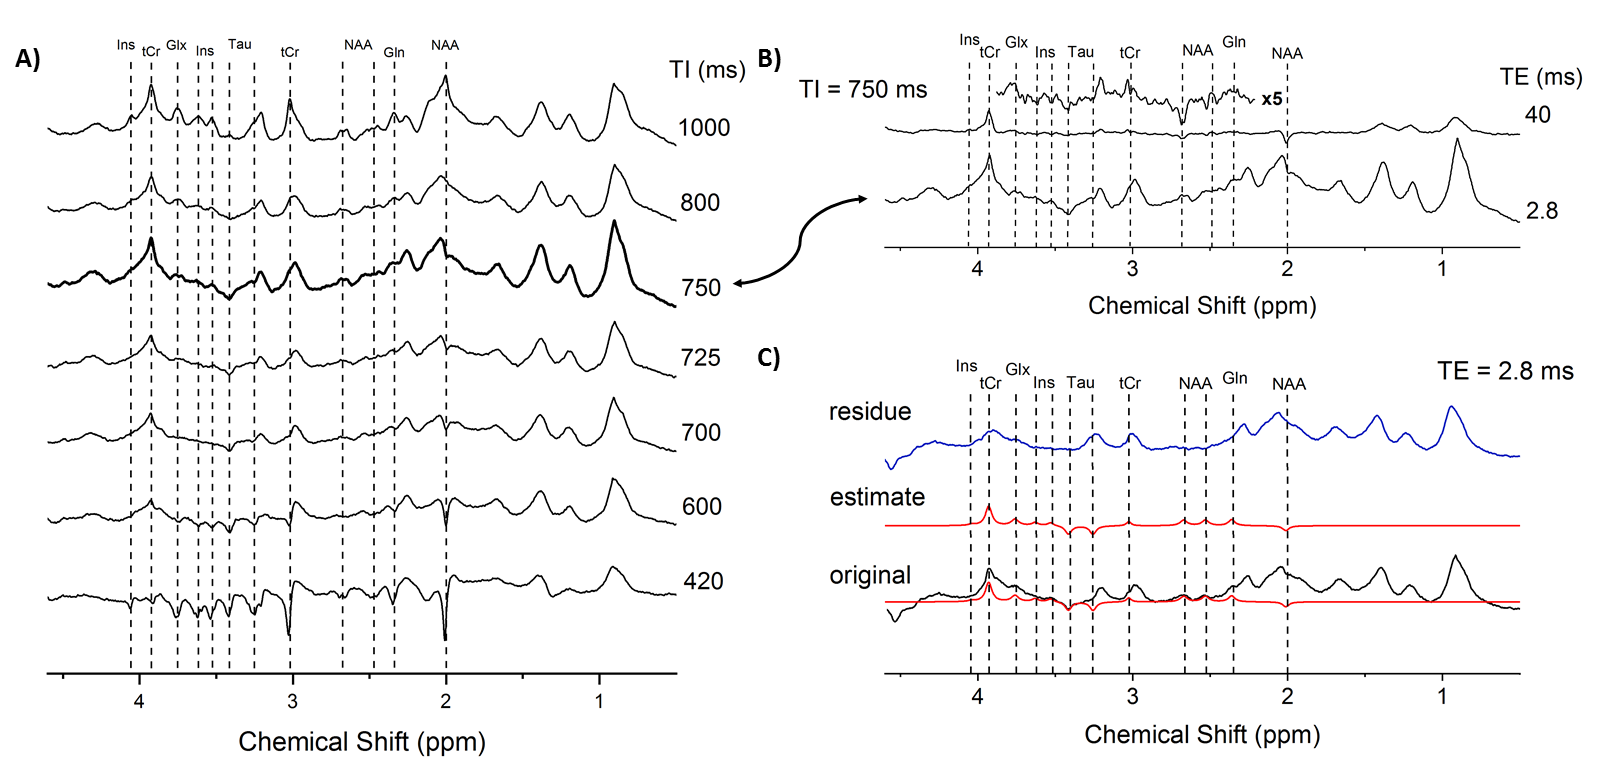
For measuring the in vivo spectrum of macromolecules, the SPECIAL5 sequence was extended with a 2 ms non-selective hyperbolic secant inversion pulse, applied at an inversion time (TI) of 750 ms before starting the localization part of the sequence6. All the in vivo MM spectra were acquired in rat brain (9.4 T system Magnex Scientific) in a voxel of 3x3x3 mm3 centered on the hippocampus (n=5). This VOI was selected in order to increase the SNR while it is well accepted that MM do not substantially change between brain regions in rodents7,8. The metabolite residuals present in the acquired MM spectrum were identified using: 1) a series of IR spectra using a full range of TI (i.e. 420-1000 ms); and 2) and IR spectrum with a longer echo time (TE around 40 ms) to confirm the presence of the residual metabolite signals (Figure 1A-B).For the measurement of MM T2 relaxation times the TE was varied from 2.8 to 150 ms (TE=2.8, 4, 6, 8, 10, 12, 16, 20, 40, 60, 100, 120 and 150 ms, TI=750 ms).
Data processing
Elimination of metabolite residuals
The spectra were phased individually in jMRUI (http://www.mrui.uab.es/mrui/) and 2 Hz of line broadening was applied. Each MM spectrum was manually inspected to determine the presence of metabolite residuals based on the spectra acquired at different TIs (TE=2.8 ms) and at the TE=40 ms (TI=750 ms) (Figure 1A-B). Using AMARES algorithm9 (advanced method for accurate, robust and efficient spectral fitting) the constraints on the peak frequency, phase, linewidth (lw) and amplitude were fixed to fit the residual metabolites (Ins, tCr, Glx, Tau, NAA) and thus their contribution was removed from the MM spectra (Figure 1C).
Quantification of the MM and T2 fits
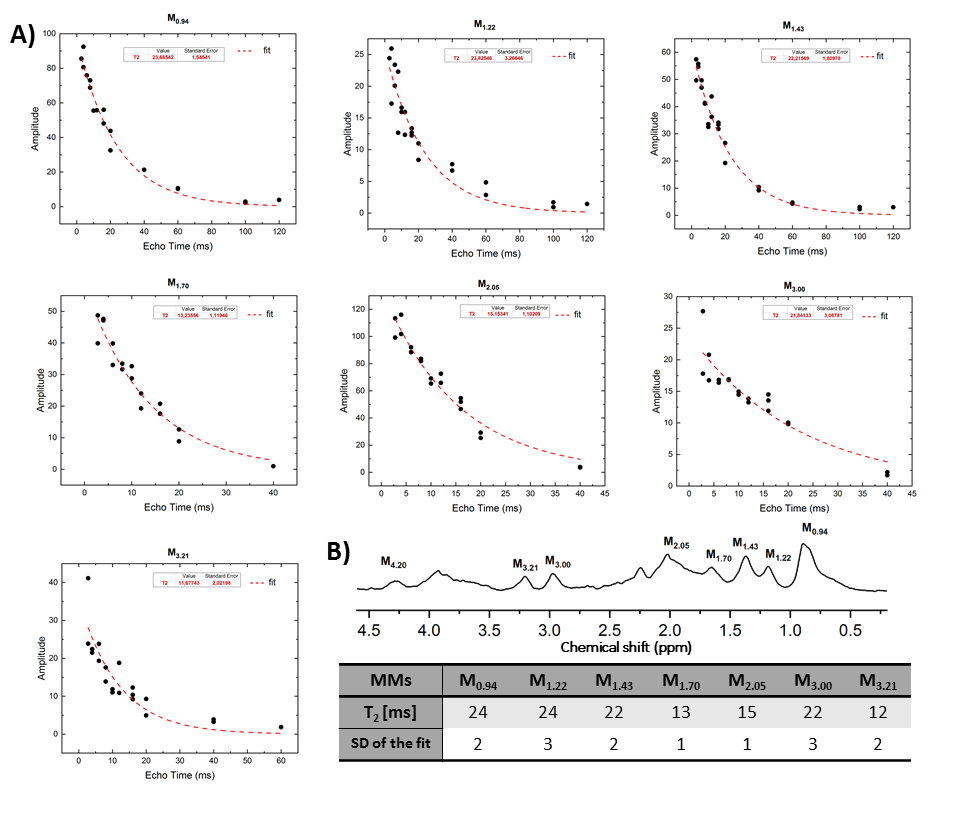
MM were then divided into 10 components (Figure 2) and quantified using AMARES. Each MM component was quantified using several Lorentzian lines in order to obtain the best possible match with the original spectra. Figure 2 shows the constraints in frequency, number of peaks and linewidth which were given to AMARES as prior knowledge for quantification, while the amplitude was left to be estimated freely by the algorithm. After each quantification, the spectra were manually inspected. In some cases (longer TEs) soft constraints on the amplitudes of the peaks were additionally imposed to avoid over or underestimation. Since the spectra were acquired from 5 different animals, the obtained MM amplitudes for all the TEs were normalized to one rat always using M0.94 component. M0.94 was used since it is reliably quantified and does not overlap with metabolite resonances. The quantified and normalized amplitudes were fitted to a single exponential decay across the TE series to estimate the T2 relaxation times.
Results and discussion
The excellent quality of the in vivo acquired MM is shown in Figure 1. All acquired spectra showed excellent SNR. The proposed post-processing method was efficient and robust in removing all the residual metabolites providing clean MM spectra for quantification and fitting. All the 10 components were quantified (at different TEs). For 7 components reliable exponential decay fits were obtained (standard deviation of the fit was lower than 20%), leading to reliable T2 estimations. The MM at 0.94, 1.22, 1.43 and 3.00 ppm all presented similar T2 relaxation times in-between 22-24 ms, the ones at 1.70, 2.05, 3.21 were in-between 12-15 ms. The obtained fits and T2 values are shown in Figure 3A,B and are in good agreement with previously reported values1,4.Conclusion
This study proposed a novel methodological approach allowing reliable post-processing and quantification of the MM spectra, together with T2 relaxation time estimates of 7 individual MM components in the rat brain at 9.4 T. The described method also provides an efficient tool for a potential parametrization of individual MM. The information obtained by parametrization can be further used as an individual MM basis set for spectral quantification and detection of individual MM changes in pathologies. Furthermore, this approach can fully characterize the MM spectra at different TIs and TEs and this can provide a comprehensive set of information necessary in a MM dictionary for MR fingerprinting10.Acknowledgements
Financial support: SNSF project no 310030_173222/1 and by the CIBM (UNIL, UNIGE, HUG, CHUV, EPFL, as well as the Leenaards and Jeantet Foundations), the CHUV and the HUG.References
1. De Graaf, R. A. et al. High magnetic field water and metabolite proton T1 and T 2 relaxation in rat brain in vivo. Magn. Reson. Med. 56, 386–394 (2006).
2. Pfeuffer, J., Tkáč, I., Provencher, S. W. & Gruetter, R. Toward an in Vivo Neurochemical Profile: Quantification of 18 Metabolites in Short-Echo-Time 1H NMR Spectra of the Rat Brain. J. Magn. Reson. 141, 104–120 (1999).
3. Lopez-Kolkovsky, A. L., Mériaux, S. & Boumezbeur, F. Metabolite and macromolecule T 1 and T 2 relaxation times in the rat brain in vivo at 17.2T. Magn. Reson. Med. 75, 503–514 (2016).
4.Borbath, T., Manohar, S. M., Wright, A. M. & Henning, A. T2 Relaxation Times of Macromolecules in Human Brain Spectra at 9.4 T. Proc ISMRM 2244 (2019).
5. Mlynárik, V., Gambarota, G., Frenkel, H. & Gruetter, R. Localized short-echo-time proton MR spectroscopy with full signal-intensity acquisition. Magn. Reson. Med. 56, 965–970 (2006).
6. Mlynárik, V., Cudalbu, C., Xin, L. & Gruetter, R. 1H NMR spectroscopy of rat brain in vivo at 14.1 Tesla: Improvements in quantification of the neurochemical profile. J. Magn. Reson. 194, 163–168 (2008).
7. Craveiro, M., Cudalbu, C. & Gruetter, R. Regional alterations of the brain macromolecule resonances investigated in the mouse brain using an improved method for the pre-processing of the macromolecular signal. 20, 2012 (2012).
8. Xin, L., Mlynarik, V., Lei, H. & Gruetter, R. Influence of regional macromolecule baseline on the quantification of neurochemical profile in rat brain. Proc. Intl. Soc. Mag. Reson. Med. 5 (2010).
9. Vanhamme, L., Van Den Boogaart, A. & Van Huffel, S. Improved Method for Accurate and Efficient Quantification of MRS Data with Use of Prior Knowledge. J. Magn. Reson. 129, 35–43 (1997).
10. Hoefemann, M., Bolliger, C., van derVeen, J. W. & Kreis,
R. About the need for a comprehensive description of the macromolecular
baseline signal for MR fingerprinting and multidimensional fitting of MR
spectra. Ismrm 1069 (2019).
Figures