2885
Leveraging large publicly available datasets to benchmark new 1H-MRS modeling methods against established algorithms1Russell H. Morgan Department of Radiology and Radiological Science, The Johns Hopkins University School of Medicine, Baltimore, MD, United States, 2F. M. Kirby Research Center for Functional Brain Imaging, Kennedy Krieger Institute, Baltimore, MD, United States
Synopsis
Contemporary linear-combination modeling (LCM) methods for MRS data are usually implemented in compiled, ‘black-box’ fashion. The ability to modify underlying algorithms and/or introduce novel quantification approaches may improve the transparency, robustness and accuracy of metabolite estimation, but there is no established framework for rapid prototyping of modeling algorithms and benchmarking their performance. Here, we use a large, publicly available 3T PRESS dataset from multiple sites and vendors to assess the performance of a new open-source LCM algorithm, featured in a new MRS data analysis toolbox (‘Osprey’, github.com/schorschinho/osprey). Quantification of four major metabolites is compared to the widely used LCModel algorithm.
Introduction
Proton magnetic resonance spectroscopy (1H-MRS) is commonly used to study metabolism in the human brain. Modeling of MRS spectra is a crucial analysis step to obtain quantitative information. Commonly used quantification methods model the data as a linear combination of metabolite basis spectra, maximizing the use of prior knowledge to constrain the model solution. Various linear-combination modeling (LCM) approaches have been integrated into widely used commercial1 and open-source2–4 analysis programs. Because this software is distributed in compiled form, it is difficult for users to modify the underlying quantification algorithms or introduce new quantitative models.Here, we demonstrate how a large, publicly available MRS dataset can be leveraged to gauge the performance of a new, fully accessible and modifiable quantification algorithm that is included in the fully-open-source MRS analysis software package Osprey (github.com/schorschinho/osprey). Quantitative outcomes for major metabolites (tNAA/tCr, tCho/tCr, Glx/tCr, mI/tCr) are compared to results obtained using the legacy software LCModel.
Methods
296 single-voxel PRESS spectra from a multisite study5 (f/m: 155/141; mean age = 26.4 ± 4.6 yrs) were analyzed. Data were acquired at 26 sites on scanners from three vendors with the following parameters: TR/TE = 2000/35 ms; 2, 4, or 5 kHz spectral bandwidth; 2048-4096 data points; scan time 2.13 min; V = 27 ml (cubic volume in the medial parietal lobe). Other acquisition parameters (such as water suppression, phase cycling, outer volume suppression, and B0 homogeneity adjustment) were chosen based on local preference. Water reference data were acquired with the same parameters without water suppression and 8-16 averages.All spectra were processed with MATLAB (The MathWorks Inc., Natick, MA) using functions from the FID-A toolbox6 either in an in-house written script or integrated in the Osprey toolbox. For the Osprey quantification raw data were coil-combined (GE, Siemens only) based on the water reference7 and an eddy-current correction8 was performed. Individual averages were aligned using spectral registration9. Finally, residual water was removed based on singular value decomposition10. The preprocessing for LCModel did not include water removal and eddy-current was performed within LCModel itself. Subsequently, spectra were quantified with LCModel v6.31 and Osprey.
The basis set included alanine, ascorbate, aspartate, creatine (Cr), gamma-aminobutyric acid, glucose, glutamine (Gln), glutamate (Glu), glutathione, glycerophosphocholine (GPC), lactate (Lac), myo-inositol (Ins), N-acetylaspartate (NAA), N-acetylaspartylglutamate (NAAG), phosphocholine (PCh), phosphocreatine (PCr), phosphoethanolamine, scyllo-inositol, and taurine. Basis spectra were generated with custom-built fully-localized 2D density-matrix simulations6 based on the vendor-native sequence implementations. Macromolecules/lipid basis functions were included in the basis sets as defined in LCModel and Tarquin (MM09, MM12, MM14, MM17, MM20, Lip09, Lip13, Lip20).
The Osprey algorithm used constrained non-linear least squares optimization to model the concatenation of the real and imaginary parts of a spectrum in the frequency domain with global (zero- and first-order phase, Gaussian line-broadening, cubic B-spline baseline) and basis-specific (amplitude, Lorentzian line-broadening, frequency shift) parameters. Constraints on non-linear parameters and relative macromolecule/lipid amplitudes are defined as in Tarquin2.
Metabolite concentration ratios relative to total creatine (tCr) were calculated from the model estimates of both toolboxes for tNAA (NAA+NAAG), tCho (GPC+PCh), Glx (Glu+Gln), and mI. Pearson’s correlation coefficients were calculated for all vendors.
Results
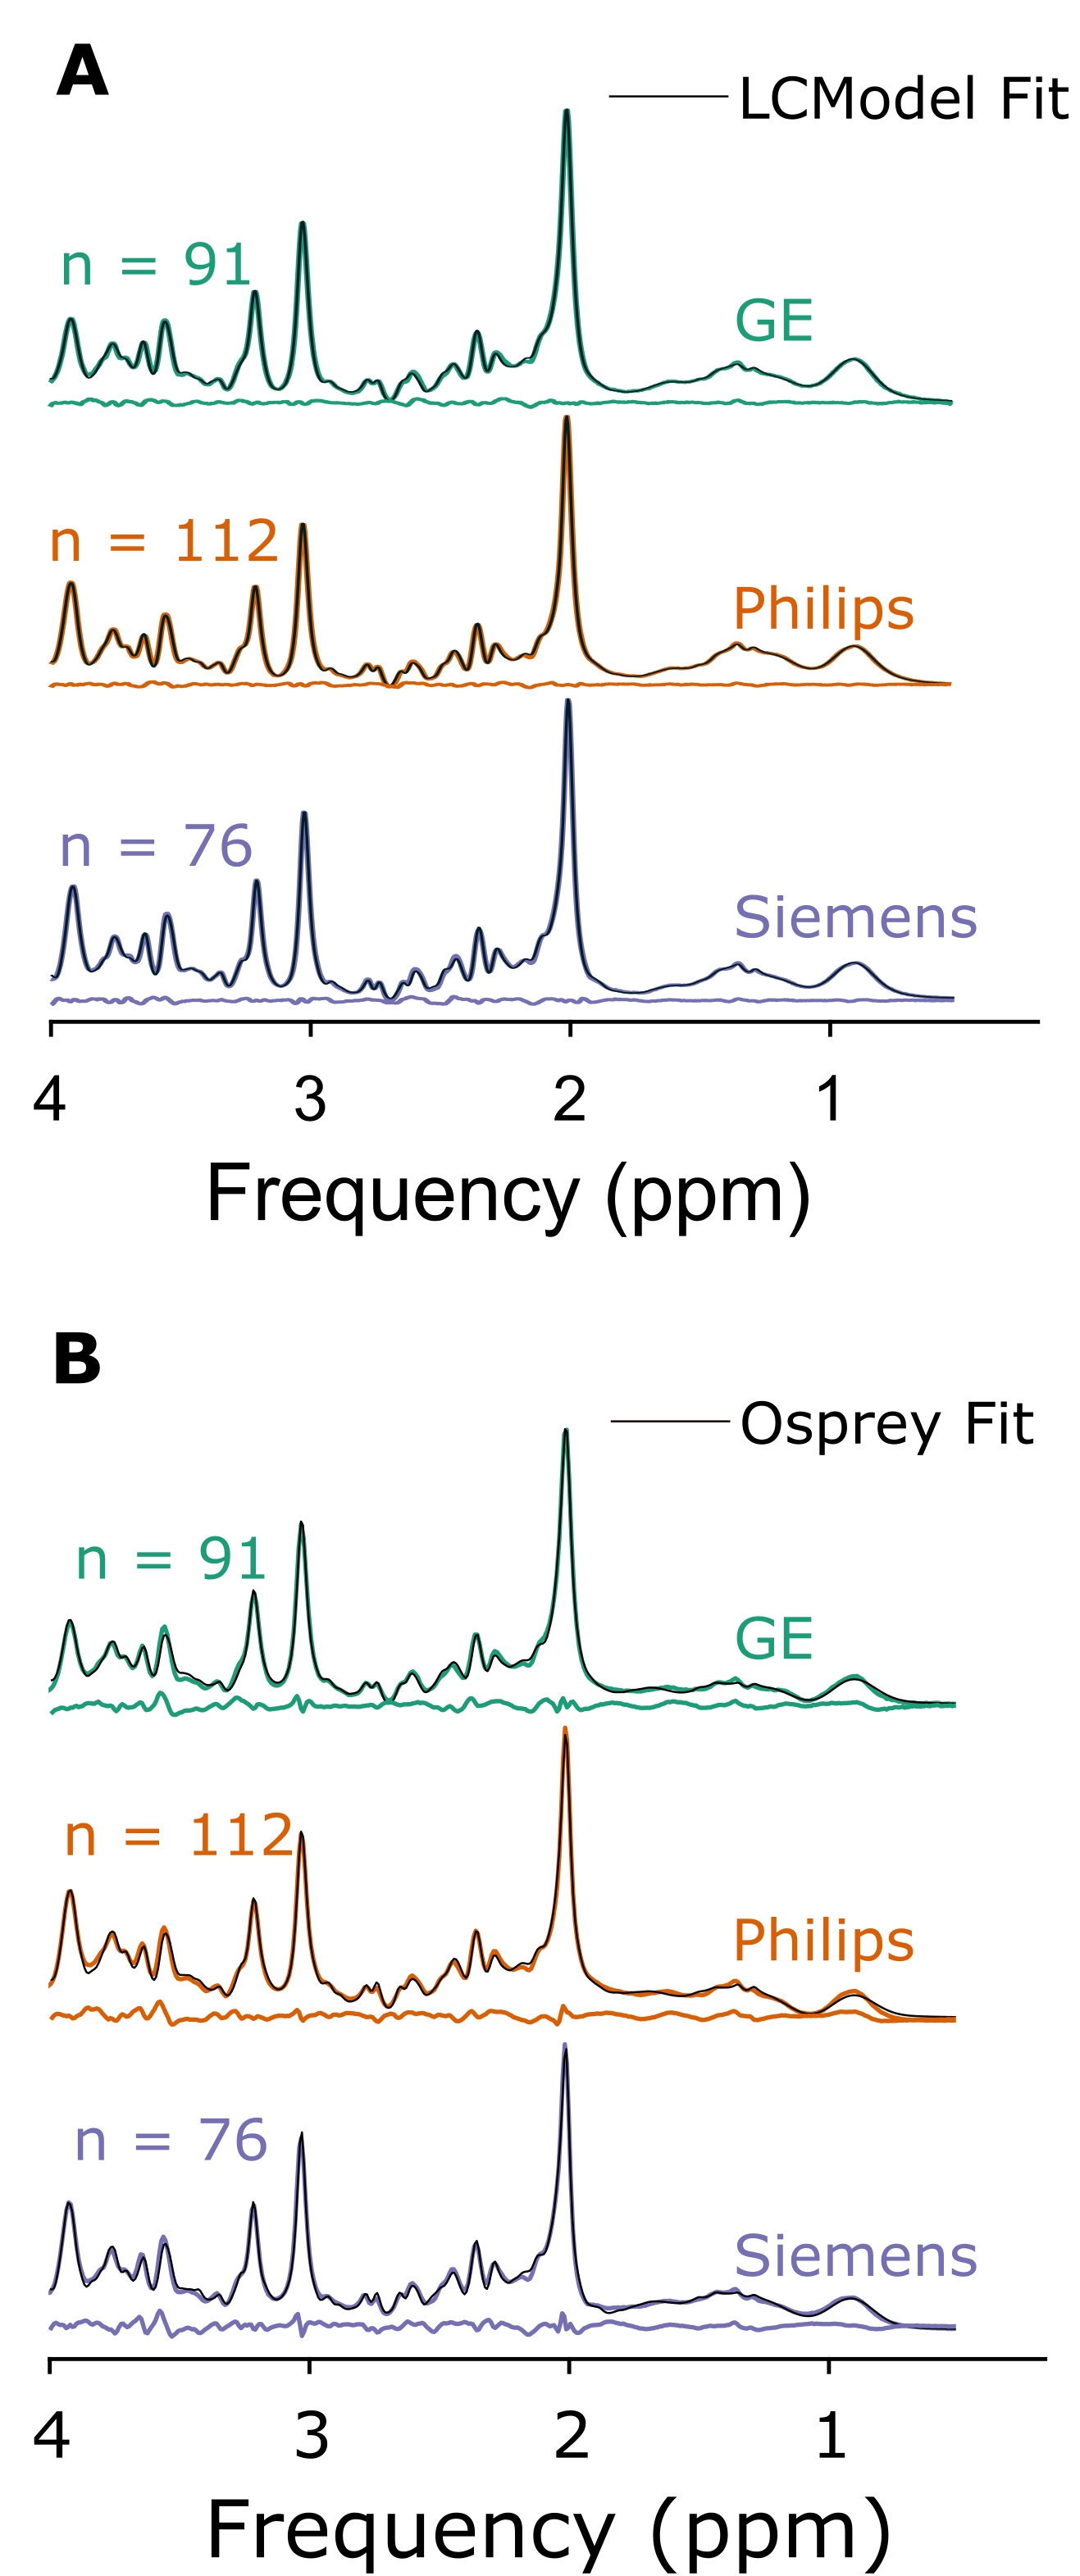
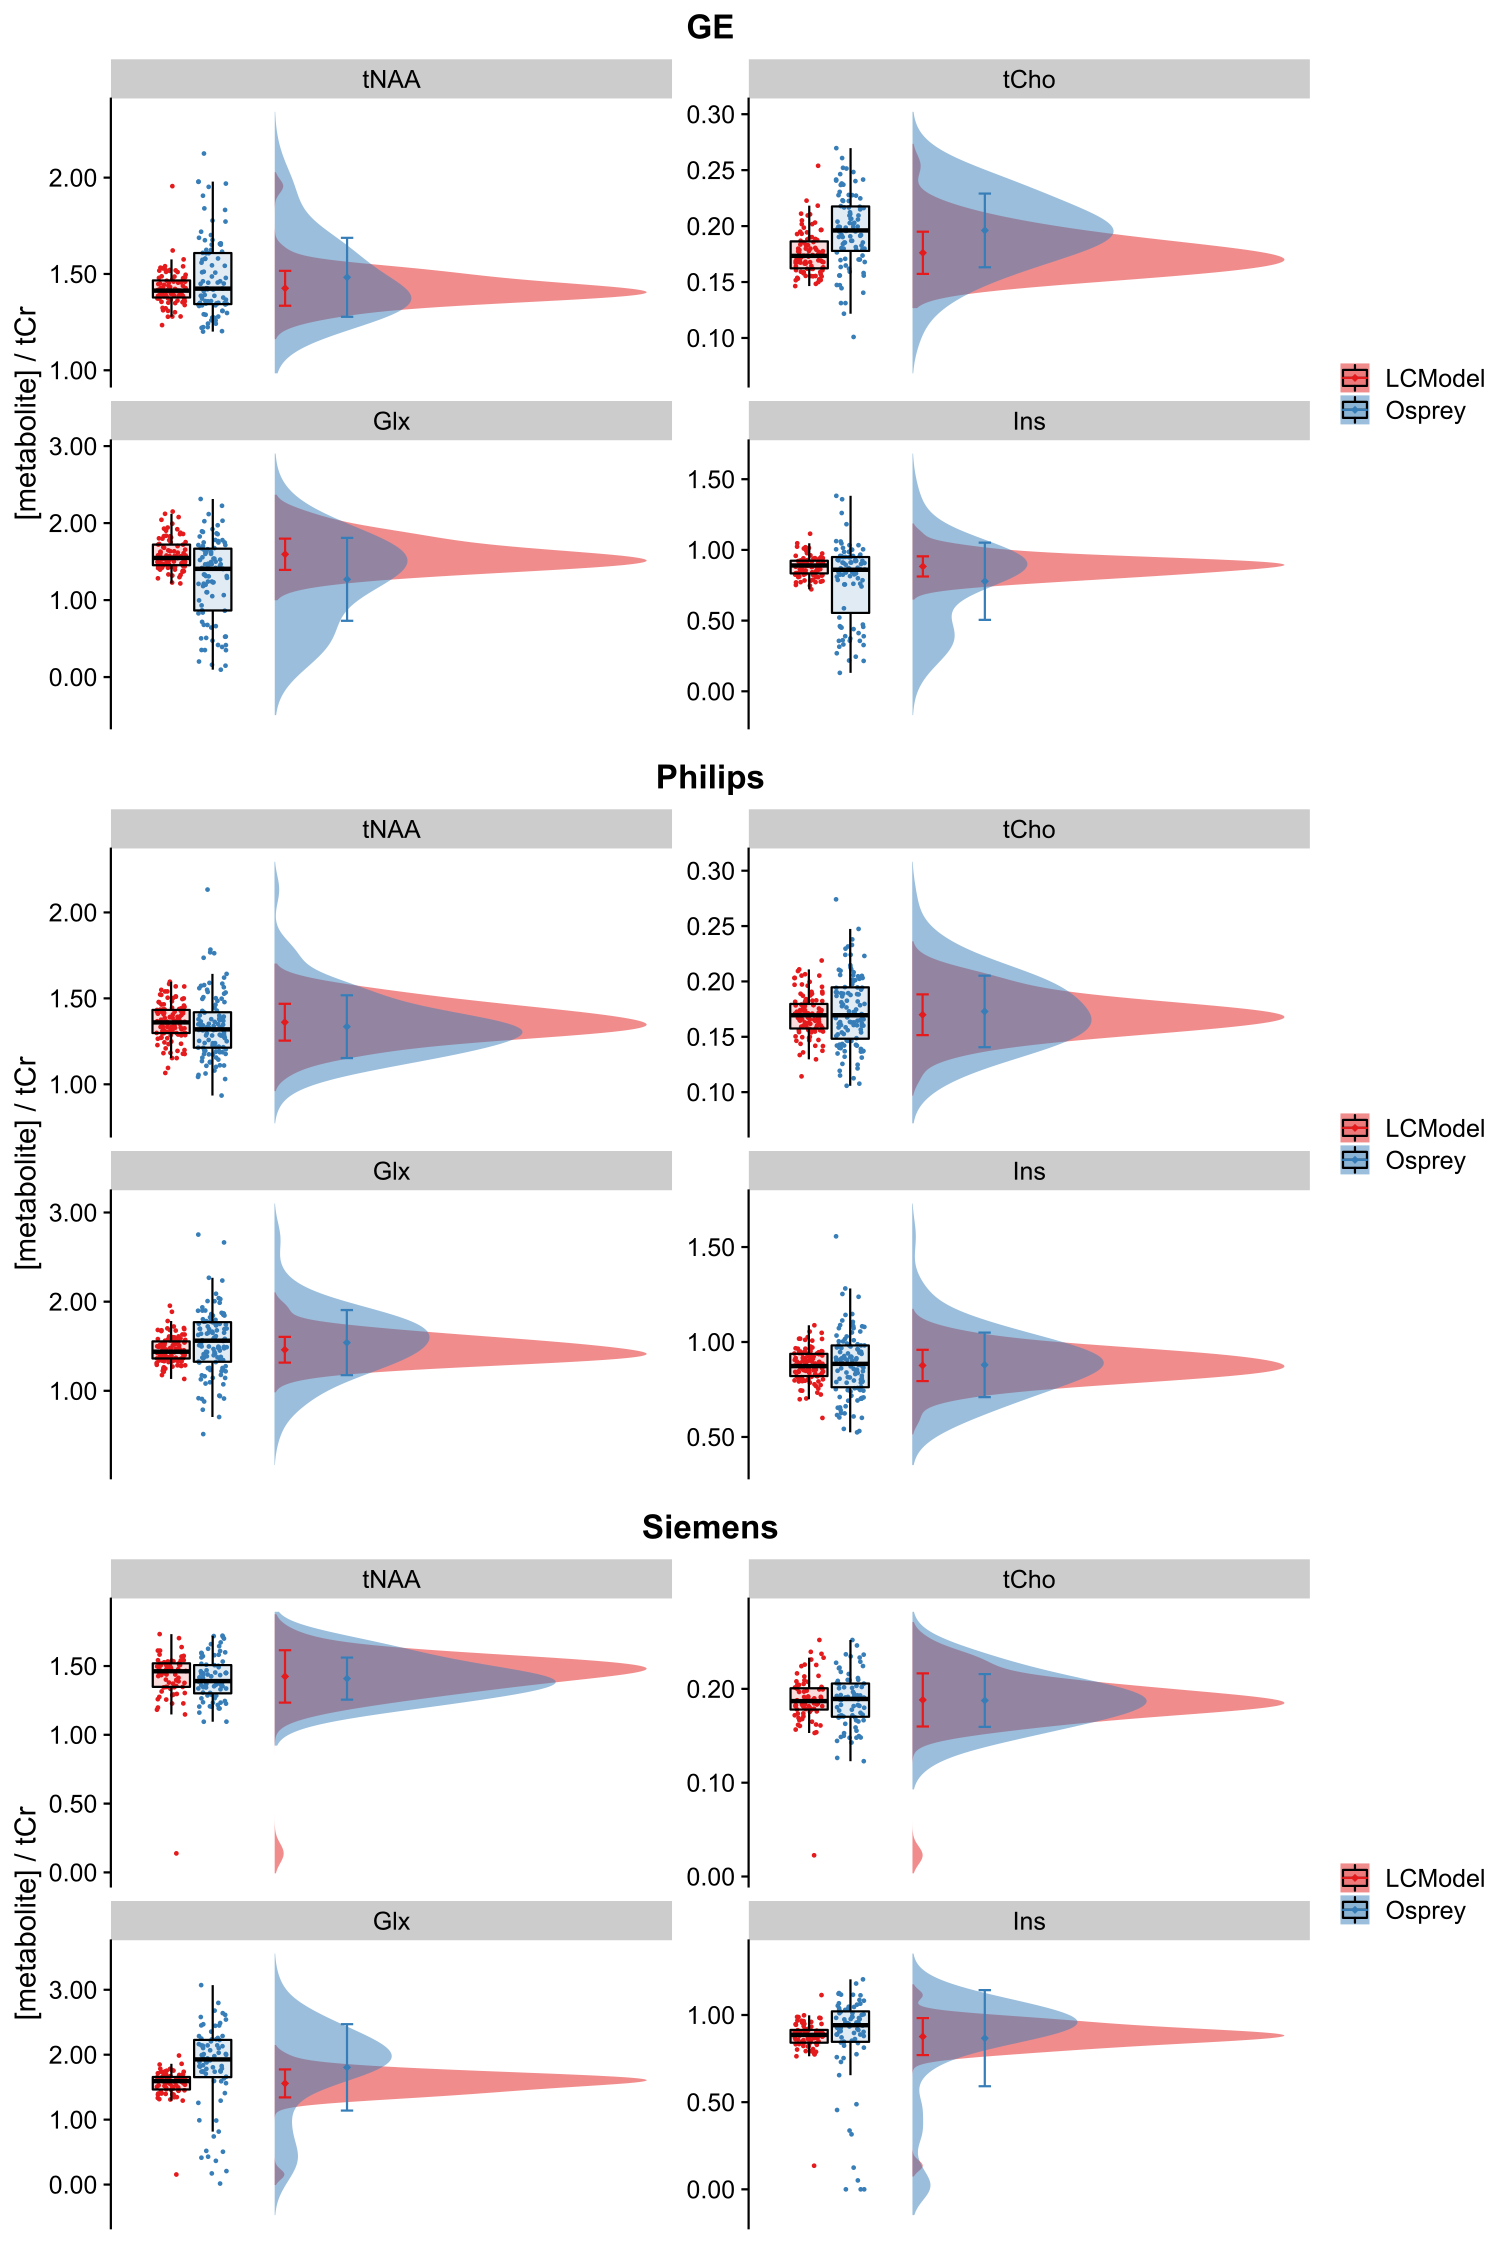
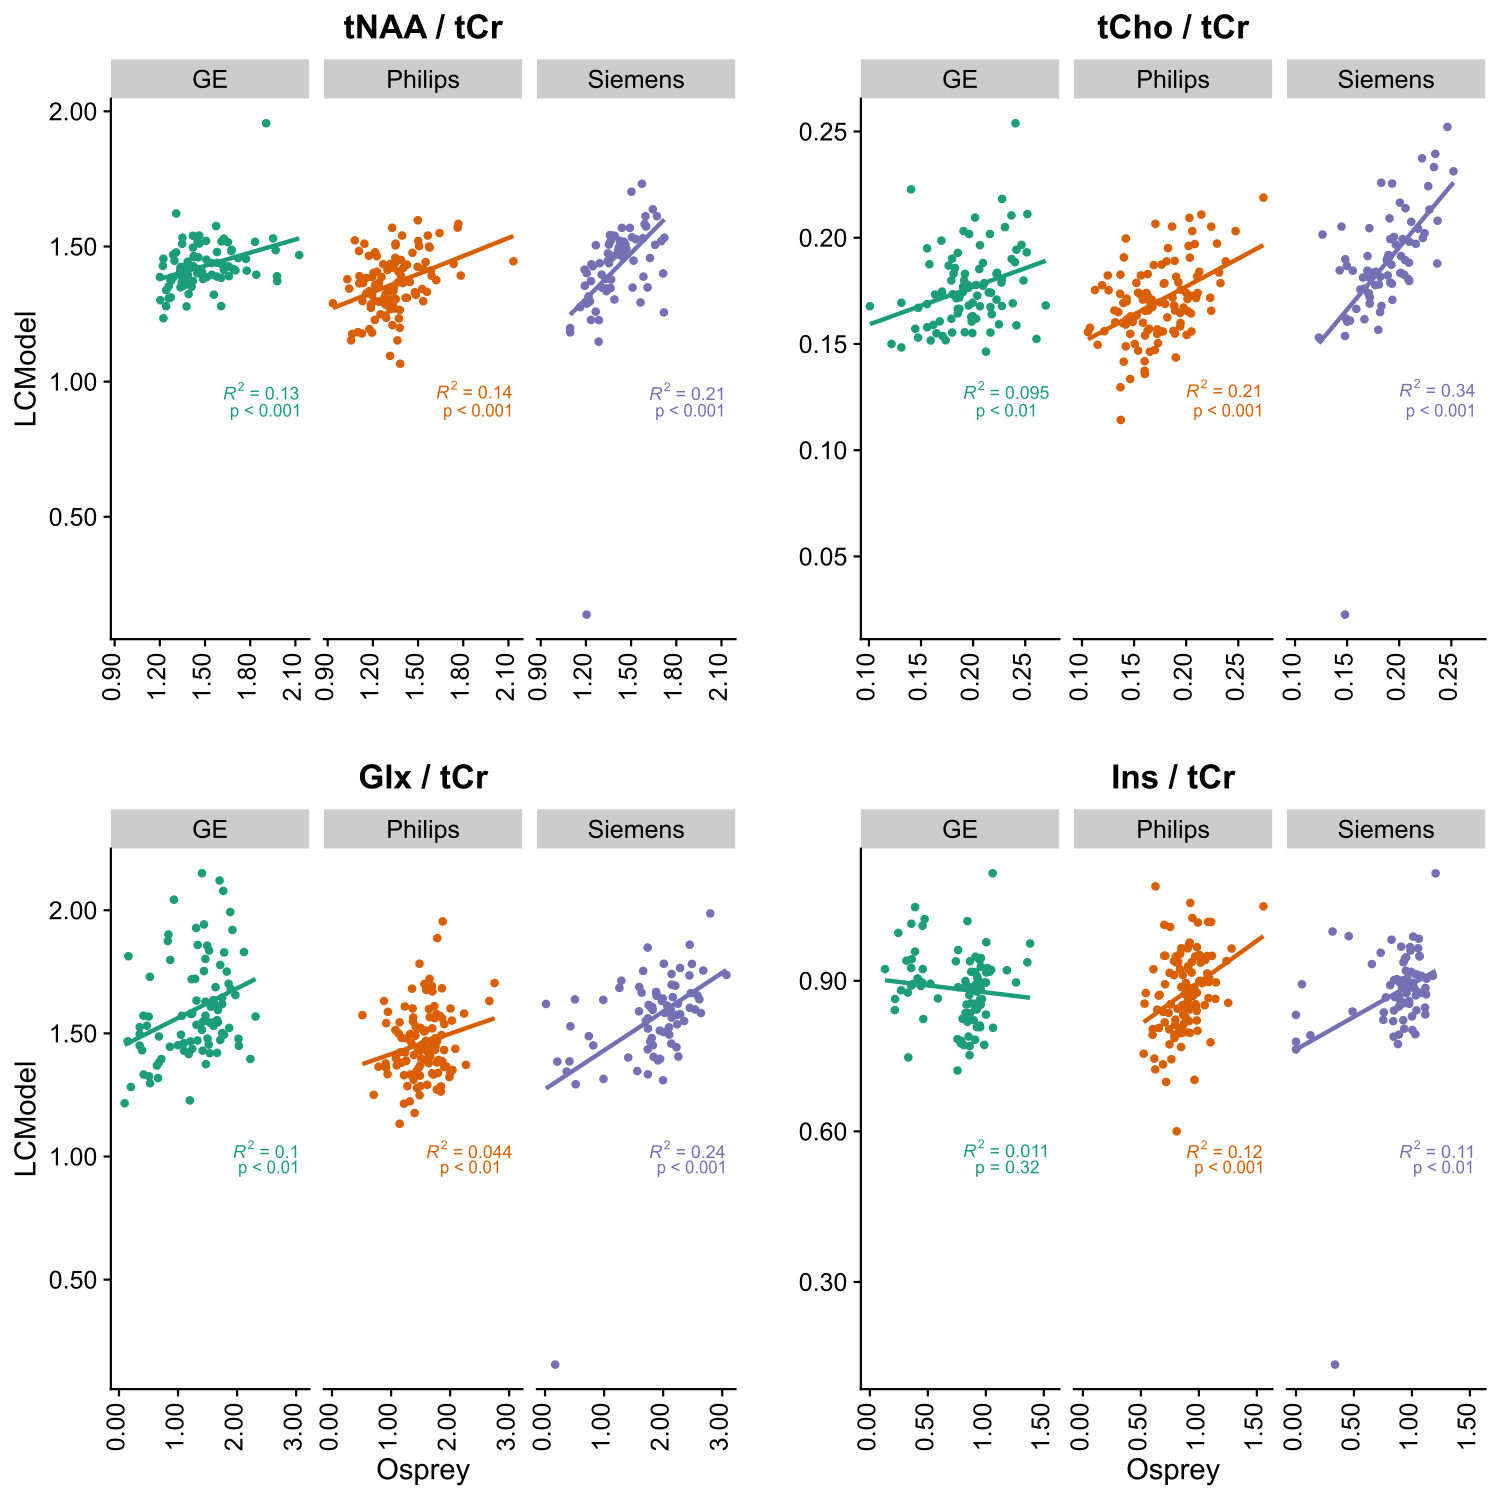
Figure 1 depicts mean spectra and residues per vendor, as well as the mean fits of LCModel (A) and the Osprey toolbox (B). Mean metabolite ratios agree well between Osprey and LCModel for Philips and Siemens (except Glx), with greatest discrepancies for GE, while standard deviations are higher for Osprey than for LCModel, and varies between vendors (Figure 2). With the exception of Ins/tCr for GE, correlations are significant (p < 0.05) for all metabolites and vendors, with weak to moderate coefficients of determination (R2). For all metabolites, R2-values are highest for Siemens and lowest for GE (except Philips Glx) (Figure 3).Discussion
This study demonstrates the utility of publicly available MRS data for testing of novel modeling algorithms, and benchmarking against established approaches.Initial results indicate a relatively good agreement between the algorithms, at least for the major landmark metabolites. The lower variability of LCModel results can likely be attributed to multiple preliminary analysis steps that it performs to provide more robust starting values for the optimization and baseline regularization.
While LCM is a conceptually simple approach to MRS quantification, black-box tools often prevent the community from fully appreciating the delicate balance required to regularize between metabolite and baseline components of the model, and the strong impact of modeling starting parameters and soft constraints. The increasing availability of large public datasets can benchmark the development of new tools, and increase critical insight, transparency, and breadth of access of LCM quantification. Osprey is a new open-source toolkit, currently under development. Large-dataset benchmarking will guide future Osprey modifications to interrogate the LCModel modeling process. It is hoped that the combination of open-access data and algorithms will enable more groups to study the various factors that influence quantitative LCM outcomes.
Conclusion
Usage of publicly available datasets fosters the methodical developments in a fast-evolving research area and should be used as a standard approach to benchmark new methods. Here it is used to further develop a new open-access linear-combination modeling algorithm to quantify brain 1H-MRS data.Acknowledgements
This work is supported by NIH grants R01 EB016089 R01 EB023963 R21A G060245. GO receives support from NIH grant K99 AG062230. MP is supported by NIH grants 8P41 EB015909-11 and R01 CA200125.References
1. Provencher SW. Automatic quantitation of localized in vivo1H spectra with LCModel. NMR Biomed. 2001;14(4):260-264. doi:10.1002/nbm.698
2. Wilson M, Reynolds G, Kauppinen RA, Arvanitis TN, Peet AC. A constrained least-squares approach to the automated quantitation of in vivo 1 H magnetic resonance spectroscopy data. Magn Reson Med. 2011;65(1):1-12. doi:10.1002/mrm.22579
3. Ratiney H, Sdika M, Coenradie Y, Cavassila S, van Ormondt D, Graveron-Demilly D. Time-domain semi-parametric estimation based on a metabolite basis set. NMR Biomed. 2005;18(1):1-13. doi:10.1002/nbm.895
4. Poullet J-B, Sima DM, Simonetti AW, et al. An automated quantitation of short echo time MRS spectra in an open source software environment: AQSES. NMR Biomed. 2007;20(5):493-504. doi:10.1002/nbm.1112
5. Mikkelsen M, Barker PB, Bhattacharyya PK, et al. Big GABA: Edited MR spectroscopy at 24 research sites. Neuroimage. 2017;159:32-45. doi:10.1016/j.neuroimage.2017.07.021
6. Simpson R, Devenyi GA, Jezzard P, Hennessy TJ, Near J. Advanced processing and simulation of MRS data using the FID appliance (FID-A)—An open source, MATLAB-based toolkit. Magn Reson Med. 2017;77(1):23-33. doi:10.1002/mrm.26091
7. Brown MA. Time-domain combination of MR spectroscopy data acquired using phased-array coils. Magn Reson Med. 2004;52(5):1207-1213. doi:10.1002/mrm.20244
8. Klose U. In vivo proton spectroscopy in presence of eddy currents. Magn Reson Med. 1990;14(1):26-30. doi:10.1002/mrm.1910140104
9. Near J, Edden RAE, Evans CJ, Paquin R, Harris AD, Jezzard P. Frequency and phase drift correction of magnetic resonance spectroscopy data by spectral registration in the time domain. Magn Reson Med. 2015;73(1):44-50. doi:10.1002/mrm.25094
10. Barkhuijsen H, de Beer R, van Ormondt D. Improved algorithm for noniterative time-domain model fitting to exponentially damped magnetic resonance signals. J Magn Reson. 1987;73(3):553-557. doi:10.1016/0022-2364(87)90023-0
Figures