2884
Simultaneous Measurement of Glutamate, Glutamine, and Glutathione by Single-Step Spectral Editing1National Institute of Mental Health, National Institutes of Health, Bethesda, MD, United States
Synopsis
A single-step spectral editing MRS sequence is described for simultaneously measuring glutamate, glutamine, and glutathione at 7 T. Same as a previously described three-step editing technique, the editing pulse induces the collapse of targeted multiplets into high intensity pseudo singlets at a medium echo time. No data subtraction is necessary. In the current example, the editing pulse acts on the H3 protons of glutamate, glutamine, and glutathione near 2.12 ppm to generate sharp and high intensity pseudo singlets of glutamate, glutamine, and glutathione H4 protons. Signal enhancement of the three metabolites is analyzed in detail.
INTRODUCTION
Glutamate (Glu) is the main excitatory neurotransmitter in the central nervous system. The predominantly astroglial glutamine (Gln) is connected to neuronal glutamate via the glutamate-glutamine cycle. Glutathione (GSH) is an antioxidant present in most cell types including astrocytes. Concentration changes in Glu, Gln, and GSH have been reported in several neurological and psychiatric disorders such as epilepsy, schizophrenia, Alzheimer’s disease, and major depressive disorder. Choi et al.1 previously described that the H4 peaks of Glu, Gln, and GSH are sharp and of high intensity when TE is 100 - 110 ms. At TE =106 ms, it was shown that Glu, Gln, and GSH signals can be maximized while suppressing the N-acetylaspartate (NAA) signals at 2.5 ppm using an editing pulse applied at 4.38 ppm2. More recently, a spectral editing technique named multi-edit3 was described for simultaneously measuring Glu, Gln, γ-aminobutyric acid (GABA), and GSH at 7 T using a three-step editing approach at TE = 56 ms. The editing RF pulse was set to OFF, ON at 1.89 ppm, and ON at 2.12 ppm. The first two editing steps mainly provided information for measuring GABA and the NAA singlet signals. Most of the Glu, Gln, and GSH signals came from the third editing step where the editing pulse was applied at 2.12 ppm. In this work, we propose to use single-step spectral editing, i.e., the third editing step of multi-edit, to simultaneously measure Glu, Gln, and GSH at 7 T. The purpose of the editing pulse is to induce signal change of the targeted metabolites from multiplets into high intensity pseudo singlets. Here, the editing pulse acts on the H3 protons of Glu, Gln, and GSH near 2.12 ppm to alter the J-evolution of the corresponding H4 protons such that they form sharp and high intensity peaks.METHODS
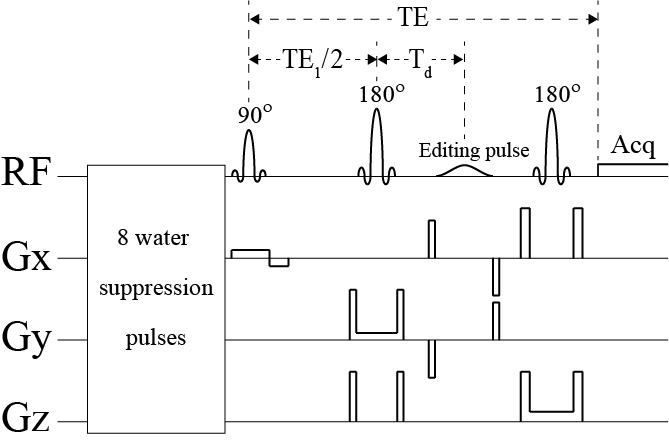
The pulse sequence is given in Figure 1. Spectra of Glu, Gln, and GSH were numerically computed using density matrix simulations to compare with the previously described single-step editing technique using TE = 106 ms2. In vivo studies were also performed on 8 healthy volunteers using a Siemens Magnetom 7 T scanner. The reconstructed spectra were fitted in the range of 1.8 – 3.7 ppm by a linear combination of numerically computed basis functions of acetate, NAA, N-acetylaspartylglutamate (NAAG), GABA, Glu, Gln, GSH, aspartate, total creatine (tCr), total choline (tCho), myo-inositol (mIns), taurine, scyllo-inositol, and glycine, as well as a cubic spline baseline.RESULTS
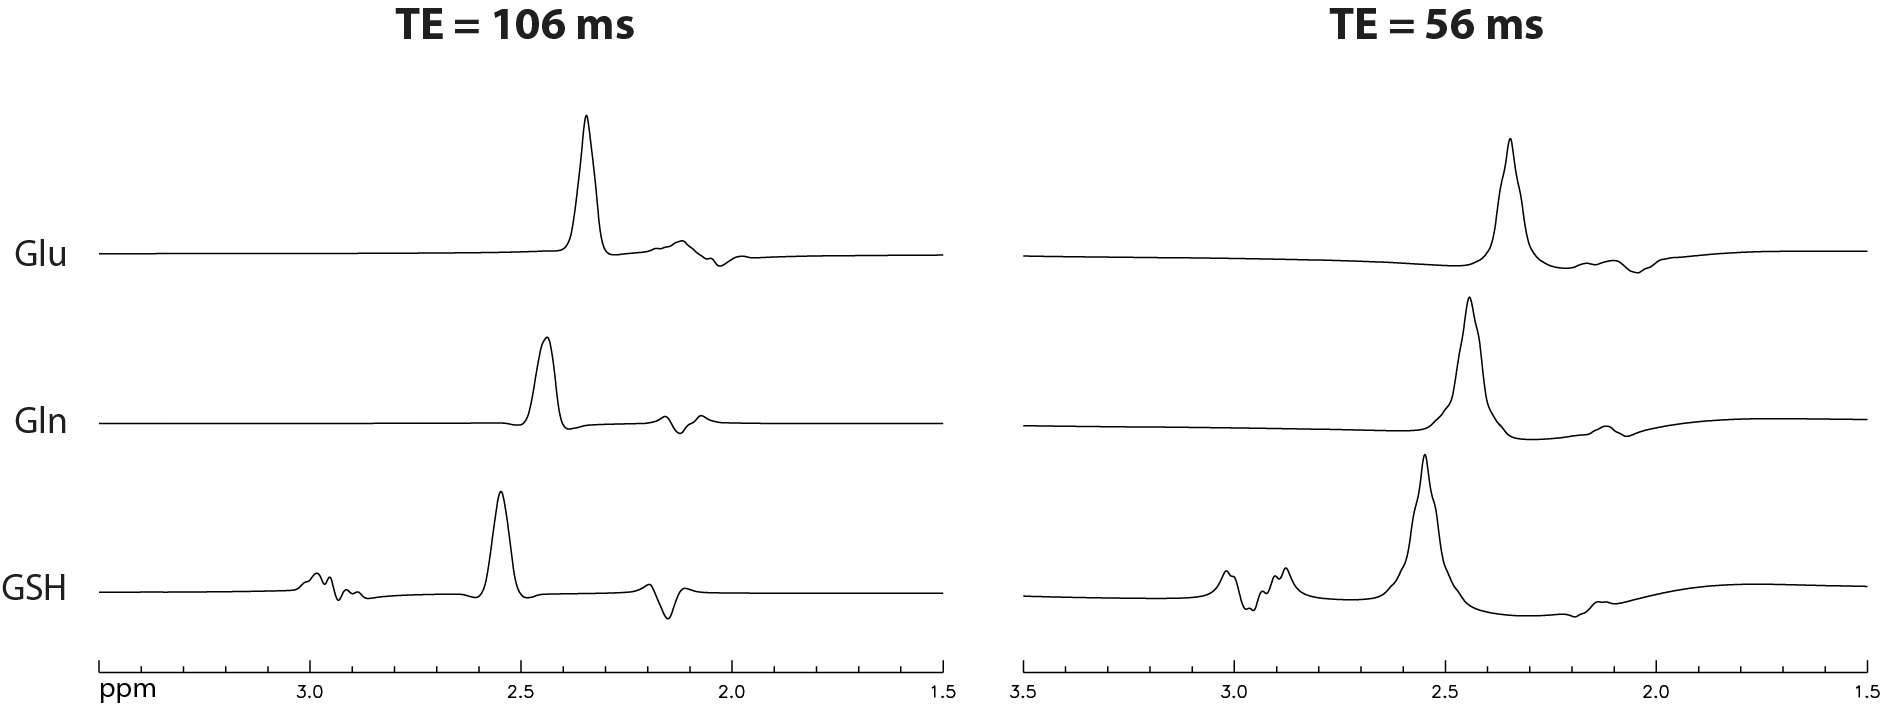
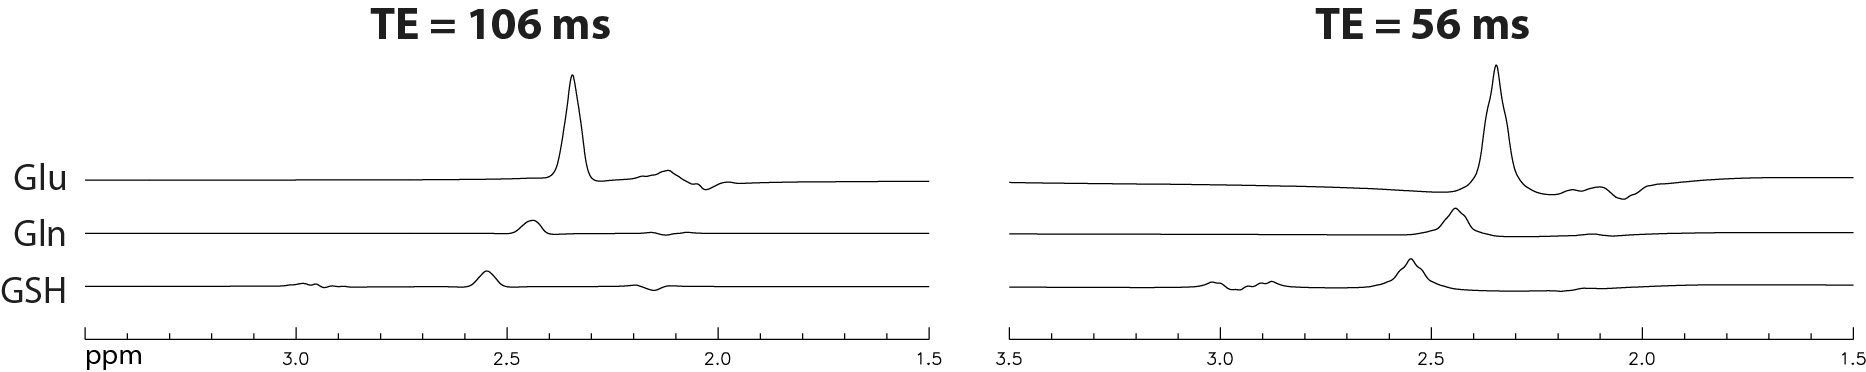
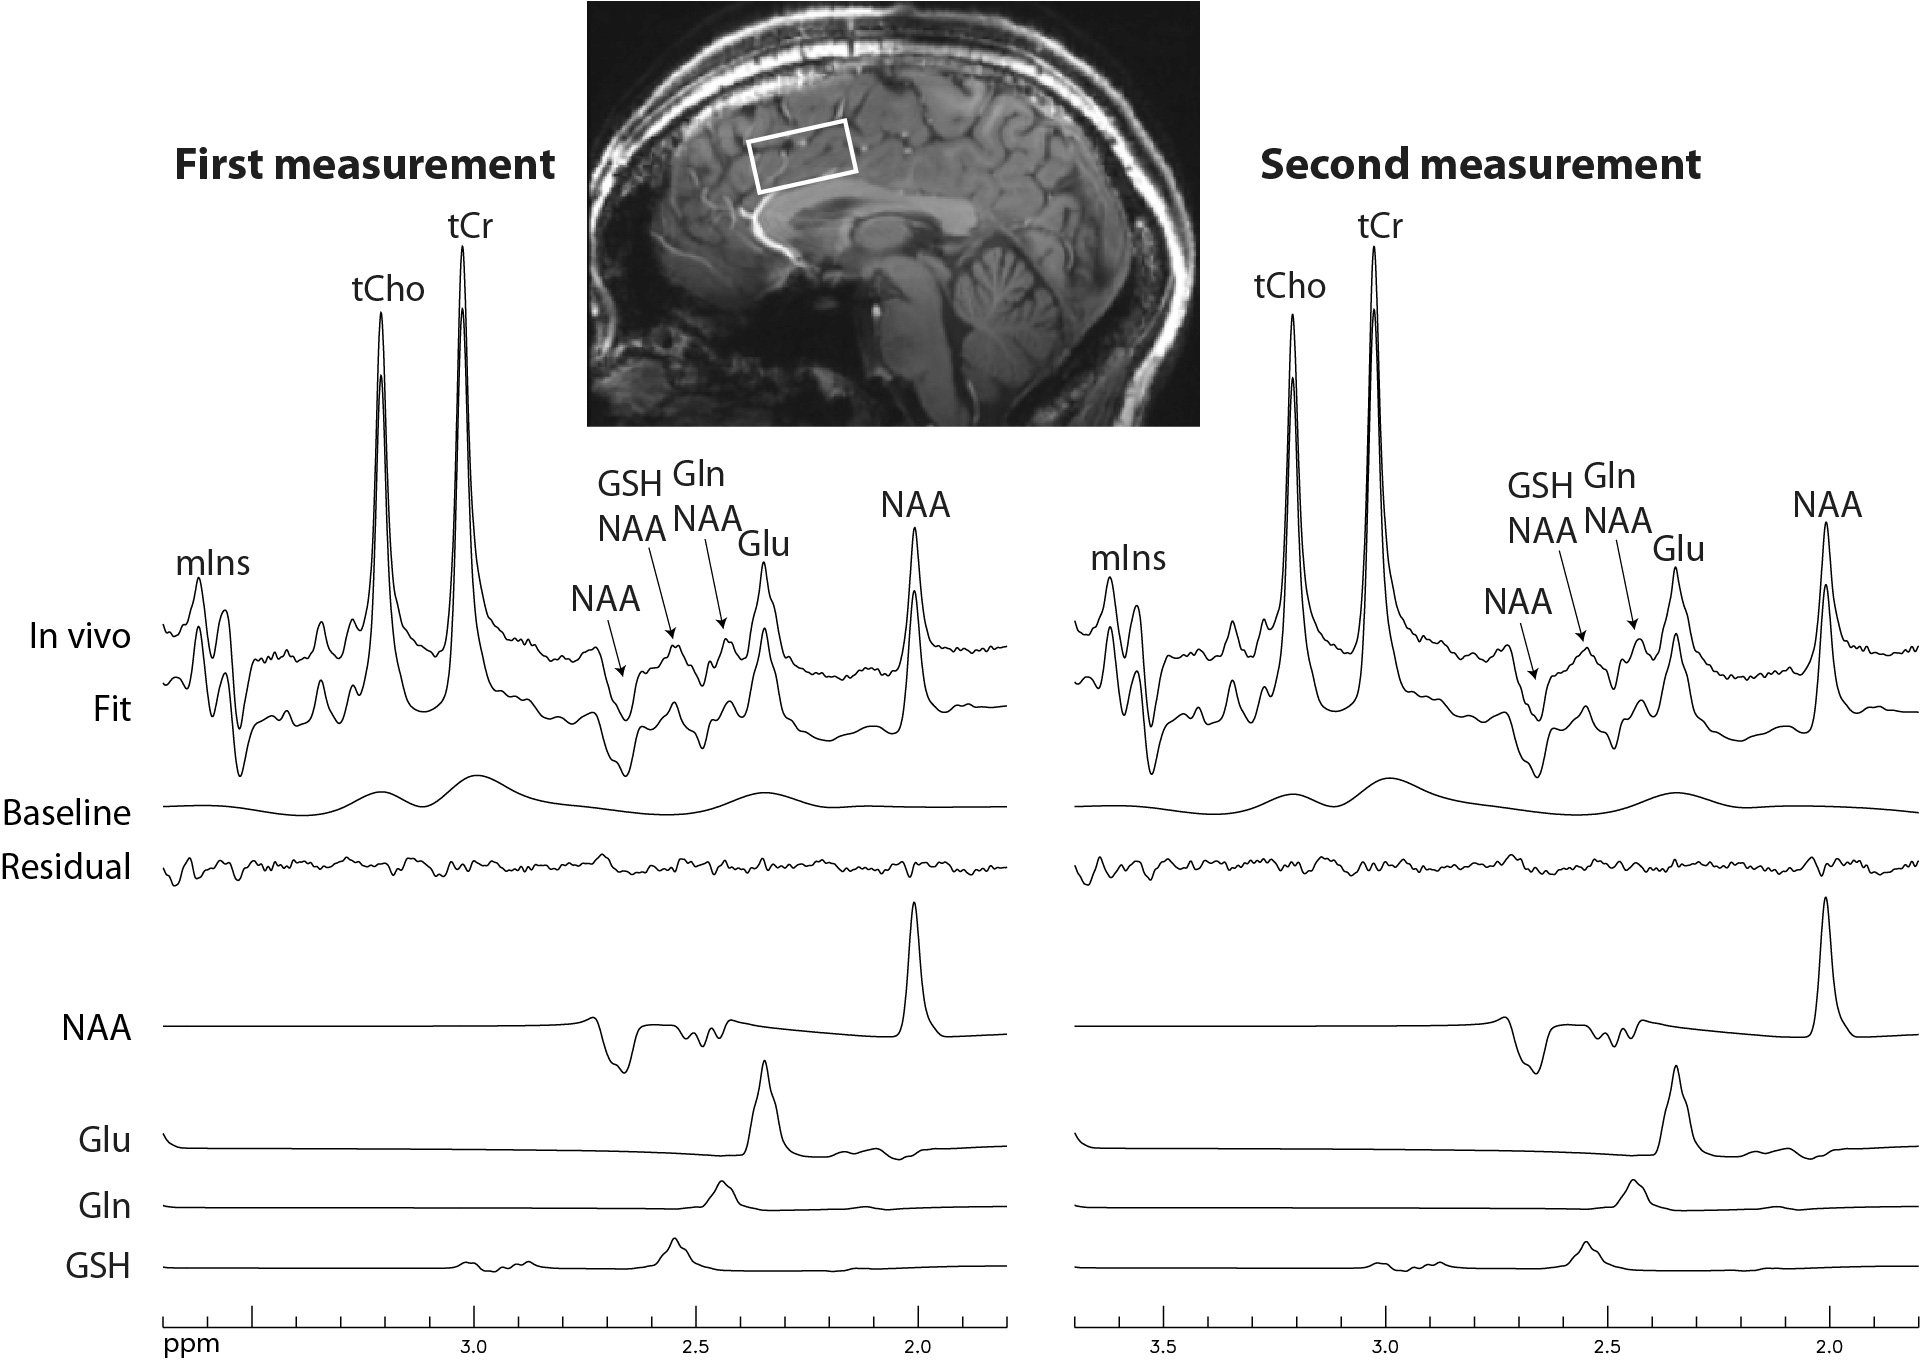
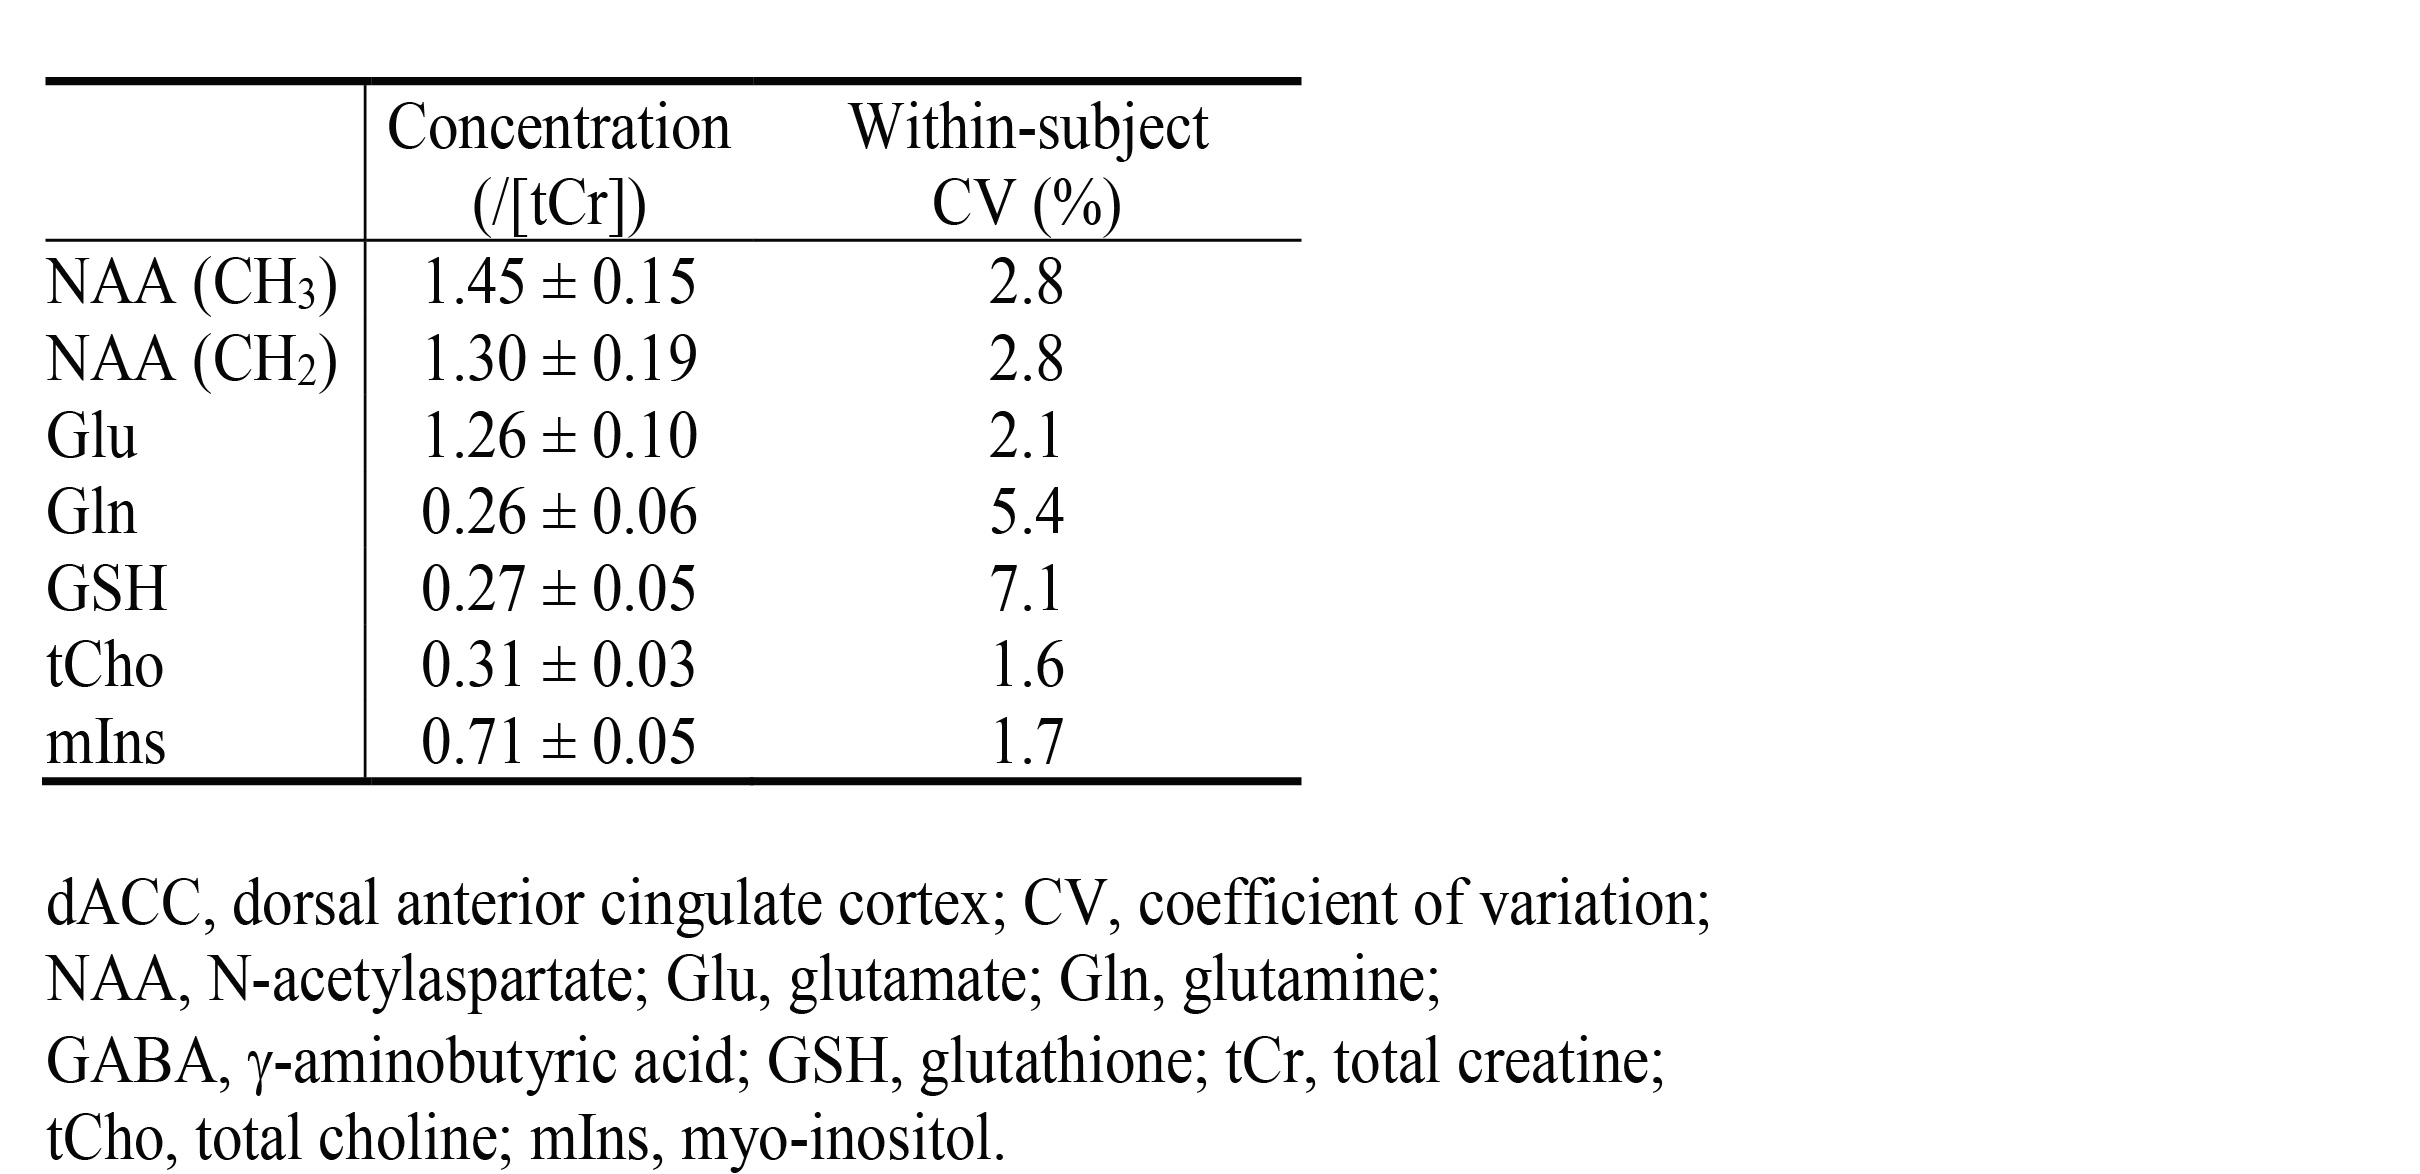
Figure 2 shows that the single-step editing technique with TE = 56 ms yields a slightly lower Glu peak but much higher Gln and GSH peaks compared to the previous technique with TE = 106 ms2 when the T2 relaxation effects of the metabolites are ignored. As shown in Figure 3, when the T2 relaxation effects of the metabolites are considered, the peak amplitudes of Glu, Gln, and GSH by editing at TE = 56 ms become significantly higher than at TE = 106 ms. The peak amplitude ratios between TE = 56 ms and 106 ms were 1.09 for Glu, 1.92 for Gln, and 1.79 for GSH. Because the reported in vivo T2 values of Gln and GSH were not reliable due to their low concentrations, their T2 values were set to be the same as that of Glu, which was reported to be 184 ms4. This T2 is likely longer than the real T2 values of Gln and GSH because Gln is an electrically neutral molecule and the T1 of GSH is unusually short4, 5. Therefore, the true in vivo signal enhancement due to the use of a shorter TE of 56 ms is likely larger than the ratios given by these numerical calculations.The reconstructed spectra of two MRS scans from one subject are displayed in Figure 4. We can see that the fitted Gln and GSH peaks are both sharp and of high intensity, which is highly desirable for quantification. The two spectra are highly consistent, demonstrating excellent reproducibility. Metabolite concentrations (/[tCr]) measured from 8 healthy volunteers are given in Table 1, which have small CV values and agree well with previous studies1-3.
DISCUSSION AND CONCLUSION
An editing pulse acting on the H3 protons of Glu, Gln, and GSH near 2.12 ppm was used to make the H4 protons of these metabolites form sharp and high intensity pseudo singlets at a medium TE of 56 ms in a single-step editing experiment. Numerical simulations showed that this single-step spectral editing sequence with TE = 56 ms increased the peak amplitude by 92% for Gln and 79% for GSH compared to a previously described technique using TE = 106 ms. In vivo scans from healthy volunteers yielded high quality spectra with high reproducibility. Because the H4 protons of Glu and Gln can be used to indirectly measure 13C labeling of glutamate and glutamine at the spatial resolution and sensitivity of proton MRS, the nearly complete separation between Glu and Gln H4 pseudo singlets and the large enhancement of the much weaker Gln H4 signals at TE = 56 ms described here are expected to facilitate proton detection of glutamate and glutamine metabolism and neurotransmission after introducing exogenous 13C-labels.Acknowledgements
No acknowledgement found.References
1. Choi CH, Dimitrov IE, Douglas D, Patel A, Kaiser LG, Amezcua CA, Maher EA (2010) Improvement of resolution for brain coupled metabolites by optimized H-1 MRS at 7 T. Nmr in Biomedicine 23 (9):1044-1052.
2. An L, Li S, Murdoch JB, Araneta MF, Johnson C, Shen J. Detection of glutamate, glutamine, and glutathione by radiofrequency suppression and echo time optimization at 7 tesla. Magnetic Resonance in Medicine 2015;73:451-458.
3. An L, Araneta MF, Johnson C, Shen J, Simultaneous measurement of glutamate, glutamine, GABA, and glutathione by spectral editing without subtraction, Magn Reson Med, 80 (2018) 1776-1786.
4. An L, Li S, Shen J, Simultaneous determination of metabolite concentrations, T1 and T2 relaxation times, Magn Reson Med, 78 (2017) 2072-2081.
5. Choi IY, Lee P. Doubly selective multiple quantum chemical shift imaging and T-1 relaxation time measurement of glutathione (GSH) in the human brain in vivo. NMR Biomed 2013;26:28–34.
Figures