2883
Performance of Compressed Sensing for detecting low SNR 19F MRI in the Murine Brain using Prospective Undersampling1Berlin Ultrahigh Field Facility (B.U.F.F.), Max-Delbrück-Center for Molecular Medicine in the Helmholtz Association, Berlin, Berlin, Germany, 2Charité Campus Buch, Experimental and Clinical Research Center (ECRC), Berlin, Germany
Synopsis
Fluorine-19 (19F) MRI is an established tool for tracking inflammatory cells in vivo due to its excellent detection specificity. Nonetheless, low signal-to-noise ratios remain a major challenge, especially when studying inflammatory cell distribution in the brain. It was shown that compressed sensing (CS) increases 19F MRI sensitivity, yet prospective undersampling using dedicated CS sequences has only been reported in proof of concept experiments. Since false positives were observed in CS reconstructions, this work provides a thorough assessment of detection performance of in vivo CS as a tool for enhancing 19F MRI sensitivity.
Introduction
Fluorine-19 (19F) MRI is an established tool for tracking inflammatory cells in vivo due to its excellent detection specificity. Nonetheless, low achievable signal-to-noise ratios remain a major challenge1, especially when studying inflammatory cell distribution in the brain. It was shown that compressed sensing (CS) increases 19F MRI sensitivity2-4. Most of the previous in vivo studies using prospective undersampling with dedicated CS sequences reported on proof of concept experiments, where SNR was the only quantitative metric and no multiple undersampling factors were compared2,3. SNR does not convey information about edge preservation and reconstruction reliability. Since false positives were observed in CS reconstructions3, this work provides a thorough assessment of detection performance of in vivo CS as a tool for enhancing 19F MRI sensitivity.Methods
All animal experiments were carried out in accordance with local animal welfare guidelines (LaGeSo). EAE was induced in 4 SJL/J mice and perfluoro-15-crown-5-ether rich nanoparticles were administered daily starting on day 5 following EAE induction5 and in vivo data acquired on day 12 to 14.Undersampling patterns were computed using the 1D distribution p(kp)∝(1-|kp|)3/2, where kp∈[-1,1] denotes the position of the k-space line in phase encoding direction. 10% of the sampled lines were assigned deterministically to the k-space center. MR experiments were performed on a 9.4T animal scanner (Bruker BioSpin, Ettlingen, Germany). A purpose-built 2D-RARE CS protocol was employed for 19F MRI: TR=1020ms, TE=5.2ms, ETL=40, FOV=(20×20)mm2, (128×128) matrix, 3.2mm slice thickness, 6 slices. 296, 592 and 1184 averages were acquired with no, 2-fold and 4-fold undersampling (TA=20min). Fully sampled measurements were repeated 4 times as reference (80min). A pure noise scan was acquired to determine the noise level6.
CS reconstructions of undersampled data were computed using the accelerated alternating direction method of multipliers7 with equally weighted isotropic total variation8 and image -norm regularization. The discrepancy principle was used to determine the optimal regularization strength9.
Rician noise bias correction was applied to all Fourier reconstructions of fully-sampled data10. The reference scan was thresholded at SNR=3.5 and groups of less than 3 connected pixels were removed as outliers. To calculate signal level specific TPRs and FDRs using a sliding window approach, CS reconstructions were thresholded at 2 times the noise standard deviation and Fourier reconstructions at SNR=3.5. We computed the root-mean-square deviation (RMSD) of reconstructions from the reference and compared different balances of false discovery rate (FDR) and true positive rate (TPR) by varying detection thresholds.
Undersampling patterns, reconstructions and analyses were programmed in MATLAB 2018a (The MathWorks, USA).
Results
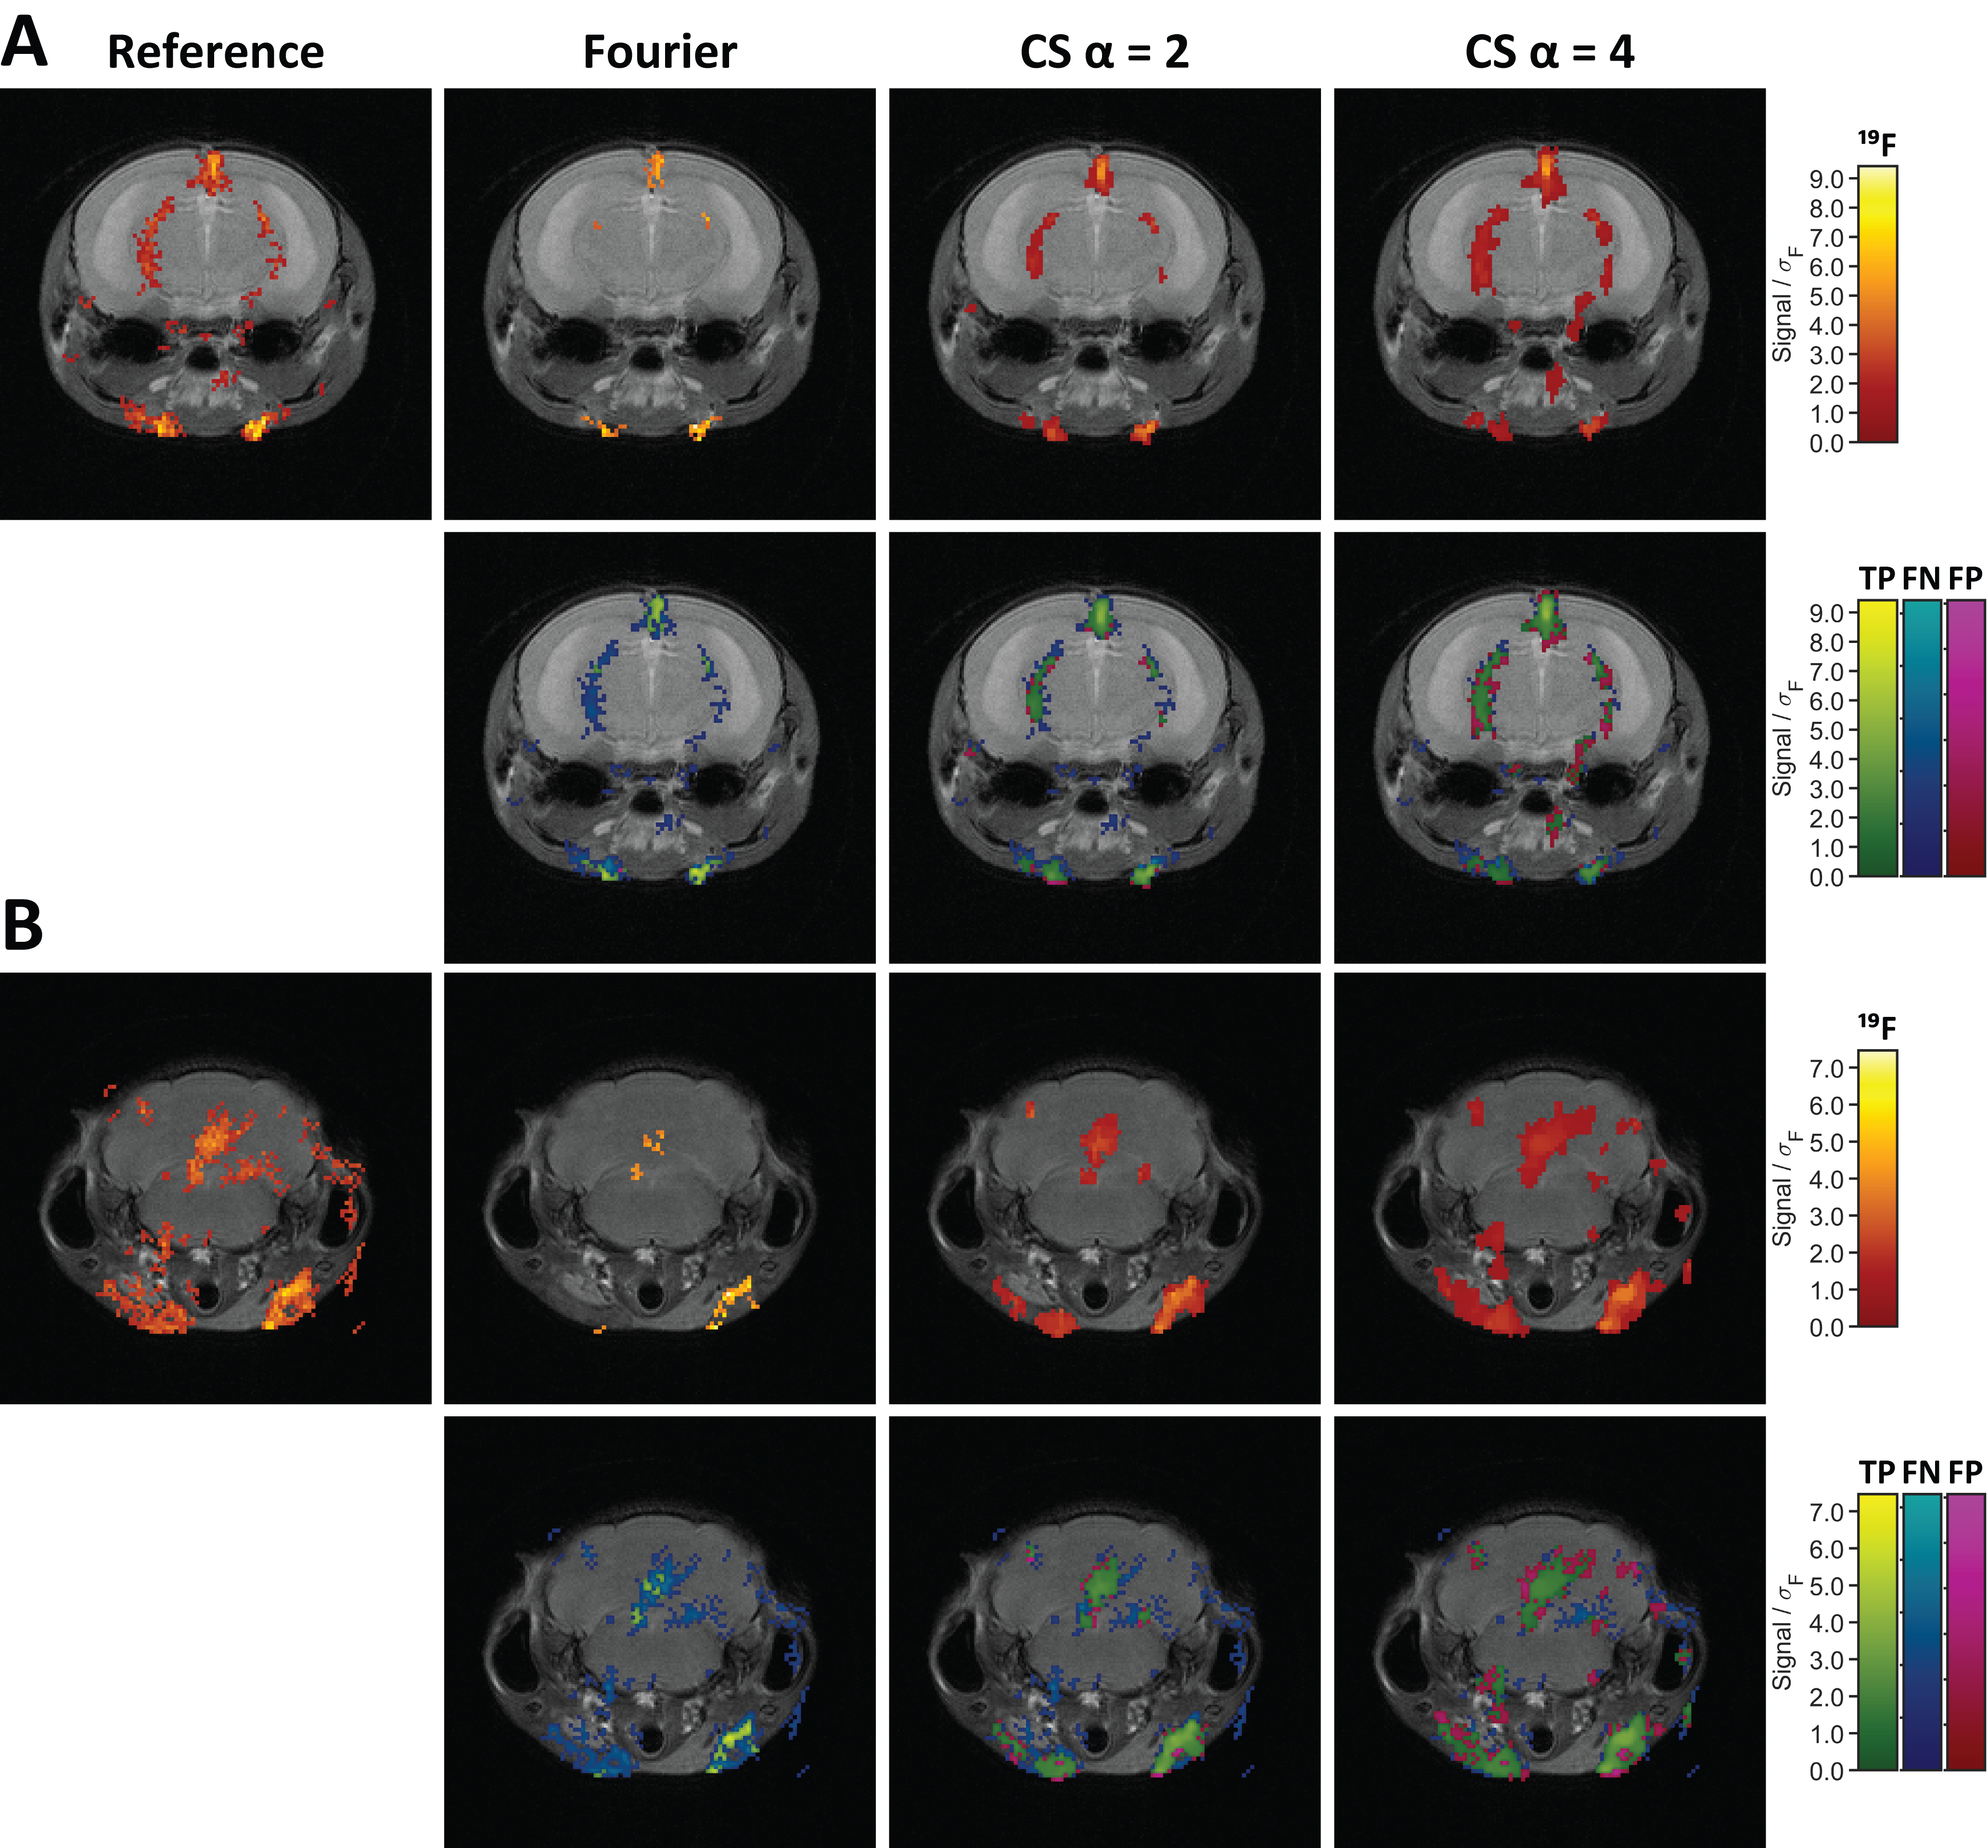
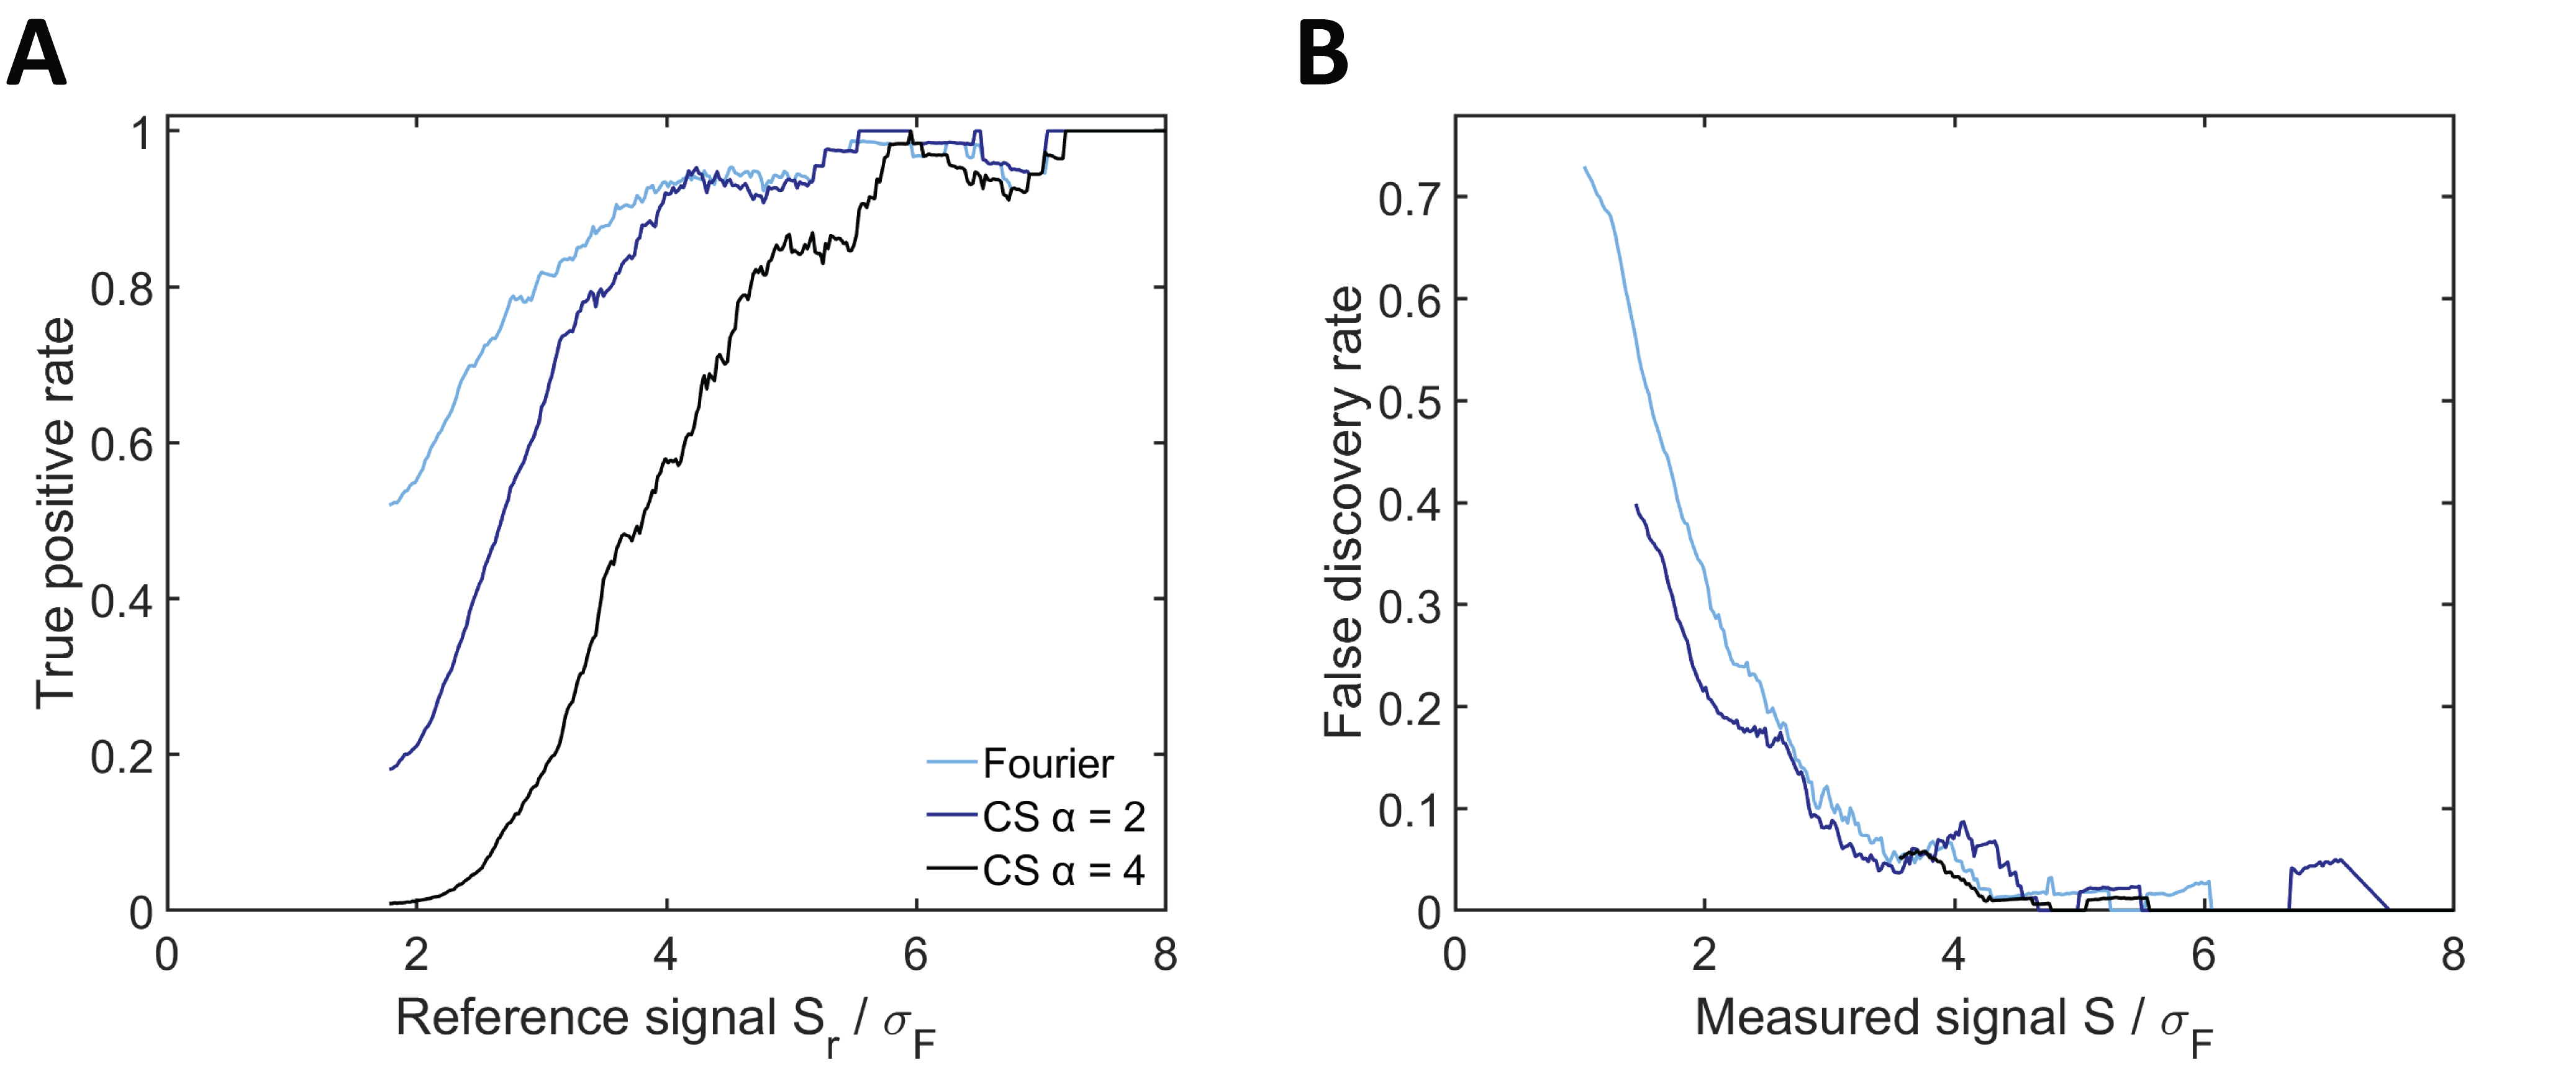
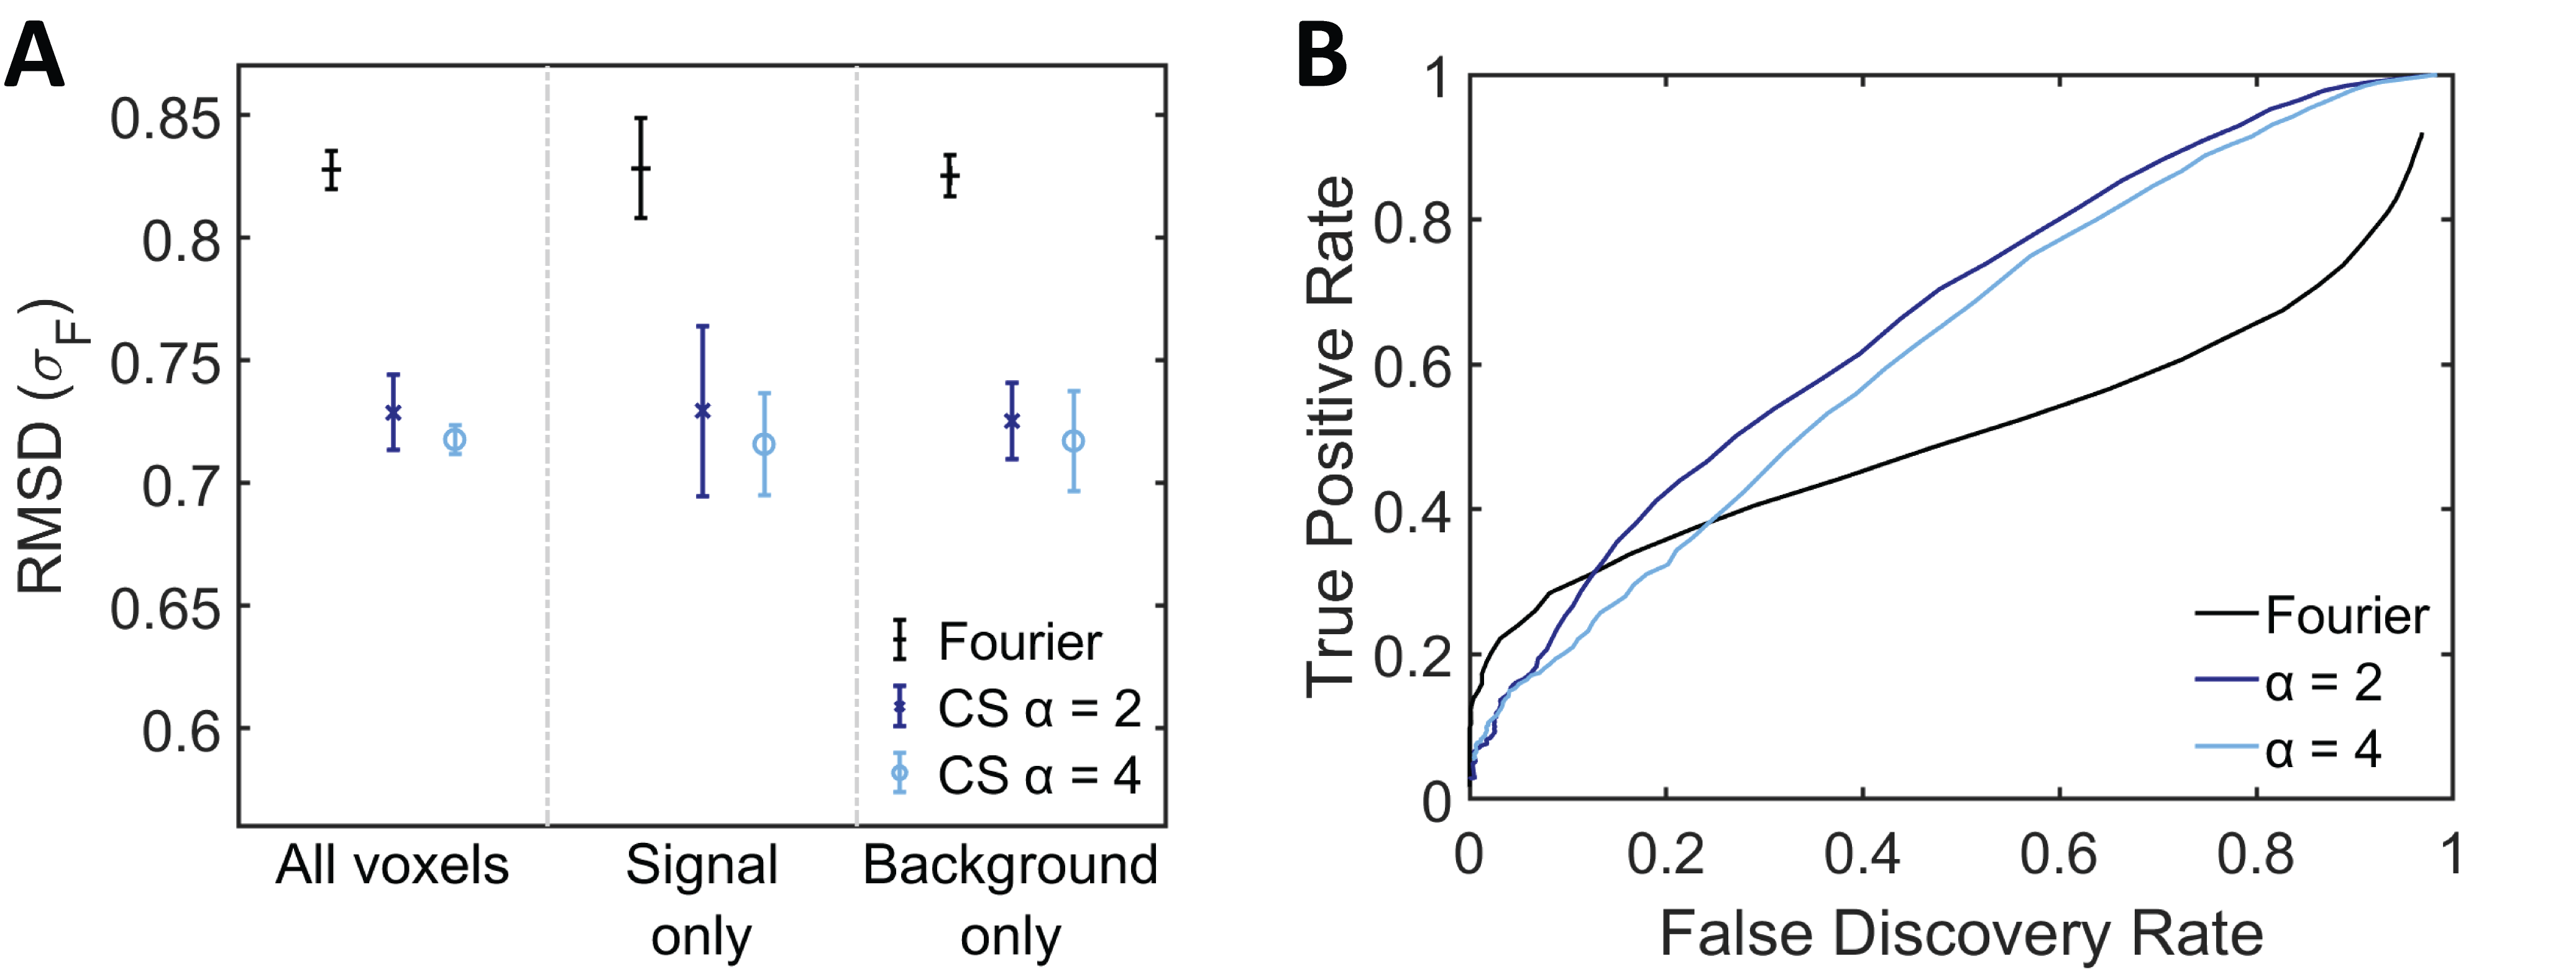
Compared to conventional Fourier reconstructions, the number of detected 19F signal voxels was greatly enhanced by CS with 2-fold undersampling (Fig.1A and B). Slight blurring was only present at the edges of enhanced true positive features. The number of true positives was further increased with 4-fold undersampling, but so was the blurring effect. These findings were supported by our quantitative analysis. Applying the same thresholds as in Fig.1, CS showed superior detection at all signal levels (Fig.2A). FDRs in CS reconstructions on the other hand were elevated at low signal levels, especially for 4-fold undersampling (Fig.2B). The RMSD from the reference was consistently reduced by CS (Fig.3A) and the effect size was independent of the undersampling factor. Similar reduction of the RMSD was measured when considering the full images, signal voxels only or background voxels only. CS offered superior results especially at FDRs >15%, with 2-fold undersampling consistently performing better than 4-fold undersampling (Fig.3B). In situations where FDRs <12.7%, conventional Fourier reconstructions yielded higher TPRs. The intersection of TPRs and FDRs for Fourier reconstructions and CS with 2-fold undersampling corresponds to an SNR of 2.8 in the Fourier reconstruction (Fig.3B).Discussion
For most 19F MRI research applications, the distribution and concentration range of 19F voxels is not known a priori. Typically 19F is available at a µM or even nM range. Therefore, it would be beneficial to lower detection thresholds. In this study we show that CS outperformed conventional reconstructions, particularly at low SNR regimes. False positives in CS reconstructions only occurred at the edges of true features as slight blurring; false positives in Fourier reconstructions on the other hand occur as entirely new false positive 19F features. Therefore, the SNR below which CS reconstructions are optimal will be higher than the measured value of 2.8 but depends on the application and the analysis priorities. It is expected that CS will perform even better when using a 3D RARE sequence due to the improved incoherence achievable by undersampling in two phase encoding dimensions.Conclusion
These results confirm and expand published findings based on retrospective undersampling and show that CS can be reliably applied to in vivo applications that require 19F signal quantification. While conventional Fourier reconstructions are preferable when all 19F signals are well above the detection thresholds, CS with 2-fold undersampling offered reliable and easily interpretable results with considerably improved detection performance. The demonstrated improvement in signal sensitivity and detection performance of CS holds promise for other 19F MRI applications, particularly those involving the detection of small quantities of 19F, such as in studies investigating the distribution of CNS-acting drugs in the brain.Acknowledgements
This study was funded in part by the Deutsche Forschungsgemeinschaft to SW and AP (DFG WA2804, DFG PO1869). The funders had no role in study design, data collection and analysis, decision to publish, or preparation of the manuscript. Thoralf Niendorf was supported by an advanced grant from the European Research Council (EU project 743077 – ThermalMR).References
1. Flogel U, Ahrens E. Fluorine magnetic resonance imaging. Pan Stanford; 2016.
2. Zhong J, Mills PH, Hitchens TK, Ahrens ET. Accelerated fluorine-19 MRI cell tracking using compressed sensing. Magn Reson Med. 2013;69(6):1683-1690.
3. Liang S, Dresselaers T, Louchami K, Zhu C, Liu Y, Himmelreich U. Comparison of different compressed sensing algorithms for low SNR (19) F MRI applications-Imaging of transplanted pancreatic islets and cells labeled with perfluorocarbons. NMR Biomed. 2017;30(11).
4. Starke L, Waiczies S, Niendorf T, Pohlmann A. Compressed Sensing Improves Detection of Fluorine-19 Nanoparticles in a Mouse Model of Neuroinflammation. Proceedings of the ISMRM 26th annual meeting & exhibition. 2018.
5. Waiczies S, Millward JM, Starke L, et al. Enhanced Fluorine-19 MRI Sensitivity using a Cryogenic Radiofrequency Probe: Technical Developments and Ex Vivo Demonstration in a Mouse Model of Neuroinflammation. Sci Rep. 2017;7(1):9808.
6. National Electrical Manufacturers Association. Determination of signal-to-noise ratio (SNR) in diagnostic magnetic resonance imaging. NEMA Standards Publication MS 1-2001. 2001.
7. Goldstein T, O'Donoghue B, Setzer S, Baraniuk R. Fast alternating direction optimization methods. SIAM J Imag Sci. 2014;7(3):1588-1623.
8. Rudin LI, Osher S, Fatemi E. Nonlinear total variation based noise removal algorithms. Physica D. 1992;60(1-4):259-268.
9. Vainikko GMJUcm, physics m. The discrepancy principle for a class of regularization methods. 1982;22(3):1-19.
10. Henkelman RM. Measurement of signal intensities in the presence of noise in MR images. Med Phys. 1985;12(2):232-233.
Figures