2882
Five-minute GABA: Halving the scan time of GABA-edited MRS measurements1Russell H. Morgan Department of Radiology and Radiological Science, The Johns Hopkins University School of Medicine, Baltimore, MD, United States, 2F. M. Kirby Research Center for Functional Brain Imaging, Kennedy Krieger Institute, Baltimore, MD, United States
Synopsis
Measurement of lower-concentration metabolites at ≤3T using edited MRS requires relatively long scan times (~10 min for a 27-mL voxel). We investigated whether scan times can be halved to ~5 min without a significant increase in group-level variance. GABA-edited MEGA-PRESS data from the Big GABA repository were analyzed by quantifying GABA+/Cr levels for complete datasets (320 averages; ~10 min) versus the first half of each (160 averages; ~5 min). There were no significant differences in group-level variance or GABA+/Cr levels. It appears that for a large, high-SNR voxel, GABA editing scan times of ~5 min are feasible.
Introduction
Spectral editing is an advantageous MRS technique that is able to selectively reveal lower-concentration J-coupled metabolites (such as GABA, GSH, and Lac) in the 1H MR spectrum by removing the overlapping stronger signals of higher-concentration metabolites. However, given the low SNR of lower-concentration metabolite signals, relatively long scan times are needed for signal averaging. A scan duration of ~10 min and a 27-mL voxel size are typically recommended for MEGA-edited acquisitions, based on a 7-year-old literature review (1). A recent study presented evidence that scan times can be shortened (whilst maintaining voxel size) without a significant increase in group-level variance (2). Here, we sought to confirm whether halving standard scan times of GABA-edited MEGA-PRESS acquisitions is viable. For this purpose, GABA-edited MEGA-PRESS data from the Big GABA repository (3,4) were analyzed by quantifying GABA+/Cr levels for complete datasets (320 averages; ~10 min) versus the first half of each (160 averages; ~5 min).Methods
Big GABA dataThe Big GABA data repository contains a normative set of GABA+-edited MEGA-PRESS acquisitions collected at 25 research sites on 3T scanners from the three major vendors: GE (8 sites); Philips (9 sites); and Siemens (8 sites). Data from 279 volunteers were used in this study. The data were acquired at each site using standard MEGA-PRESS acquisition parameters: TE/TR = 68/2000 ms; ON/OFF editing pulses = 1.9/7.46 ppm; 320 averages; 30 × 30 × 30 mm3 medial parietal lobe voxel. Further acquisition parameters are provided in the original publications (3,4).
Data analysis
Data were processed and quantified in Gannet (5) (v. 3.1.4) using the toolkit’s automated pipeline, including: coil combination (GE and Siemens data only); frequency-and-phase correction (6); zero-filling to a spectral resolution of 0.061 Hz/point; 3-Hz exponential line-broadening; weighted signal averaging; and subtraction. GABA+/Cr ratios were calculated by fitting the 3 ppm GABA+ and Cr signals in the difference and OFF spectrum with Gaussian and Lorentzian models, respectively. Model fit error was calculated as $$$\sqrt{\epsilon_{GABA}^2+\epsilon_{Cr}^2}$$$, where ε is standard deviation of fit residuals divided by the model amplitude of either GABA+ or Cr. SNR was estimated as the amplitude of the Lorentzian-modeled 2 ppm NAA peak in the OFF spectrum divided by twice the standard deviation of noise. Noise was estimated in the frequency domain between 10 and 12 ppm using the approach described previously (3). The pipeline was run either with the complete 320 averages (10-min dataset) or with only the first 160 averages (5-min dataset).
Statistical analysis
Outliers in GABA+/Cr levels, fit error, and SNR were removed in either dataset using the median absolute deviation method (7) using a rejection threshold of 2.5 (8). To assess the effect of shortening scan time from 10 to 5 min on data variance, interindividual coefficients of variation (CVs) were calculated at the level of site. An F-test was run to test for equality of variances at the cohort-wide level. An R2 value was calculated to assess the degree of variance shared between the two datasets. Paired-samples t-tests were run to test for significant differences in GABA+/Cr levels, fit error, and SNR between the two datasets.
Results
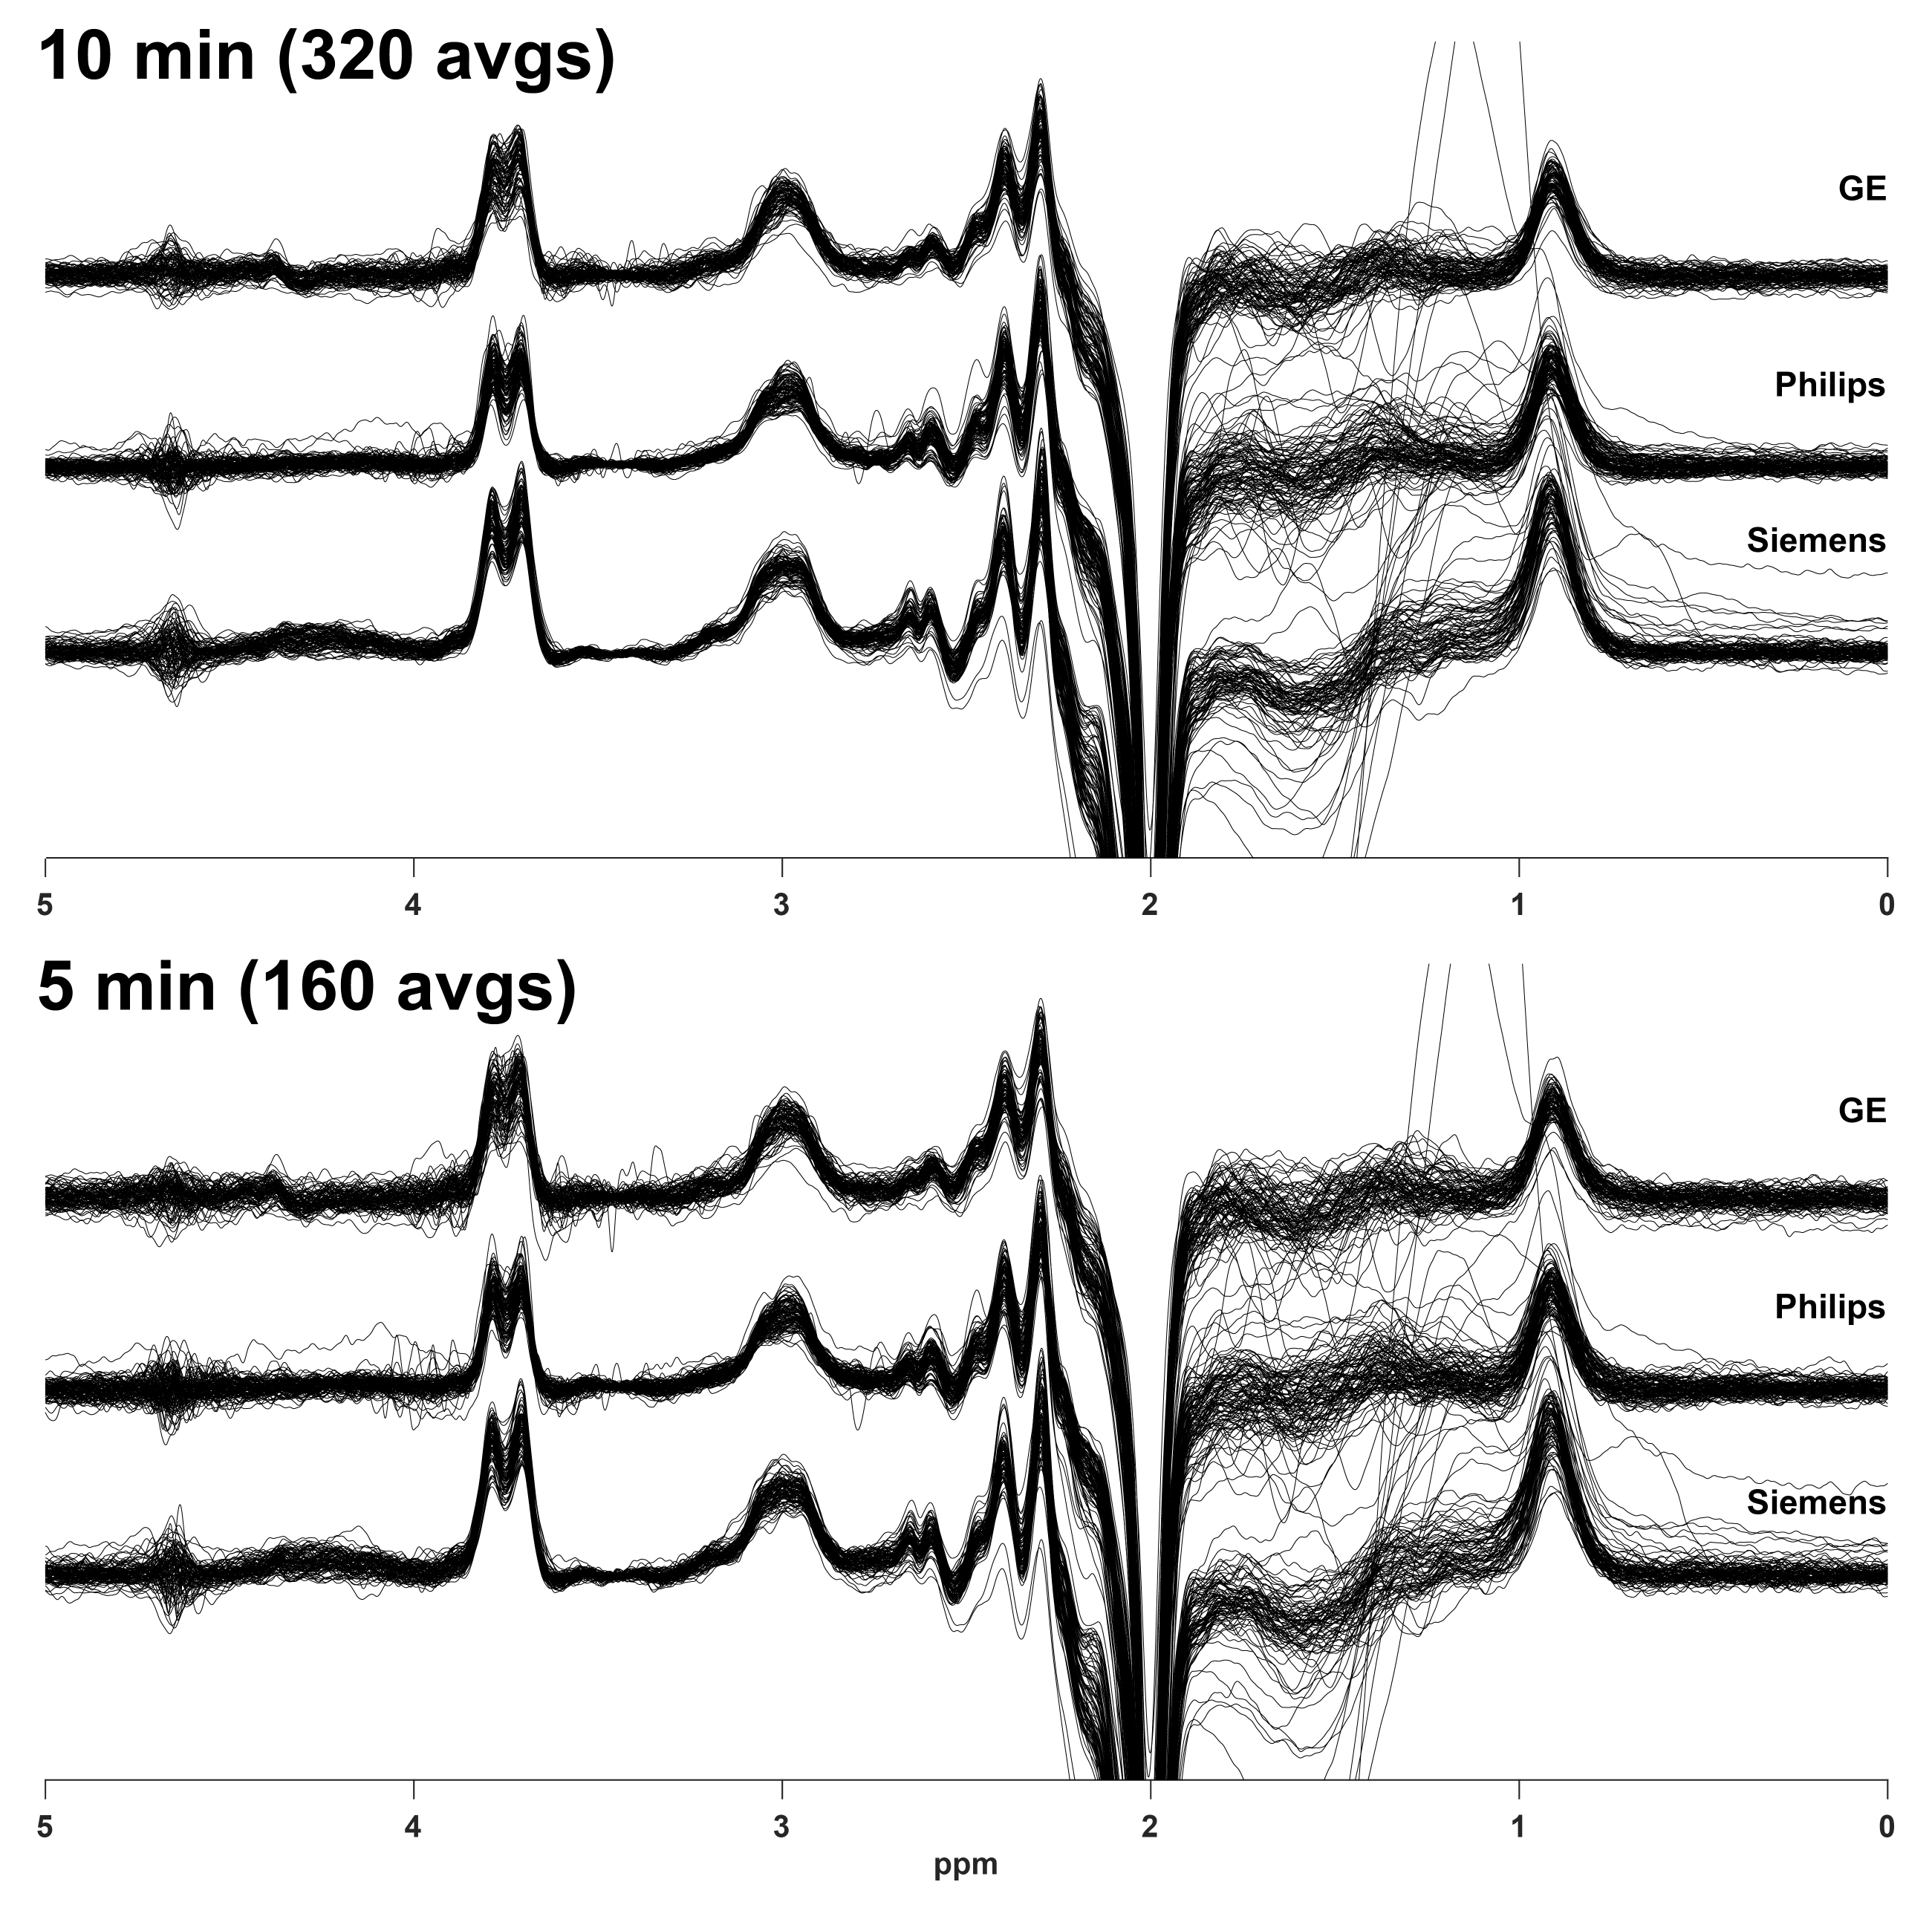
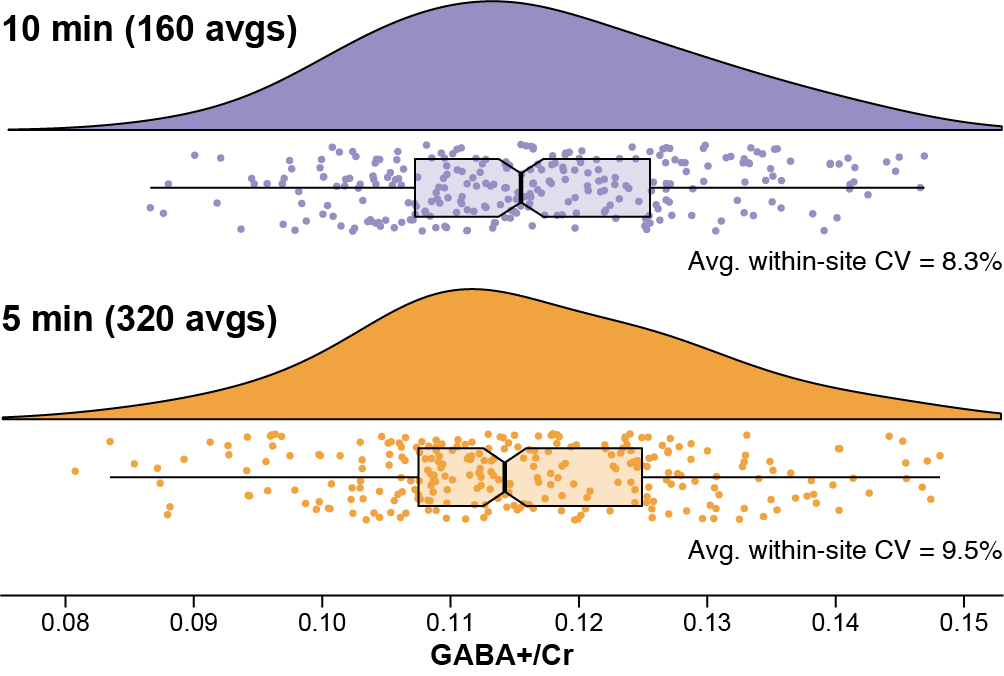
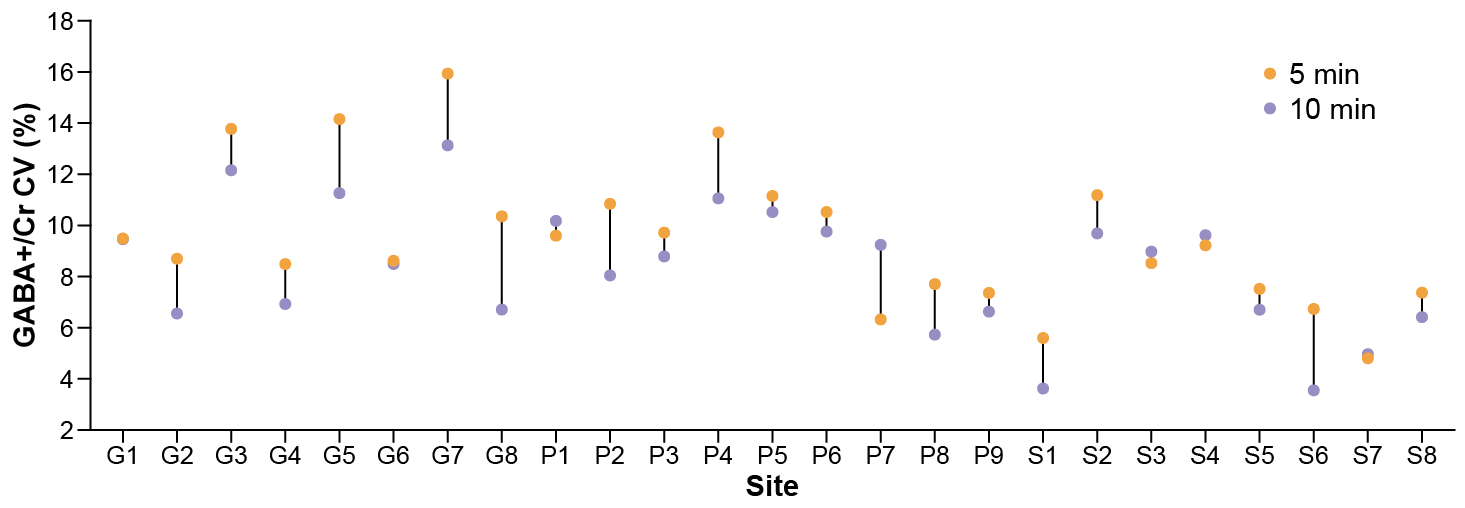
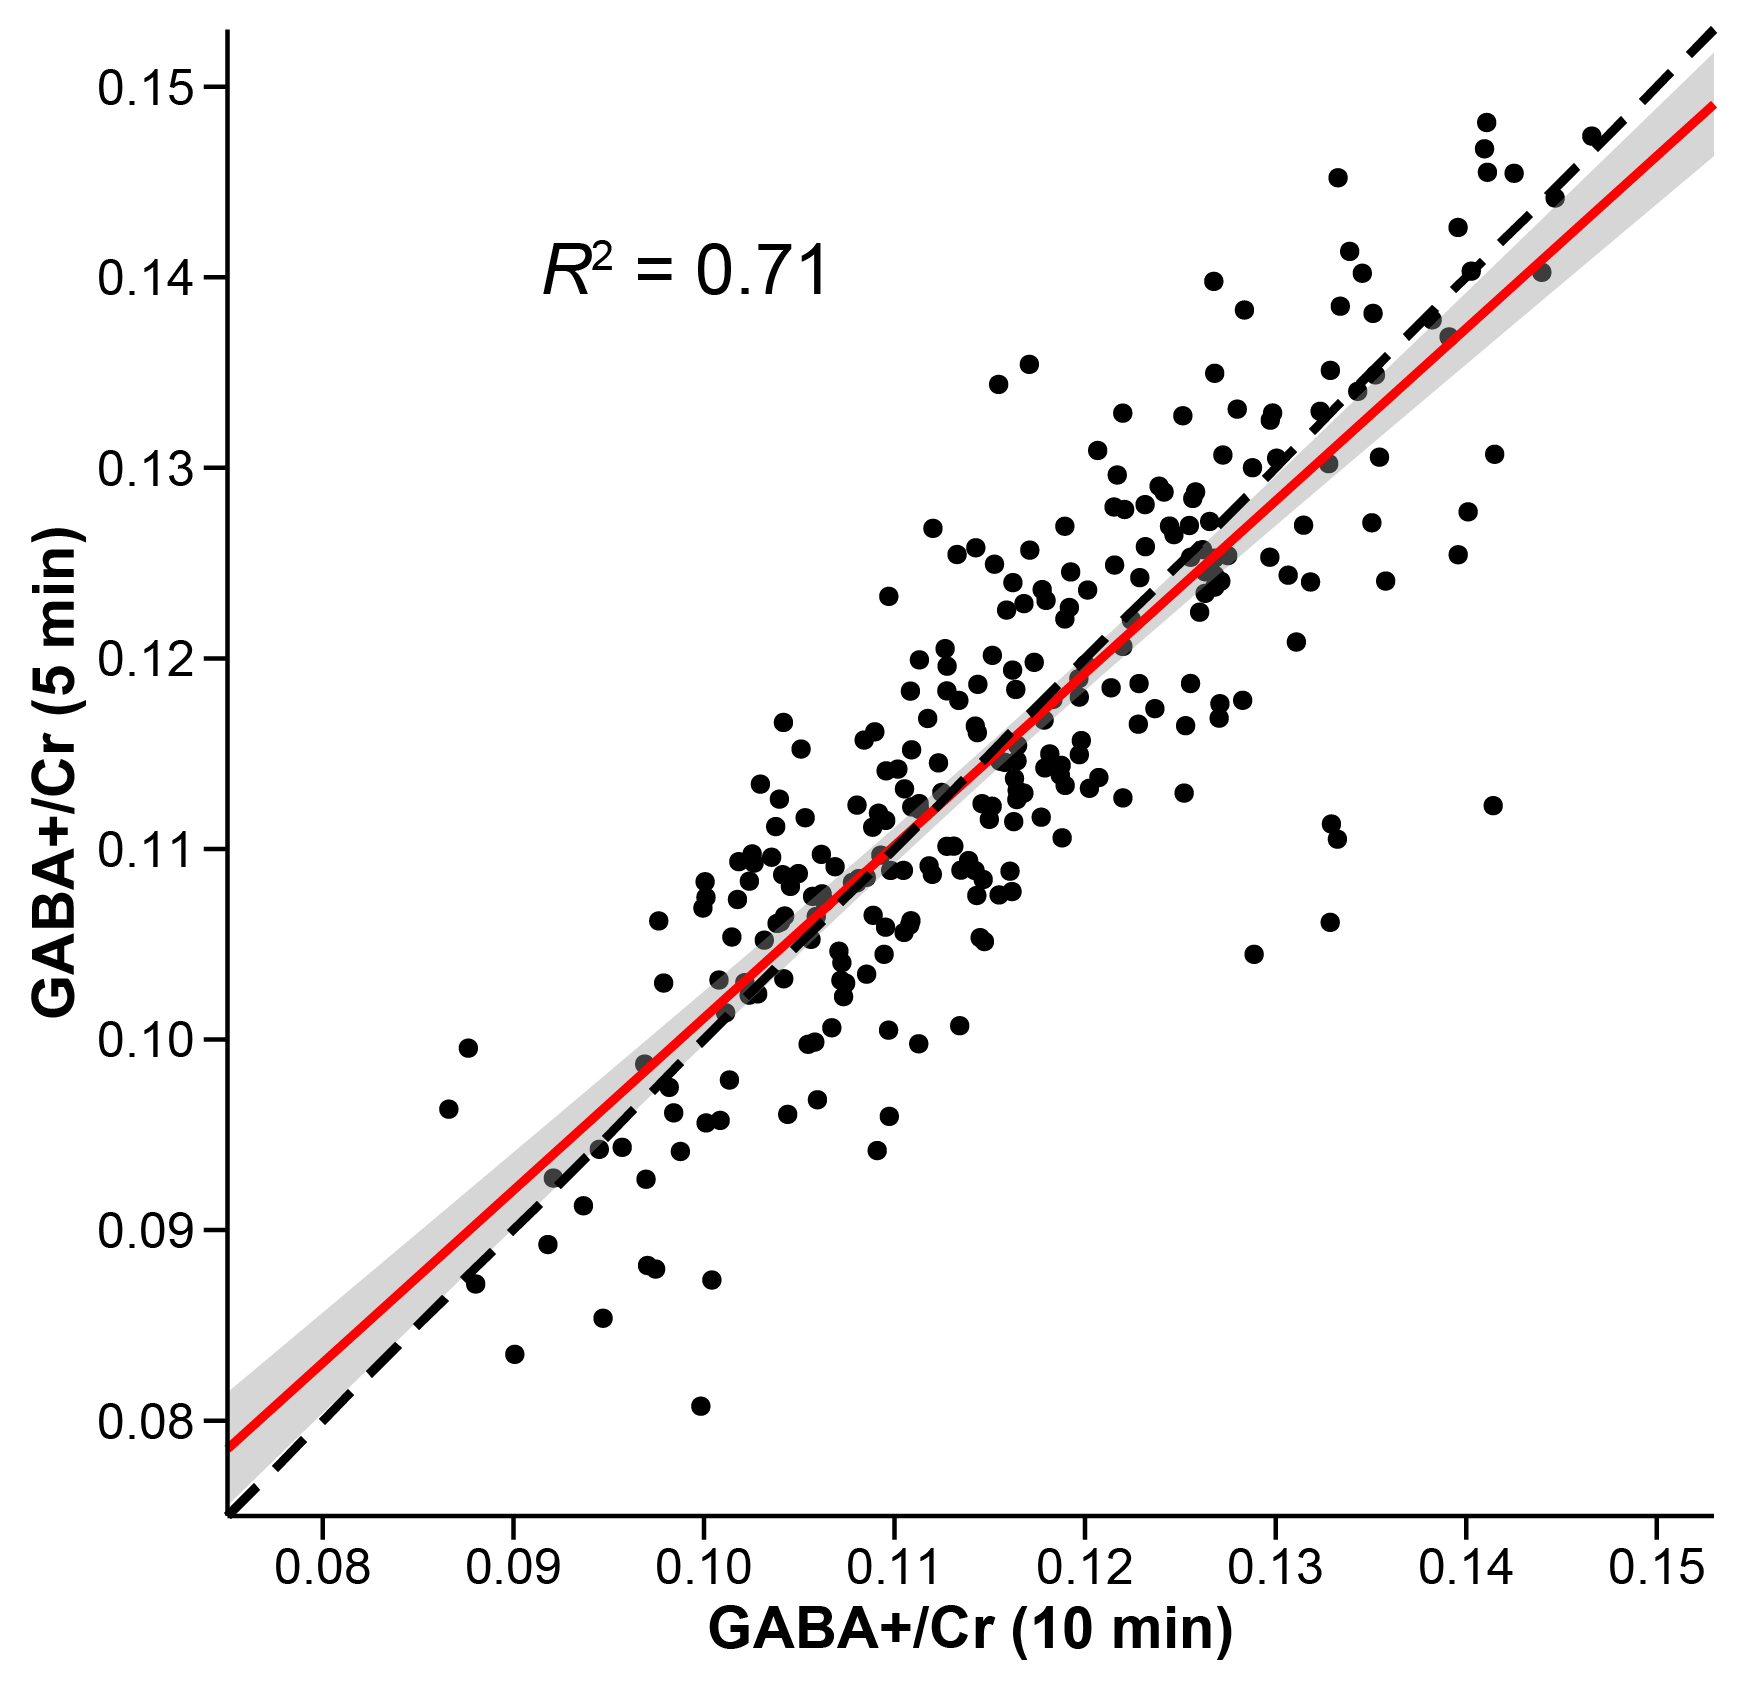
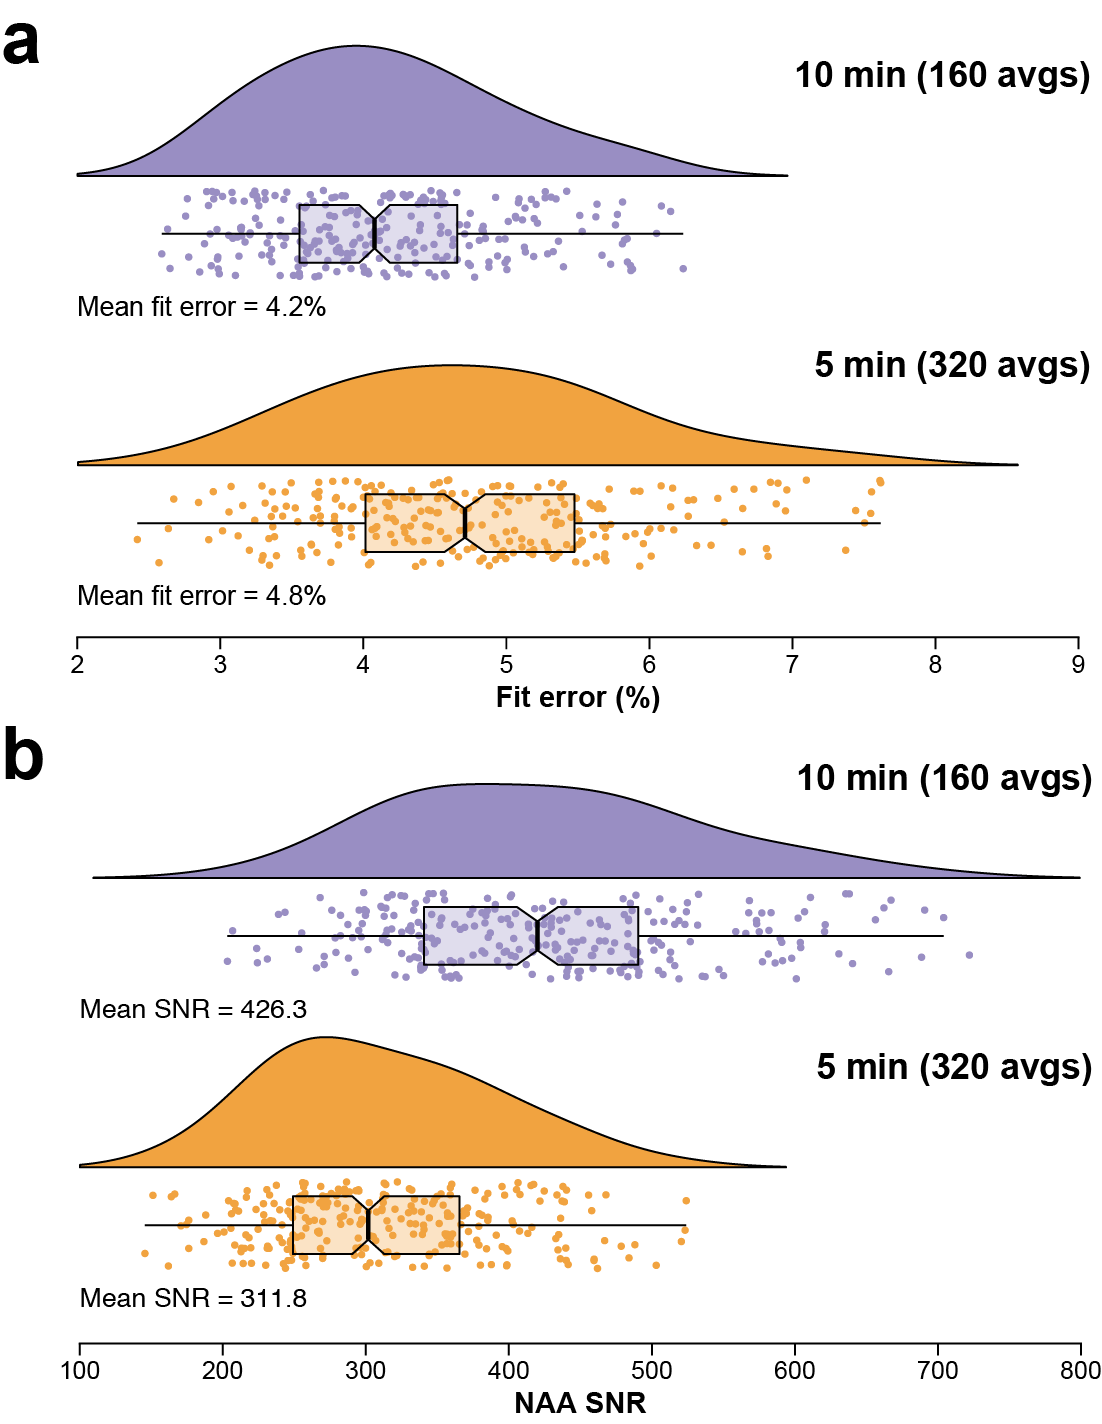
Individual spectra for the 10- and 5-min datasets are shown in Fig. 1. The shorter acquisition showed comparable data quality to the longer acquisition but with relative increases in noise, as expected. Fig. 2 shows the distribution of GABA+/Cr levels for both datasets, revealing a similar level of cohort-wide variance. There was no significant difference in GABA+/Cr levels (t(265) = 0.87, p = 0.38). The F-test showed that the cohort-wide variances of the two datasets were not significantly different (F = 0.90, p = 0.38). The average within-site CVs for the 10- and 5-min datasets were 8.3% and 9.5%, respectively. Differences in within-site CV varied between sites, however (Fig. 3). Correlating the GABA+/Cr levels showed that 71% of variance was shared between the two datasets (R2 = 0.71, p < 0.001; Fig. 4). Fit errors and SNR are shown in Fig. 5. The 5-min data had 14% more fit error on average (t(251) = 16.69, p < 0.001) and 27% less SNR on average (t(264) = 34.42, p < 0.001) compared to the 10-min data. The ratio of mean SNR (426.3/311.8) is close to the expected $$$\sqrt{320/160}$$$ ratio predicted by the SNR law of signal averaging.Conclusion
Based on a 27-mL voxel in a high-SNR region, we show that GABA-edited MEGA-PRESS acquisition can be shortened from ~10 to ~5 min without a significant increase in data variance. It is important to note that these data were acquired in the medial parietal lobe, which gives good shim linewidth and SNR; shortening acquisitions in more challenging regions (frontal or subcortical) would likely not be as reliable. Additionally, when designing a study employing edited MRS, care must be taken to properly understand the implications of not just SNR and scan time but also of predicted effect sizes and required sample sizes (2). It is apparent that the 10-min rule-of-thumb that is used in the edited MRS field need not be a hard-and-fast rule as it is possible to obtain reliable results with a 5-min scan time.Acknowledgements
This work was supported by NIH grants R01 EB016089, R01 EB023963, and P41 EB015909. The GABA-edited MEGA-PRESS data are available online on the NITRC data repository (nitrc.org/projects/biggaba).References
1. Puts NAJ, Edden RAE. In vivo magnetic resonance spectroscopy of GABA: A methodological review. Prog. Nucl. Magn. Reson. Spectrosc. 2012;60:29–41 doi: 10.1016/j.pnmrs.2011.06.001
2. Mikkelsen M, Loo RS, Puts NAJ, Edden RAE, Harris AD. Designing GABA-edited magnetic resonance spectroscopy studies: Considerations of scan duration, signal-to-noise ratio and sample size. J. Neurosci. Methods 2018;303:86–94 doi: 10.1016/j.jneumeth.2018.02.012
3. Mikkelsen M, Barker PB, Bhattacharyya PK, et al. Big GABA: Edited MR spectroscopy at 24 research sites. Neuroimage 2017;159:32–45 doi: 10.1016/j.neuroimage.2017.07.021
4. Mikkelsen M, Rimbault DL, Barker PB, et al. Big GABA II: Water-referenced edited MR spectroscopy at 25 research sites. Neuroimage 2019;191:537–548 doi: 10.1016/j.neuroimage.2019.02.059
5. Edden RAE, Puts NAJ, Harris AD, Barker PB, Evans CJ. Gannet: A batch-processing tool for the quantitative analysis of gamma-aminobutyric acid-edited MR spectroscopy spectra. J. Magn. Reson. Imaging 2014;40:1445–1452 doi: 10.1002/jmri.24478
6. Mikkelsen M, Near J, Saleh MG, Mostofsky SH, Puts NAJ, Edden RAE. Robust Correction of Frequency and Phase Errors in Edited MRS Data. In: Proceedings 27th Scientific Meeting, International Society for Magnetic Resonance in Medicine, 2019
7. Rousseeuw PJ, Croux C. Alternatives to the Median Absolute Deviation. J. Am. Stat. Assoc. 1993;88:1273–1283 doi: 10.1080/01621459.1993.10476408
8. Leys C, Ley C, Klein O, Bernard P, Licata L. Detecting outliers: Do not use standard deviation around the mean, use absolute deviation around the median. J. Exp. Soc. Psychol. 2013;49:764–766 doi: 10.1016/j.jesp.2013.03.013
Figures