2881
Comparison of an advanced, fieldmap-based shimming approach and FASTESTMAP for single-voxel 1H MR spectroscopy at 7T1Institute of Neuroscience and Medicine 4, Foschungszentrum Jülich, Jülich, Germany, 2Engineering Physics Department, Georgian Technical University, Tbilisi, Georgia, 3Faculty of Mathematics, Computer Science and Natural Sciences, RWTH Aachen University, Aachen, Germany, 4Department of Neurology, Faculty of Medicine, RWTH Aachen University, Aachen, Germany, 5JARA - BRAIN - Translational Medicine, RWTH Aachen University, Aachen, Germany, 6Institute of Neuroscience and Medicine 11, Foschungszentrum Jülich, Jülich, Germany
Synopsis
Proton MRS only benefits from ultra-high field strengths if good B0 homogeneity is achieved. For this, projection-based B0 shim techniques, e.g. FASTMAP, are commonly used in single-voxel acquisitions. However, FASTMAP and its variants typically only use up to 2nd order shim coils and only provide shim values for a specific voxel position. In contrast, fieldmap-based approaches for B0 shimming have no shim order restrictions and can be used to calculate multiple shim settings over different ROIs from a single acquisition. Here we compare projection and fieldmap-based shim approaches in brain areas known to be problematic in terms of B0 homogeneity.
Introduction
One of the main reasons for using ultra-high fields (UHF) in proton magnetic resonance spectroscopy (1H-MRS) is for the gain in spectral resolution. However, this feature can only be exploited if the main magnetic field is sufficiently homogeneous.1 In order to achieve this goal, effective approaches for B0 shimming are required. Projection-based, B0 shim techniques2 have been proposed for fast, automatic 2nd order B0 shimming and are commonly used for single-voxel MRS.3 However, this technique is typically restricted to the adjustment of up to the 2nd order shim coils and only provides shim values for one specific voxel position per shimming process. In contrast, fieldmap-based approaches4 can also include higher-order shim coils. Moreover, the acquired fieldmap can be used to calculate shim settings for multiple volumes, such as individual voxels and the entire brain. Here we investigate the advantage of this approach in comparison to projection-based techniques in terms of the achieved B0 homogeneity and the required shimming time. Measurements were performed in three brain regions which are particularly problematic regarding B0 inhomogeneity.Methods
Experiments were performed in a 7T Siemens Terra scanner (Siemens, Erlangen, Germany), equipped with a 1Tx/32Rx head-coil and a full 2nd- and partial 3rd- order shim system. A T1-weighted mp2rage sequence5 was used to ensure correct positioning of the MRS voxels. Protocol parameters were: echo-time, TE=2.88ms; repetition-time, TR=4.5s; matrix-size=160×188×188 and voxel-size=1.23mm3.MRS spectra were acquired from three brain regions in three participants: striatum, left hippocampus and pons. MRS spectra were measured using a stimulated echo acquisition mode (STEAM).6,7 For the hippocampus (voxel-size=27×13×10mm3), and pons (voxel-size=20×20×20mm3), the following protocol parameters were used: TE=4ms; mixing-time, TM=28ms; TR=8200ms; for the striatum (voxel-size=32×12×17mm3) TE/TM/TR=4/28/8000ms. Other parameters were: 50 averages; receive bandwidth, 6000Hz; vector-size, 2048. The radiofrequency power for the excitation flip-angle was calibrated for each subject. Water suppression was achieved using VAPOR8 interleaved with outer volume suppression pulses.6 One extra complete phase cycle was measured without the water suppression RF pulse to record a water peak reference for eddy-current corrections and absolute metabolite concentration calibrations.
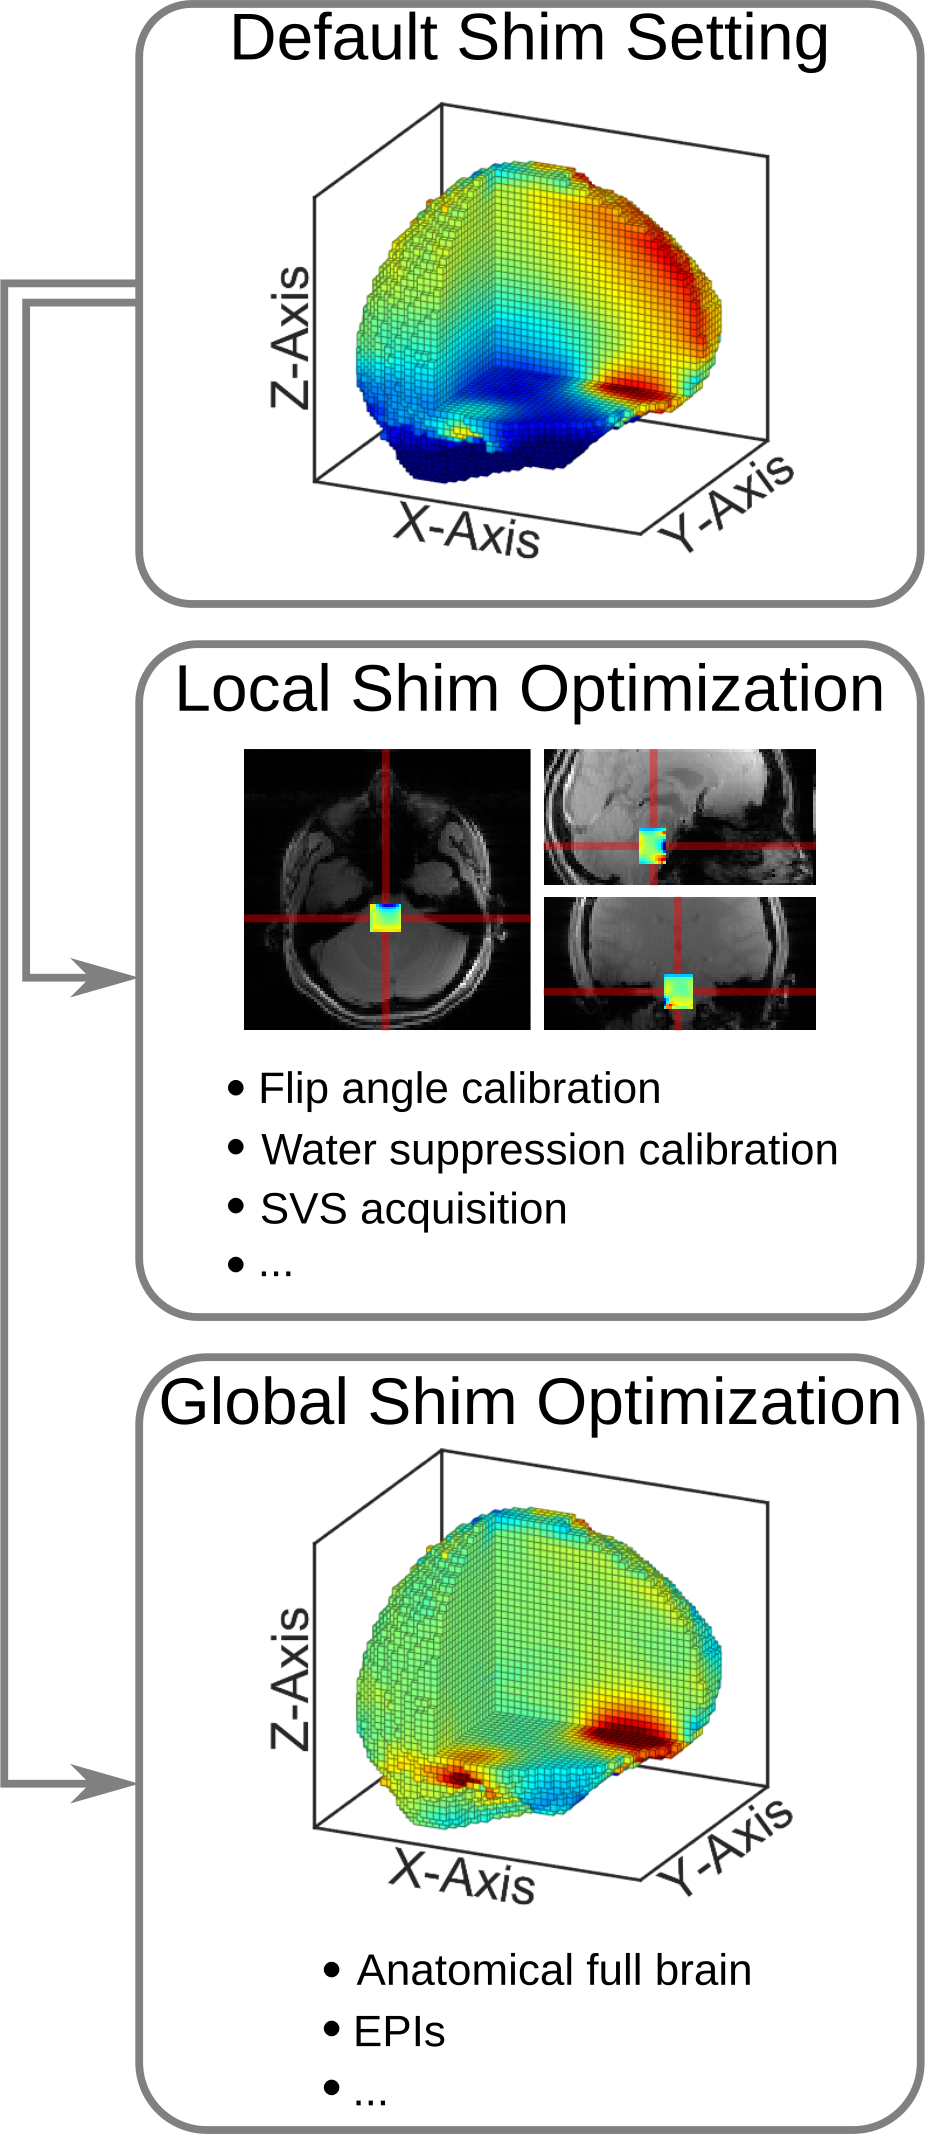
Experiments were divided into two parts. In the first part, B0 shim was performed using FASTESTMAP,9 with 1 linear and 3 non-linear iterations. The initial shim values were the ones obtained from one iteration of the shim technique provided by the vendor. Then, calibration of the excitation flip-angle was performed, and finally, the water-suppressed and water reference spectra were acquired. In the second part, the shim values were re-set to the default settings, a fieldmap was acquired, and a custom-written fieldmap-based shim technique was used to shim the MRS voxel. Subsequently, the water-suppressed and water reference spectra were re-measured. Finally, a whole-brain shim setting was calculated from the fieldmap and applied in order to test the feasibility of deriving multiple-shim settings from a single initial fieldmap acquisition. All spectra were quantified using LCModel with the basis of metabolites created using FID-A.10
The performance of each shim technique was evaluated in two ways. Firstly, we compared the full-width half maximum (FWHM) of the unsuppressed water peak via fitting with a Vought line shape.10 Secondly, we compared the Cramer-Rao lower bound (CRLB) of each metabolite.
Results and discussions
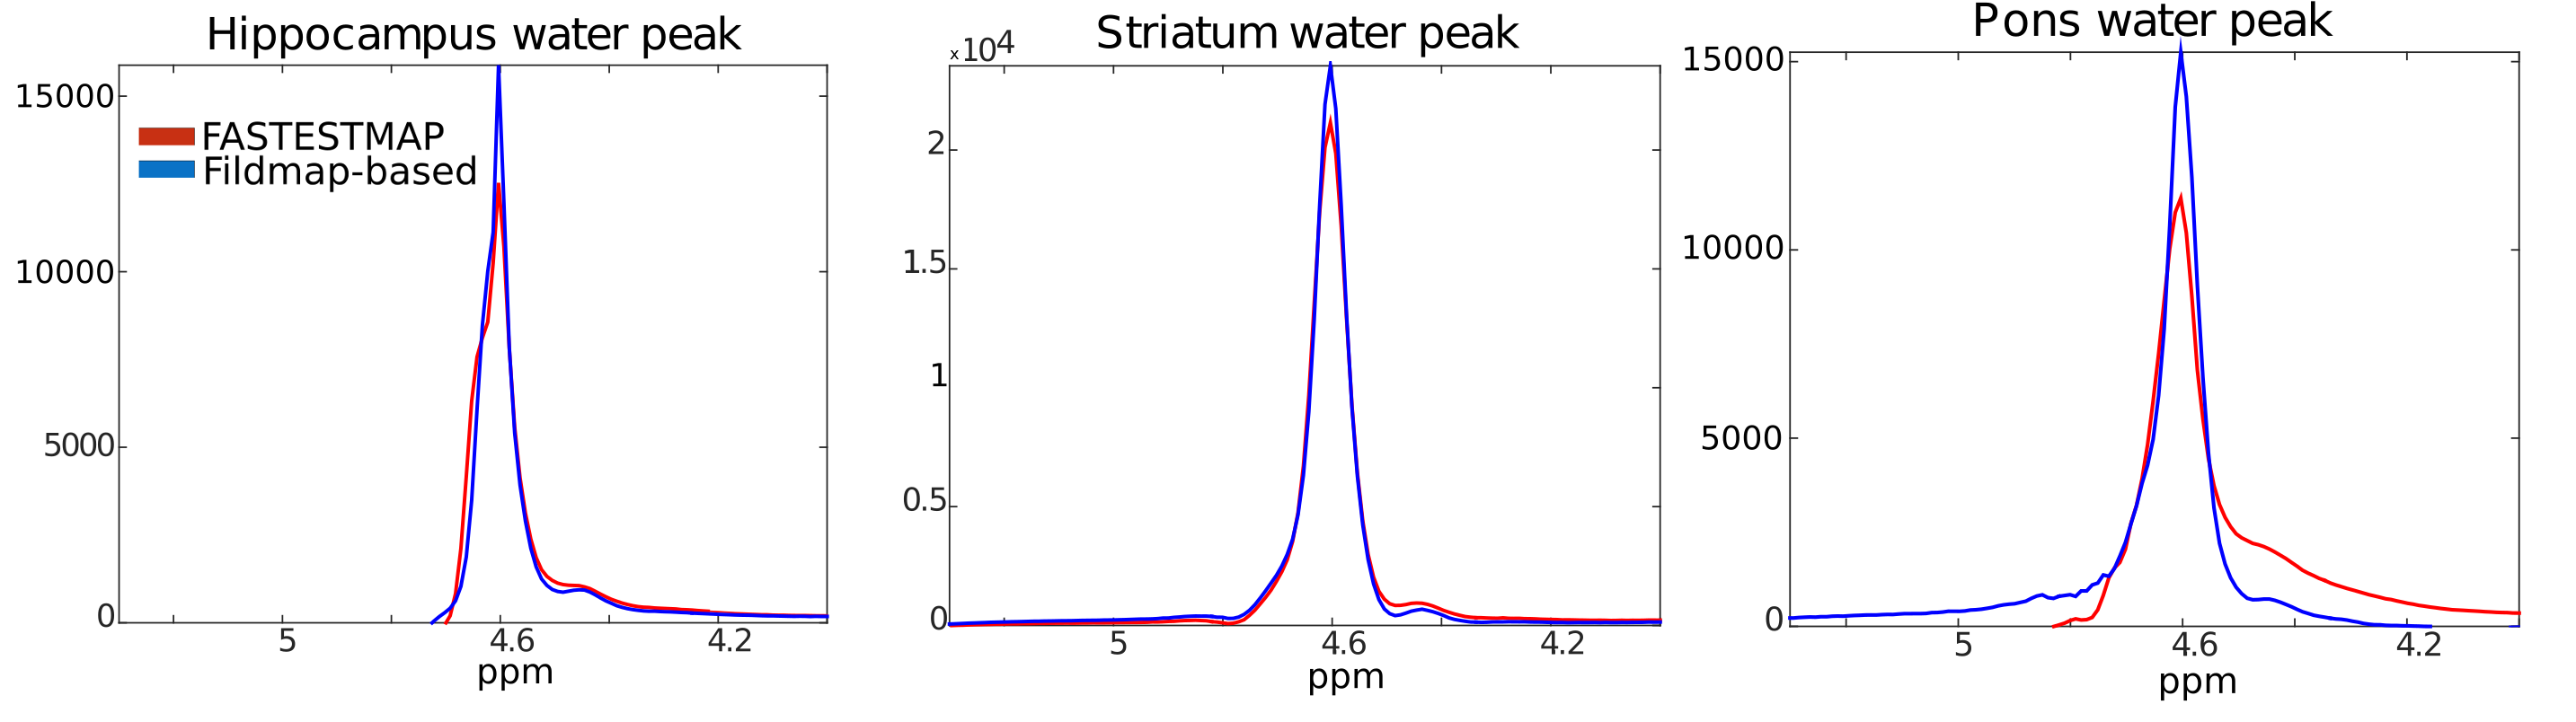
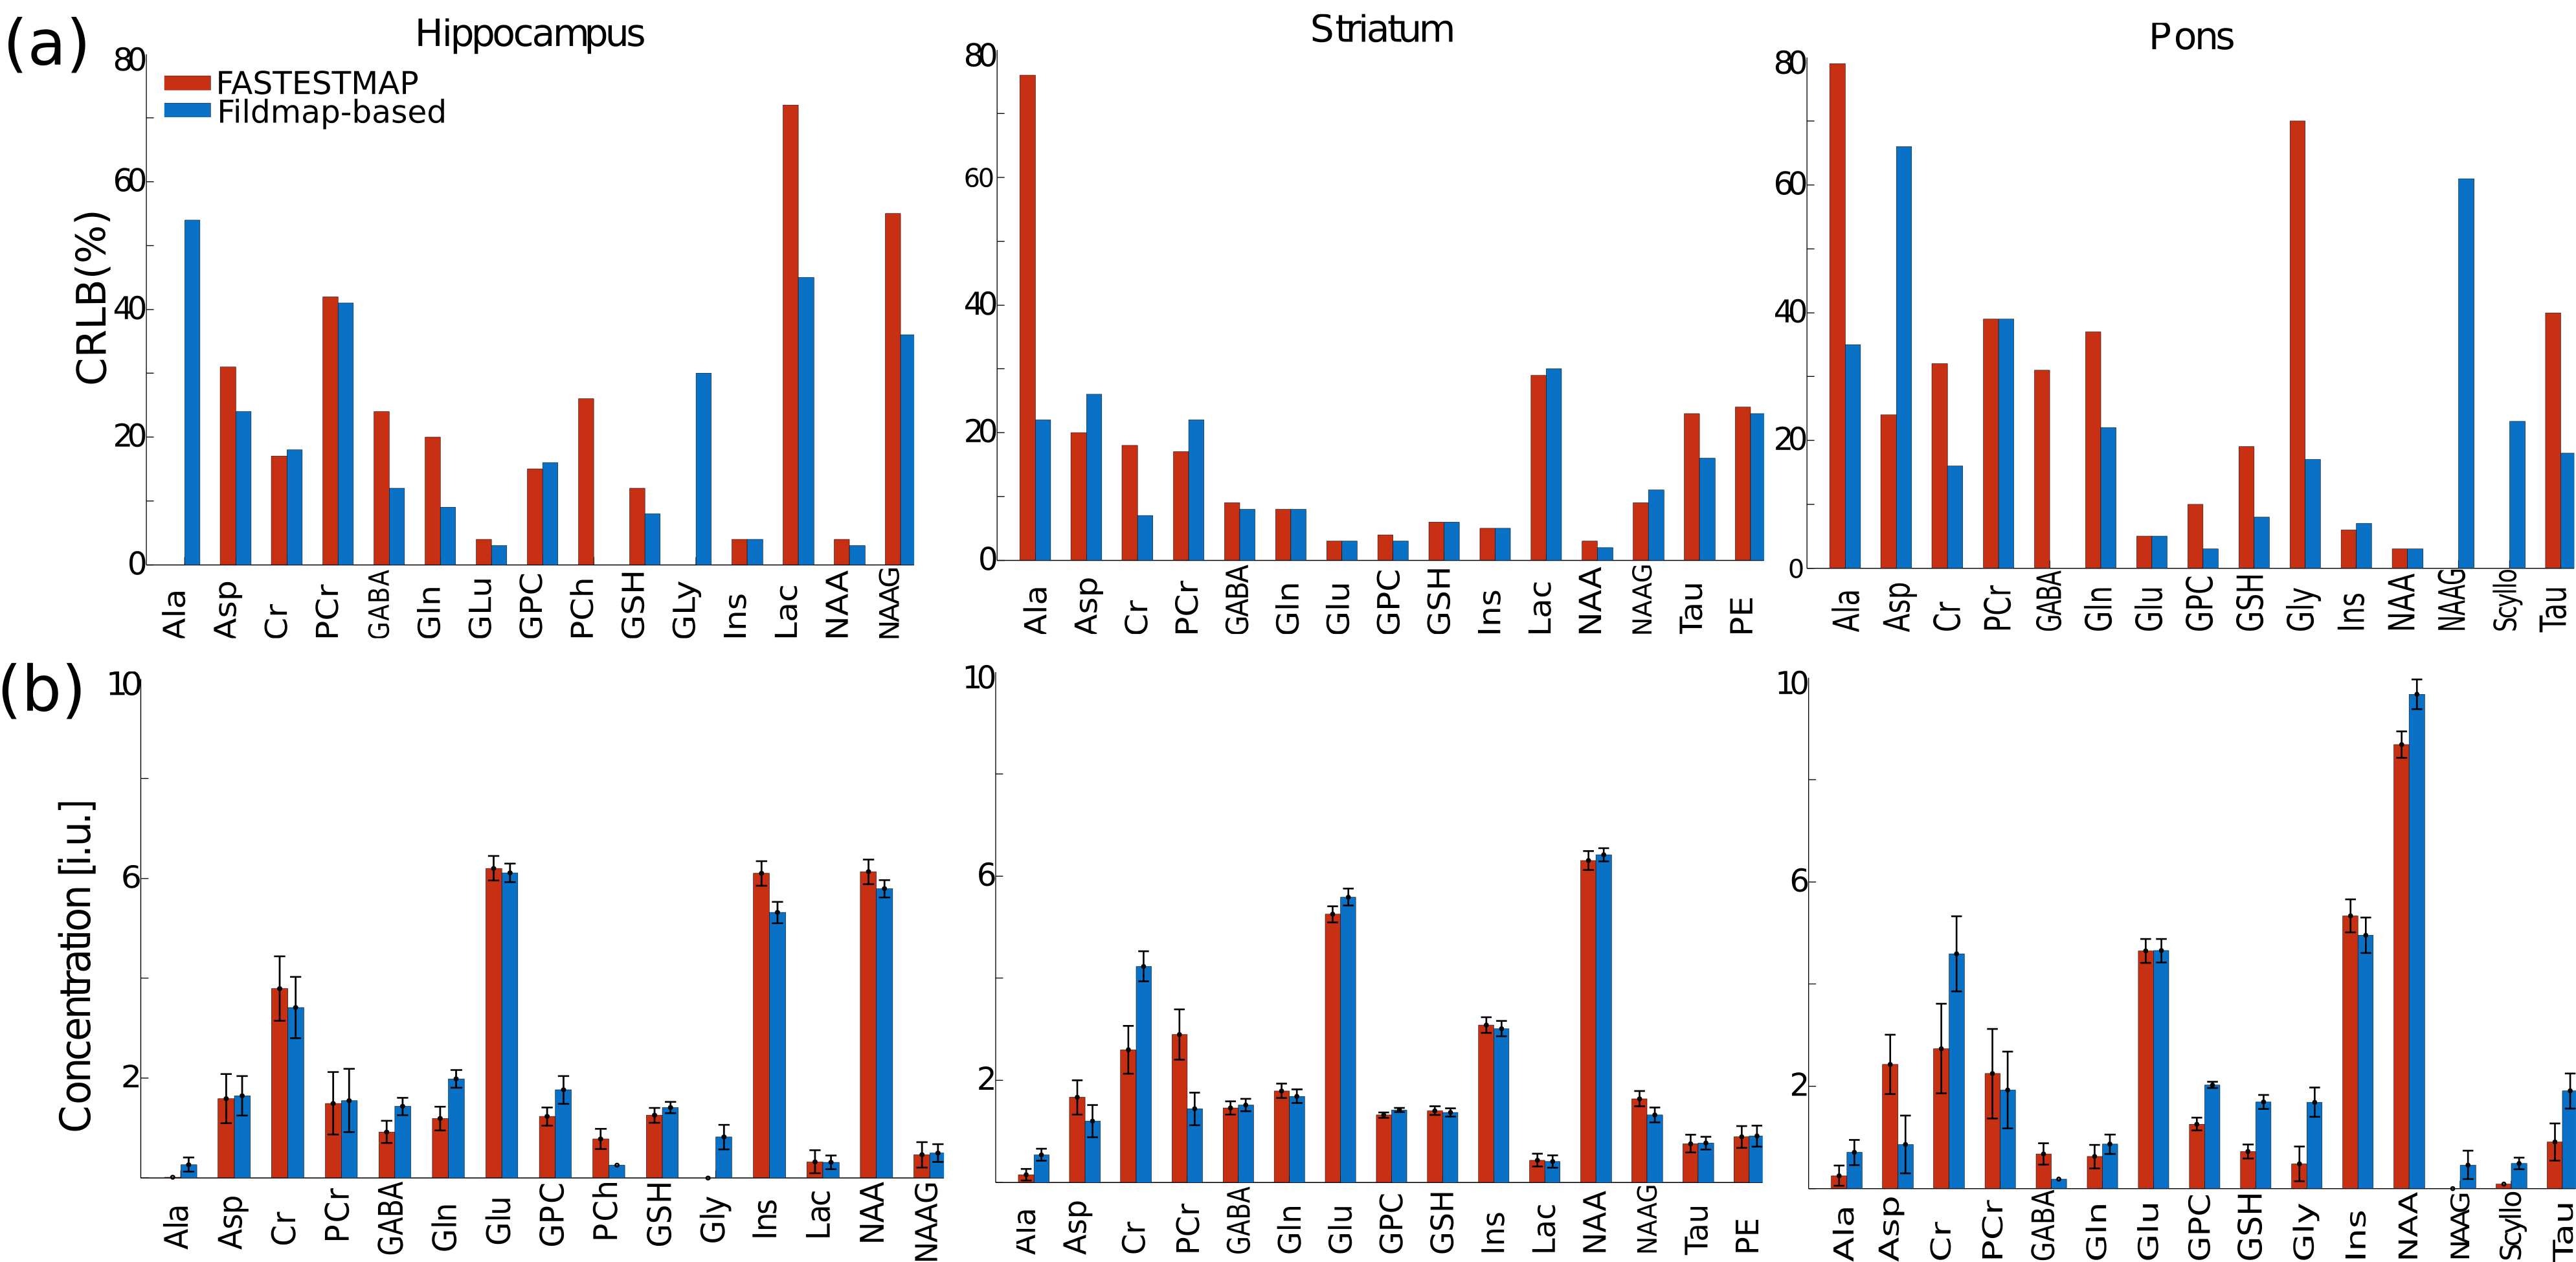
Fig.1 shows a schematic workflow of the experiments. Fig.2 shows the unsuppressed water peaks from different brain regions and subjects. We observe that the fieldmap-based shimming approach shows a narrower linewidth compared to FASTESTMAP. In the case of the fieldmap-based approach, FWHM of the hippocampus, striatum and pons were 15.4Hz, 18.4Hz and 19.7Hz, respectively, and for FASTESTMAP they were 22.1Hz, 20.4Hz and 27.7Hz, respectively. The bar plots in Fig.3a show the CRLB values for each of the detected metabolites. One can see that the CRLB values are, in general, lower in the case of the fieldmap-based shimming approach. Fig.3b shows the metabolite concentrations (in institute units, i.u.). In the case of the hippocampus, alanine and glycine were not reliably detected when FASTESTMAP was used. However, the better shimming achieved with the fieldmap-based approach enabled a reliable estimation. A similar situation was observed for NAAG and scyllo-inositol at the pons.The SNR values, defined as the ratio of the maximum in the spectrum minus the baseline over the analysis window to twice the root-mean squares of the residuals, were also compared. The SNR values from the field-based approach for the three areas (15/24/22) were higher or equal to the SNR values from the FASTESTMAP approach (12/24/17). Besides the improved spectral quality for MRS acquisitions, the fieldmap-based shim algorithm also yielded high-quality shim settings for whole-brain acquisitions without the need for a further fieldmap acquisition. Thus, no additional acquisition time-penalty is introduced.
Conclusions
We showed the preliminary results of a study in which we aim to compare the projection-based shimming approaches with fieldmap-based approaches for single-voxel MRS studies at 7T. Our results demonstrate that the water linewidth and the water suppression were superior for the fieldmap-based shimming approach, as compared to the projection-based alternative. Moreover, the CRLB values were, in general, lower for the fieldmap-based approach. In the future, we plan to measure a larger number of subjects in order to improve the statistics of the results.Acknowledgements
Supported by Shota Rustaveli National Science Foundation, Tbilisi, Georgia. We would like to acknowledge E.J. Auerbach and M. Marjanska (Center for Magnetic Resonance Research and Department of Radiology, University of Minnesota, USA) for the development of the STEAM sequence for the Siemens platform, which were provided by the University of Minnesota under a C2P agreement.References
1. Juchem C, De Graaf RA. B0 magnetic field homogeneity and shimming for in vivo magnetic resonance spectroscopy. 2017;529:17-29.
2. Gruetter R. Automatic, localized in vivo adjustment of all first- and second-order shim coils. Magn Reson Med. 1993;29(6):804-11.
3. Deelchand DK, Kantarci K, and Oz G. Improved localization, spectral quality, and repeatability with advanced MRS methodology in the clinical setting. Magnetic Resonance in Medicine 2017;79:12:1411250
4. Prammer MG, Haselgrove JC, Shinnar M, Leigh JS. A new approach to automatic shimming. Magn Reson. 1988;77(1):40–52.
5. Marques JP, Kober T, Krueger G, et al. MP2RAGE, a self bias-field corrected sequence for improved segmentation and T1-mapping at high field. Neuroimage 2010;49(2):1271-81.
6. Tkac I, Starcuk Z, Choi IY, et al. In vivo 1H NMR spectroscopy of rat brain at 1 ms echo time. Magn Reson Med 1999;41(4):649-656.
7. Marjanska M, McCarten JR, Hodges J, et al. Region-specific aging of the human brain as evidenced by neurochemical profiles measured noninvasively in the posterior cingulate cortexand the occipital lobe using 1H magnetic resonance spectroscopy at 7 T. Neurosci 2017;354:168-177.
8. Tkac I, Andersen P, Adriany G, et al. In vivo 1H NMR spectroscopy of the human brain at 7 T. Magn Reson Med 2001;46:451–456.
9. Gruetter R. Jkac I. Field mapping without reference scan using asymmetric echo-planar techniques. Magn Reson Med. 2000;43(2):319-23.
10. Simpson R, Devenyi GA, Jezzard P, et al. Processing and Simulation of MRS DataUsing the FID Appliance (FID-A)—An Open Source,MATLAB-Based Toolkit. Magnetic Resonance in Medicine 2017;77:23–33
Figures