2880
The impact of receiver bandwidth and number of points on MRS fitting accuracy1Centre for the Developing Brain, School of Biomedical Engineering and Imaging Sciences, King's College London, London, United Kingdom, 2Department of Brain Sciences, Faculty of Medicine, Imperial College London, London, United Kingdom
Synopsis
The aim of this work was to investigate the effect of receiver bandwidth and number of points in the fitting of MRS spectra acquired in healthy controls, using a LASER MRS sequence at 3T. Our results highlight the need for harmonisation between different studies in terms of BW/number of points wherever possible, since variations across clinical populations might not be detected due to systematic errors induced from variations in these parameters alone. Optimisation of BW/number of points is also encouraged when setting up a new study.
INTRODUCTION:
MR Spectroscopy (MRS) is a non-invasive tool for measuring quantitative in vivo metabolic concentrations in the human brain, widely available in clinical settings. However, routine clinical adoption of MRS is limited by a range of factors, hindering robustness and reproducibility. These include spectral overlap, low SNR, B0 homogeneity, chemical shift displacement, and a wide range of MRS sequences/implementations and analysis choices, which have been addressed in several recent efforts1,2,3. Receiver bandwidth (BW, or equivalently ADC dwell time) and number of points are two important factors which have not been explored in detail in the literature.AIM:
To investigate the effect of receiver bandwidth and number of points in the fitting of MRS spectra acquired in healthy controls, using a LASER MRS sequence at 3T.METHODS:
Subjects N= 11 healthy control subjects were recruited.Imaging MRI was performed on a Siemens Verio 3T (32-channel head coil). Each subject had T1-MPRAGE (TE=2.98ms, TR=2.3s, 1mm isotropic, 5min scanning time), to guide the positioning of the voxel. After an initial fieldmap-based shim, two iterations of FASTESTMAP4 were performed in the chosen voxel (posterior cingulate cortex 20x20x20mm3), followed by LASER MRS (C2P5, TE=72ms, TR=3s, 512 acquisitions, 16348 points, BW=16kHz (readout duration of 1s), VAPOR water suppression, 26min scanning time). A spectrum without water suppression was also acquired from the same voxel as reference and for subsequent eddy current correction ECC (NA=16).
Analysis MRS data were pre-processed in Matlab, using FID-A6 (spectral registration) and scripts developed in-house (eddy current correction7, automatic zero and first order phase correction). One dataset was excluded from further analysis due to a poor shim. Each spectrum was resampled to generate different bandwidths/number of points combinations (2 to 16kHz; 1024 to 16384 points). All the resultant spectra were fitted in the time domain using TARQUIN8, with the default “1h_brain” basis set and fitting parameters as described in Figure 2. Metabolites with consistently low CRLBs (<30%) were included in the statistics (total creatine tCr, glutamate + glutamine Glx, myo-inositol Ins, total N-acetyl-aspartate tNAA (NAA+NAAG), NAA and total choline tCho). Results are expressed as average metabolic concentrations or CRLBs (TARQUIN’s concentration and CRLBs estimates) ± standard error on the mean.
RESULTS:
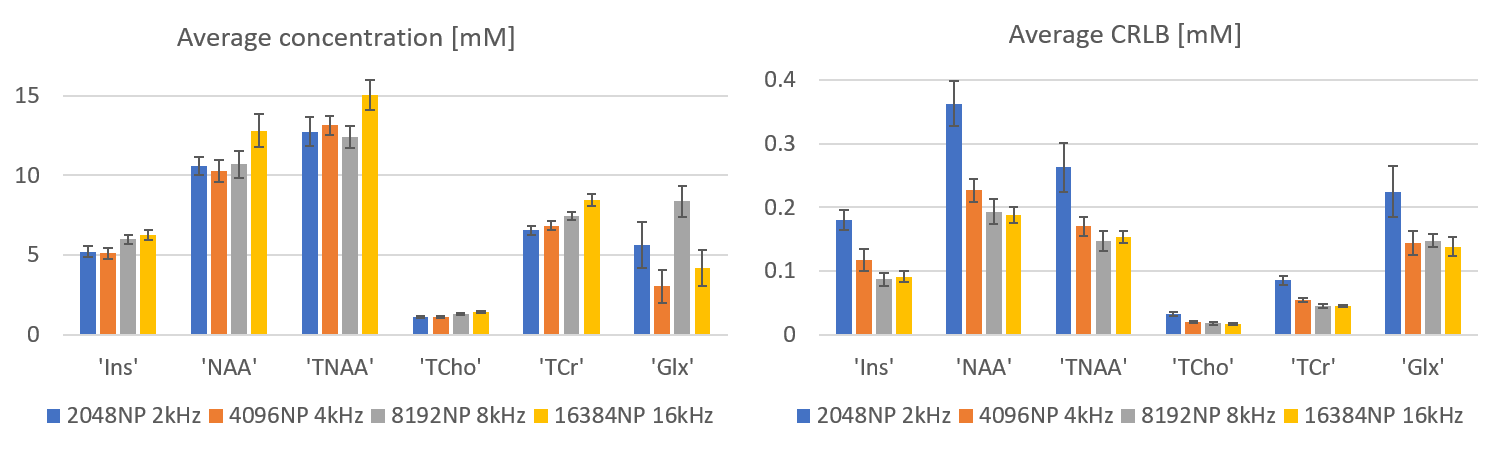
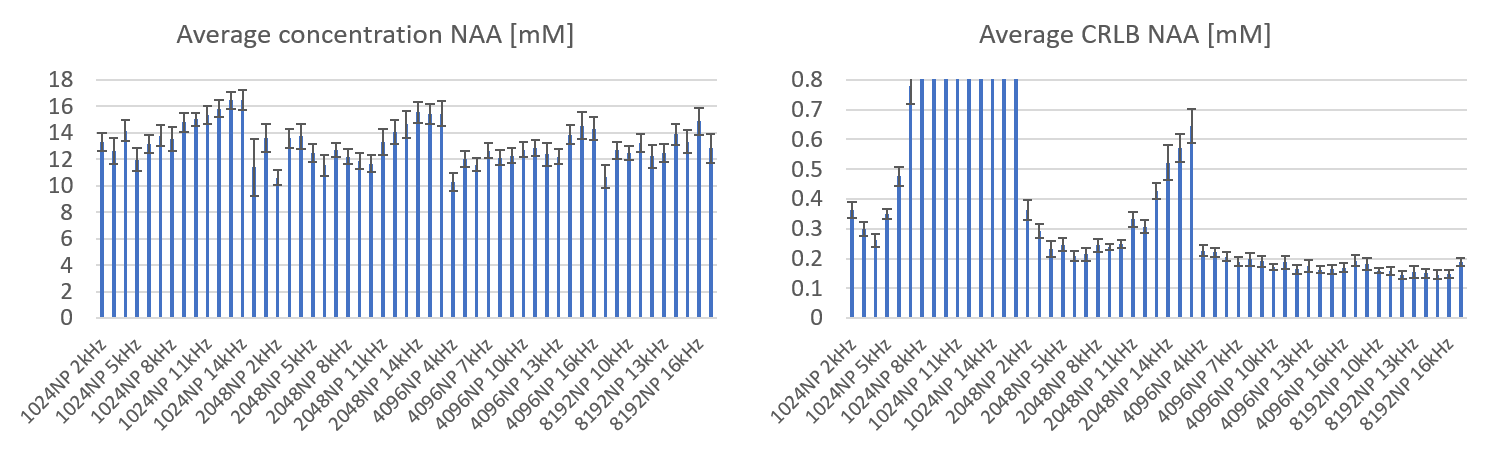
Figure 1 illustrates the MRS voxel, located in the posterior cingulate cortex (20x20x20mm3) and Figure 2 contains examples of MRS spectra and TARQUIN fitting for a representative subject.Figure 3 shows the average metabolic concentration estimates and CRLBs for different BWs (dwell times) for the same total FID sampling duration (i.e. 1s). Figure 4 shows the average NAA estimates and standard error across all subjects for all BW/number of points combinations, including those which produced a shorter FID sampling duration. Very short FID sampling durations resulted in markedly poorer fitting precision.
DISCUSSION:
The estimated error (CRLB) underestimates the variation of fitted concentrations results produced by different BWs/number of points even though these have been resampled from the same raw data (only a single acquisition per subject). In many cases, variation in BW/number of points had a larger effect on concentration estimates than the variation between subjects.CONCLUSION:
Our results highlight the need for harmonisation between different studies in terms of BW/number of points wherever possible, since variations across clinical populations might not be detected due to systematic errors induced from variations in these parameters alone. Optimisation of BW/number of points is also encouraged when setting up a new study.Acknowledgements
No acknowledgement found.References
1. Wilson M, Andronesi O, Barker PB et al. Methodological consensus on clinical proton MRS of the brain: Review and recommendations. MRM. 2019; 82(2):527‐550.
2. Saleh M, Rimbault D, Mikkelsen M et al. Multivendor standardized sequence for edited magnetic resonance spectroscopy. NeuroImage 2019; 189:425-431.
3. Bhogal A, Schür R, Houtepen L et al. 1H–MRS processing parameters affect metabolite quantification: The urgent need for uniform and transparent standardization. NMR in Biomed. 2017; 30(11):e3804
4. Gruetter R and Ivan Tkac. Field mapping without reference scan using asymmetric echo-planar techniques. MRM. 2000; 43:319-323
5. CMRR Spectroscopy Package. https://www.cmrr.umn.edu/spectro/. Accessed November 4, 2019.
6. Simpson R, Devenyi GA, Jezzard P et al. Advanced processing and simulation of MRS data using the FID appliance (FID-A)-An open source, MATLAB-based toolkit. MRM. 2017; 77(1):23-33
7. Klose U. In vivo proton spectroscopy in presence of eddy currents. MRM. 1990; 14(1):26-30
8. Wilson M, Reynolds G, Kauppinen RA et al. A constrained least-squares approach to the automated quantitation of in vivo 1H magnetic resonance spectroscopy data. MRM. 2011; 65(1):1-12
Figures
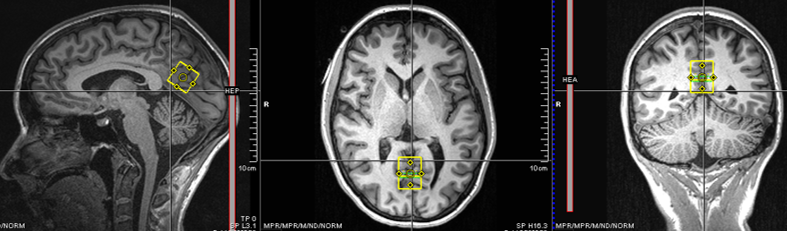
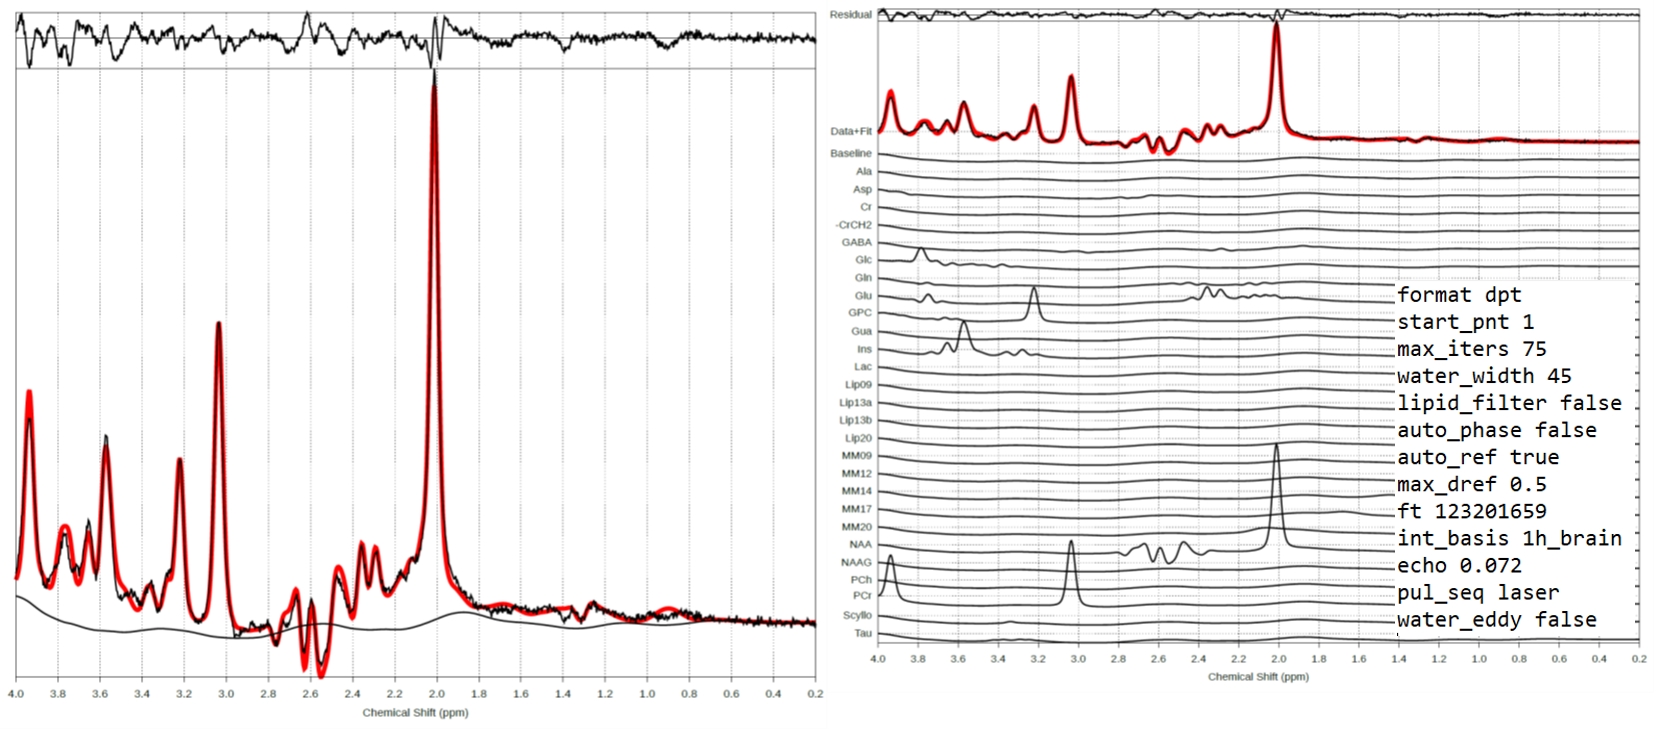
Fig 2. TARQUIN quantification of a representative spectrum (16kHz BW, 16384 points), individual metabolite fitting detail for the same subject and fitting parameters.
1h_brain basis set includes metabolites: Ala, Asp, Cr, -CrCH2, GABA, Glc, Gln, Glu, GPC, Gua, Ins, Lac, NAA, NAAG, PCh, Scyllo, Tau; lipids: Lip09, Lip13a, Lip13b, Lip20 and macromolecules: MM09, MM12, MM14, MM17, MM20.