2873
In Situ Quantification of the Longitudinal Relaxation Time of Phophatidylcholine in Human Bile at 7T
Lorenz Pfleger1,2, Albrecht Ingo Schmid2,3, Stefan Wampl2,3, Martin Gajdošík1,2,4, Siegfried Trattnig2,5, Michael Krebs1, and Martin Krššák1,2,5
1Division of Endocrinology and Metabolism, Department of Medicine III, Medical University of Vienna, Vienna, Austria, 2High-field MR Centre, Department of Biomedical Imaging and Image-guided Therapy, Medical University of Vienna, Vienna, Austria, 3Center for Medical Physics and Biomedical Engineering, Medical University of Vienna, Vienna, Austria, 4Department of Biomedical Engineering, Columbia University, New York, NY, United States, 5Christian Doppler Laboratory for Clinical Molecular MR Imaging, Vienna, Austria
1Division of Endocrinology and Metabolism, Department of Medicine III, Medical University of Vienna, Vienna, Austria, 2High-field MR Centre, Department of Biomedical Imaging and Image-guided Therapy, Medical University of Vienna, Vienna, Austria, 3Center for Medical Physics and Biomedical Engineering, Medical University of Vienna, Vienna, Austria, 4Department of Biomedical Engineering, Columbia University, New York, NY, United States, 5Christian Doppler Laboratory for Clinical Molecular MR Imaging, Vienna, Austria
Synopsis
This study focuses on the in vivo determination of the longitudinal relaxation time (T1) of phosphatidylcholine (PtdC) in the gallbladder at 7T and its challenges. In most cases, it was possible to assess T1 with a 1D-ISIS sequence. In cases where the gallbladder is further away from the coil a STEAM sequence, which does not depend on 180° RF pulses, can be used. The T1 values of PtdC ranged between 290 and 480ms.
Purpose
Phosphatidylcholine (PtdC)1 is a dominant signal visible in the 31P MR spectrum. Changes in its concentration could be an indicator of an altered metabolism2 and hepatobiliary pathologies3,4. Previously reported PtdC quantification4 assumed a constant concentration of internal reference of γ-ATP in the liver as well as a T1 of PtdC in the gallbladder being equal to that in liver. The determination of T1 of the human bile’s PtdC is necessary for the correction of partial saturation and its changes could also be induced by pathologies5. Thus, this study focuses on the development of a robust method for measuring T1 of PtdC in the gallbladder as a necessary step for true absolute quantification.Subjects/Methods
Nine healthy volunteers (age: 24–34y, BMI: 24.1±3.0kg.m-2) were measured after overnight fasting on a 7T MR System (Siemens Healthcare, Erlangen, Germany) using double-tuned 1H/31P surface coil (31P-loop: 14cm, Rapid Biomedical, Rimpar, Germany). Initial measurements (n=4) were carried out with the volunteer lying on the right side on top of the coil with the gallbladder centered. These measurements were performed with TR of 6s to assure full relaxation of PtdC. Later on positioning was changed due to discomfort to supine position with the coil strapped down to the chest (n=5) and the TR adjusted to 3s based on fast relaxation of PtdC. Proper setup was confirmed by scout images and the position of the coil adjusted if necessary. Shimming was based on a field mapping sequence provided by the vendor and manually readjusted on a volume including the gallbladder and liver tissue but avoiding air filled cavities. For T1 determination, several sequences were used:- 1D-image-selected-in-vivo-spectroscopy (ISIS) based inversion recovery (IR) sequence (slice thickness=30mm, TR=3000ms, TE=0.4ms, 8 averages, 10 inversion times TI=40–1500ms) as preferred method,
- 1D-depth-resolved-MR-spectroscopy (DRESS) based IR sequence (same parameters except for TE=2ms, 16 averages) for experimental comparison,
- Single-voxel-spectroscopy (SVS) with stimulated-echo-acquisition-mode (STEAM) based saturation recovery (SR) sequences (16 times with TR=150-1000ms, TE=9.4ms (12.4ms for short TR), 256-512 averages) in case of exceeding the SAR limits.
Results
Using data from IR-1D-ISIS experiments (Fig.2) we could derive T1 values of 372±71ms (n=5, range: 291-473ms, Fig.3). In one alternative measurement using SR with STEAM we obtained a T1 value of 515ms. A comparison between ISIS-IR and DRESS-IR in another volunteer yielded in a T1 of 319ms and 395ms, respectively. Additionally, T1 of γ- and α-ATP (originating from liver tissue) was evaluated in one volunteer resulting in values of 598ms and 592ms, respectively.Discussion
The initial measurements showed that T1 of PtdC is short enough to half our TR. Additionally, a shorter TR suppresses the signals arising from phosphodiesters (PDE) due to their longer T1s (~4-6ms8,9). This is of advantage since the signal of glycerophosphocholine is only 0.7ppm downfield of PtdC and might lead to an overfitting of PtdC due to signal contamination especially in case of different signal phase (Fig.4A). Phase differences can arise from different signal origins within the VOI (e.g. PDE presence in liver tissue) and different relaxation states (T1). This could be the reason for an overshot in fitted amplitude during the IR experiment at around TI of 1000–1500ms (Fig.4B). The alternative scan employing SR can be used in cases when the gallbladder is located further away from the surface coil and the scanner prevent the use of an ISIS sequence due to a high power demand. The drawbacks of the SR method are the lower dynamic range and increased motion artifacts due to breathing (Fig.1). The evaluation of the T1 value of γ- and α-ATP is in accordance with literature values in liver tissue (γ-ATP: 500±80ms8/570±150ms9, α-ATP: 460±70ms8/560±90ms9). Previously, a much higher T1 value for PtdC in the liver (1050ms±280ms) was reported9. Explanation for significantly shorter T1 could be the presence of PtdC in lipid containing vesicles in the bile and the possible presence of phosphoenolpyruvate in the hepatic parenchyma with very similar chemical shift and longer T1. Using our results of T1 for PtdC and applying the saturation correction on the previous quantification2 the concentration of PtdC was 9.7±1.0mM, which is in good agreement with the measurement using mass spectrometry on the whole bile in healthy controls: 8.0±1.8mM10.Conclusion
T1 values of PtdC in the gallbladder were assessed with 1D-sequences (DRESS/ISIS) and with a SVS sequence (STEAM) at 7T. For the latter, a motion correction technique is favorable alike one study has shown on the heart11.Acknowledgements
This study was supported by the Project “Sammelauftrag § 27 PL Prof. Krebs“ (SA716A0012).References
- Chmelík M, Valkovič L, Wolf P, et al. Phosphatidylcholine contributes to in vivo (31)P MRS signal from the human liver. Eur Radiol. 2015;25(7):2059-66.
- Pfleger L, Halibasic E, Gajdošík M, et al. Quantification of Phosphatidylcholine in the Gall Bladder Using Phosphorus MRSI Suggest Differences in Biliary Disorders: A Pilot Study. Proc ISMRM 26 Paris. 2018:0163.
- Khan SA, Cox IJ, Thillainayagam AV, et al. Proton and phosphorus-31 nuclear magnetic resonance spectroscopy of human bile in hepatopancreaticobiliary cancer. Eur J Gastroenterol Hepatol. 2005;17(7):733-8.
- Valkovič L, Chmelík M, Krššák M. In-vivo31P-MRS of skeletal muscle and liver: A way for non-invasive assessment of their metabolism. Anal Biochem. 2017;15;529:193-215.
- Cassinotto C, Feldis M, Vergniol J, et al. MR relaxometry in chronic liver diseases: Comparison of T1 mapping, T2 mapping, and diffusion-weighted imaging for assessing cirrhosis diagnosis and severity. Eur J Radiol. 2015;84(8):1459-1465.
- Naressi A, Couturier C, Devos JM, et al. Java-based graphical user interface for the MRUI quantitation package. MAGMA. 2001;12(2-3):141–152.
- Stefan D, Cesare FD, Andrasescu A, et al. Quantitation of magnetic resonance spectroscopy signals: the jMRUI software package. Meas Sci Technol. 2009;20(10):104035.
- Chmelik M, Považan M, Krššák M, et al. In vivo (31)P magnetic resonance spectroscopy of the human liver at 7 T: an initial experience. NMR Biomed. 2014;27(4):478-85.
- Purvis LAB, Clarke WT, Valkovič L, et al. Phosphodiester content measured in human liver by in vivo 31 P MR spectroscopy at 7 tesla. Magn Reson Med. 2017;78(6):2095-2105.
- Gauss A, Ehehalt R, Lehmann WD, et al. Biliary phosphatidylcholine and lysophosphatidylcholine profiles in sclerosing cholangitis. World J Gastroenterol. 2013;7;19(33):5454-63.
- Körner T, Wampl S, Meyerspeer M, et al. 3D heart localization for free breathing cardiac MR navigators in real time at 3T and 7T. Proc ESMRMB 36 Rotterdam. 2019:L06.10.
Figures
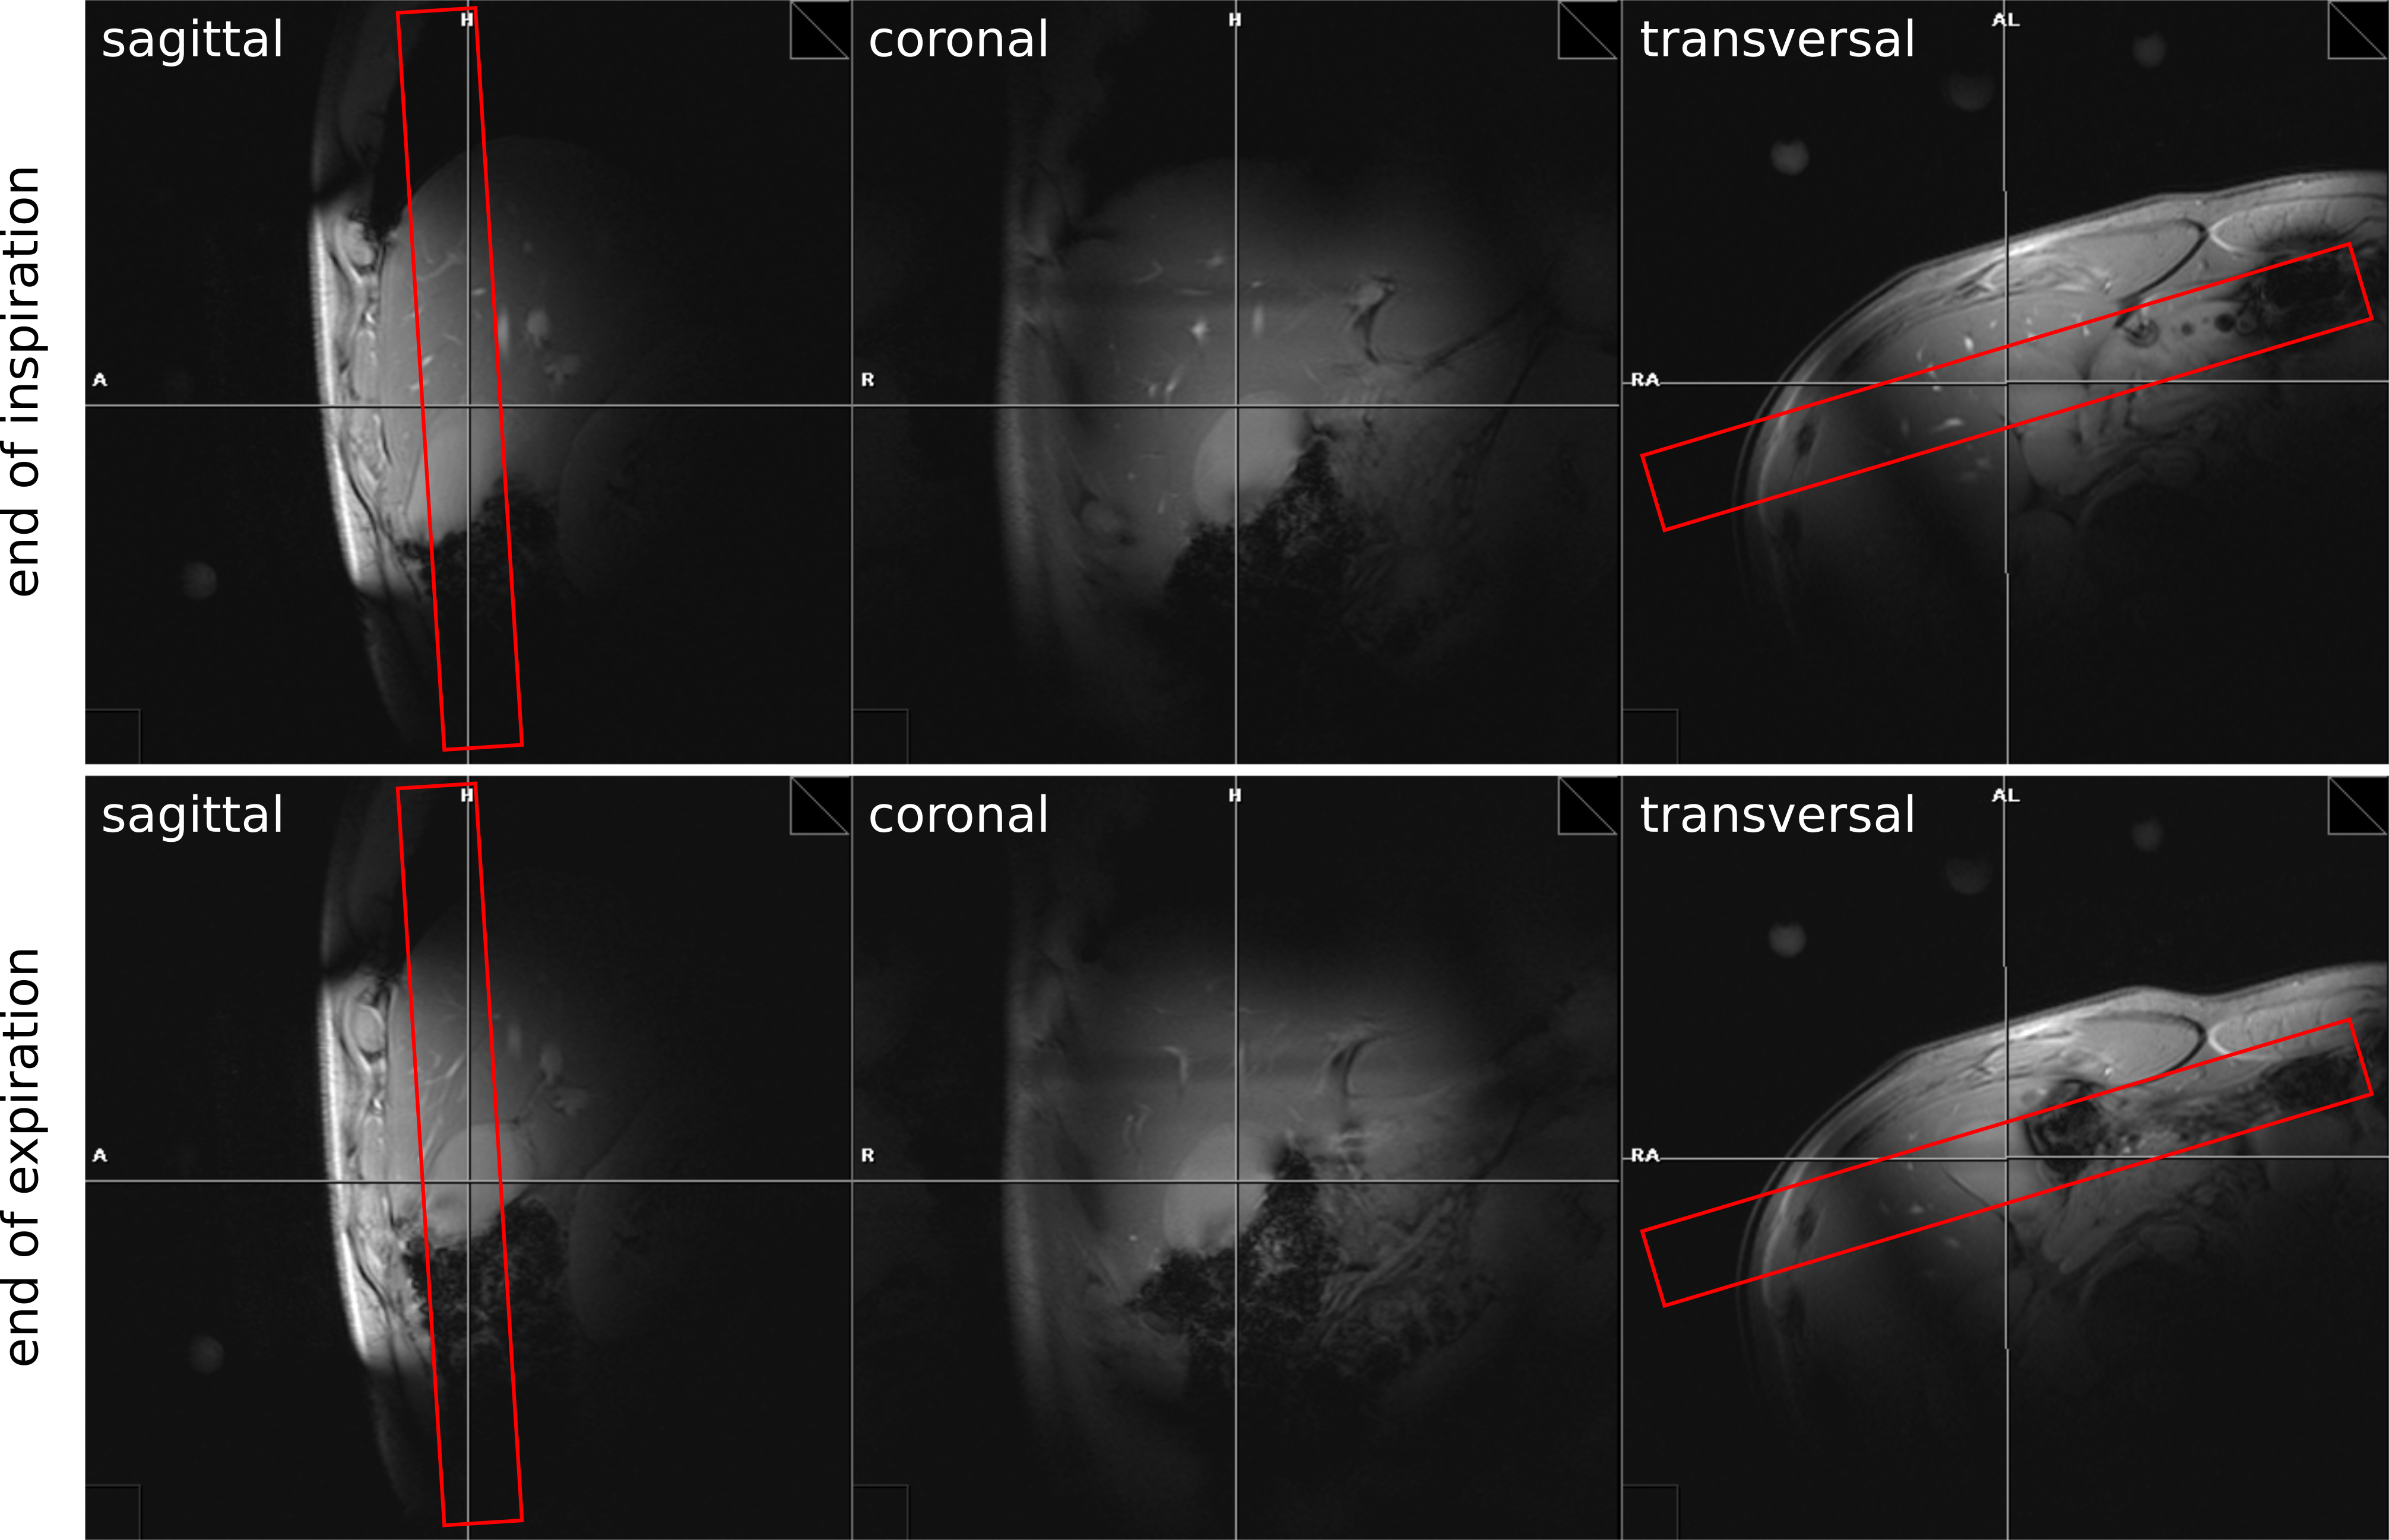
Figure 1:
Scout images (left to right: sagittal,
coronal, transversal) with the 1D-slab for
IR-sequence (red rectangle) and
breath-hold (top row: end of
inspiration, bottom row: end
of expiration)
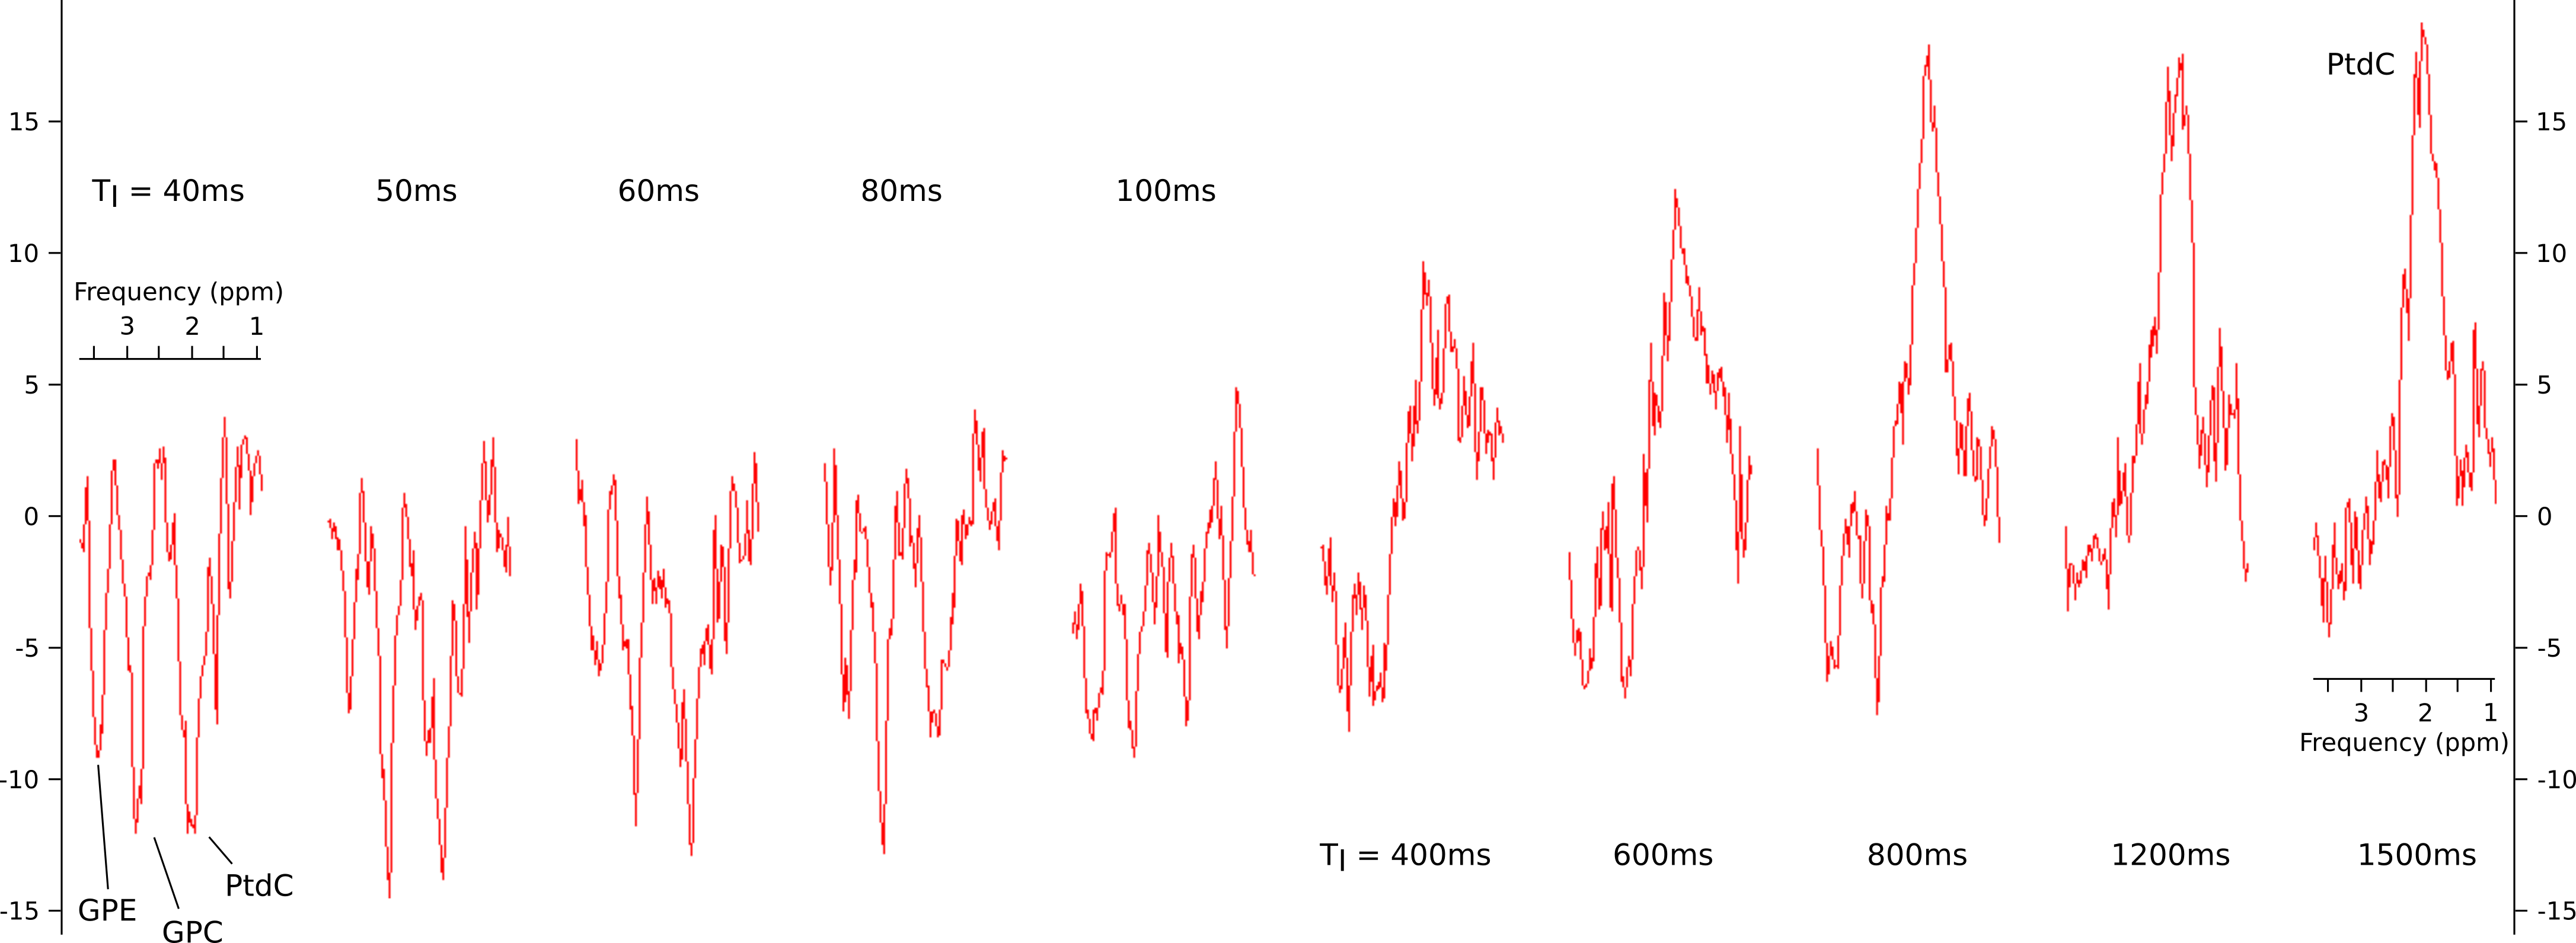
Figure 2:
Spectra of PtdC showing
the signal evolution
measured at
different TIs
(40, 50, 60, 80, 100, 400, 600, 800, 1200 and
1500ms)
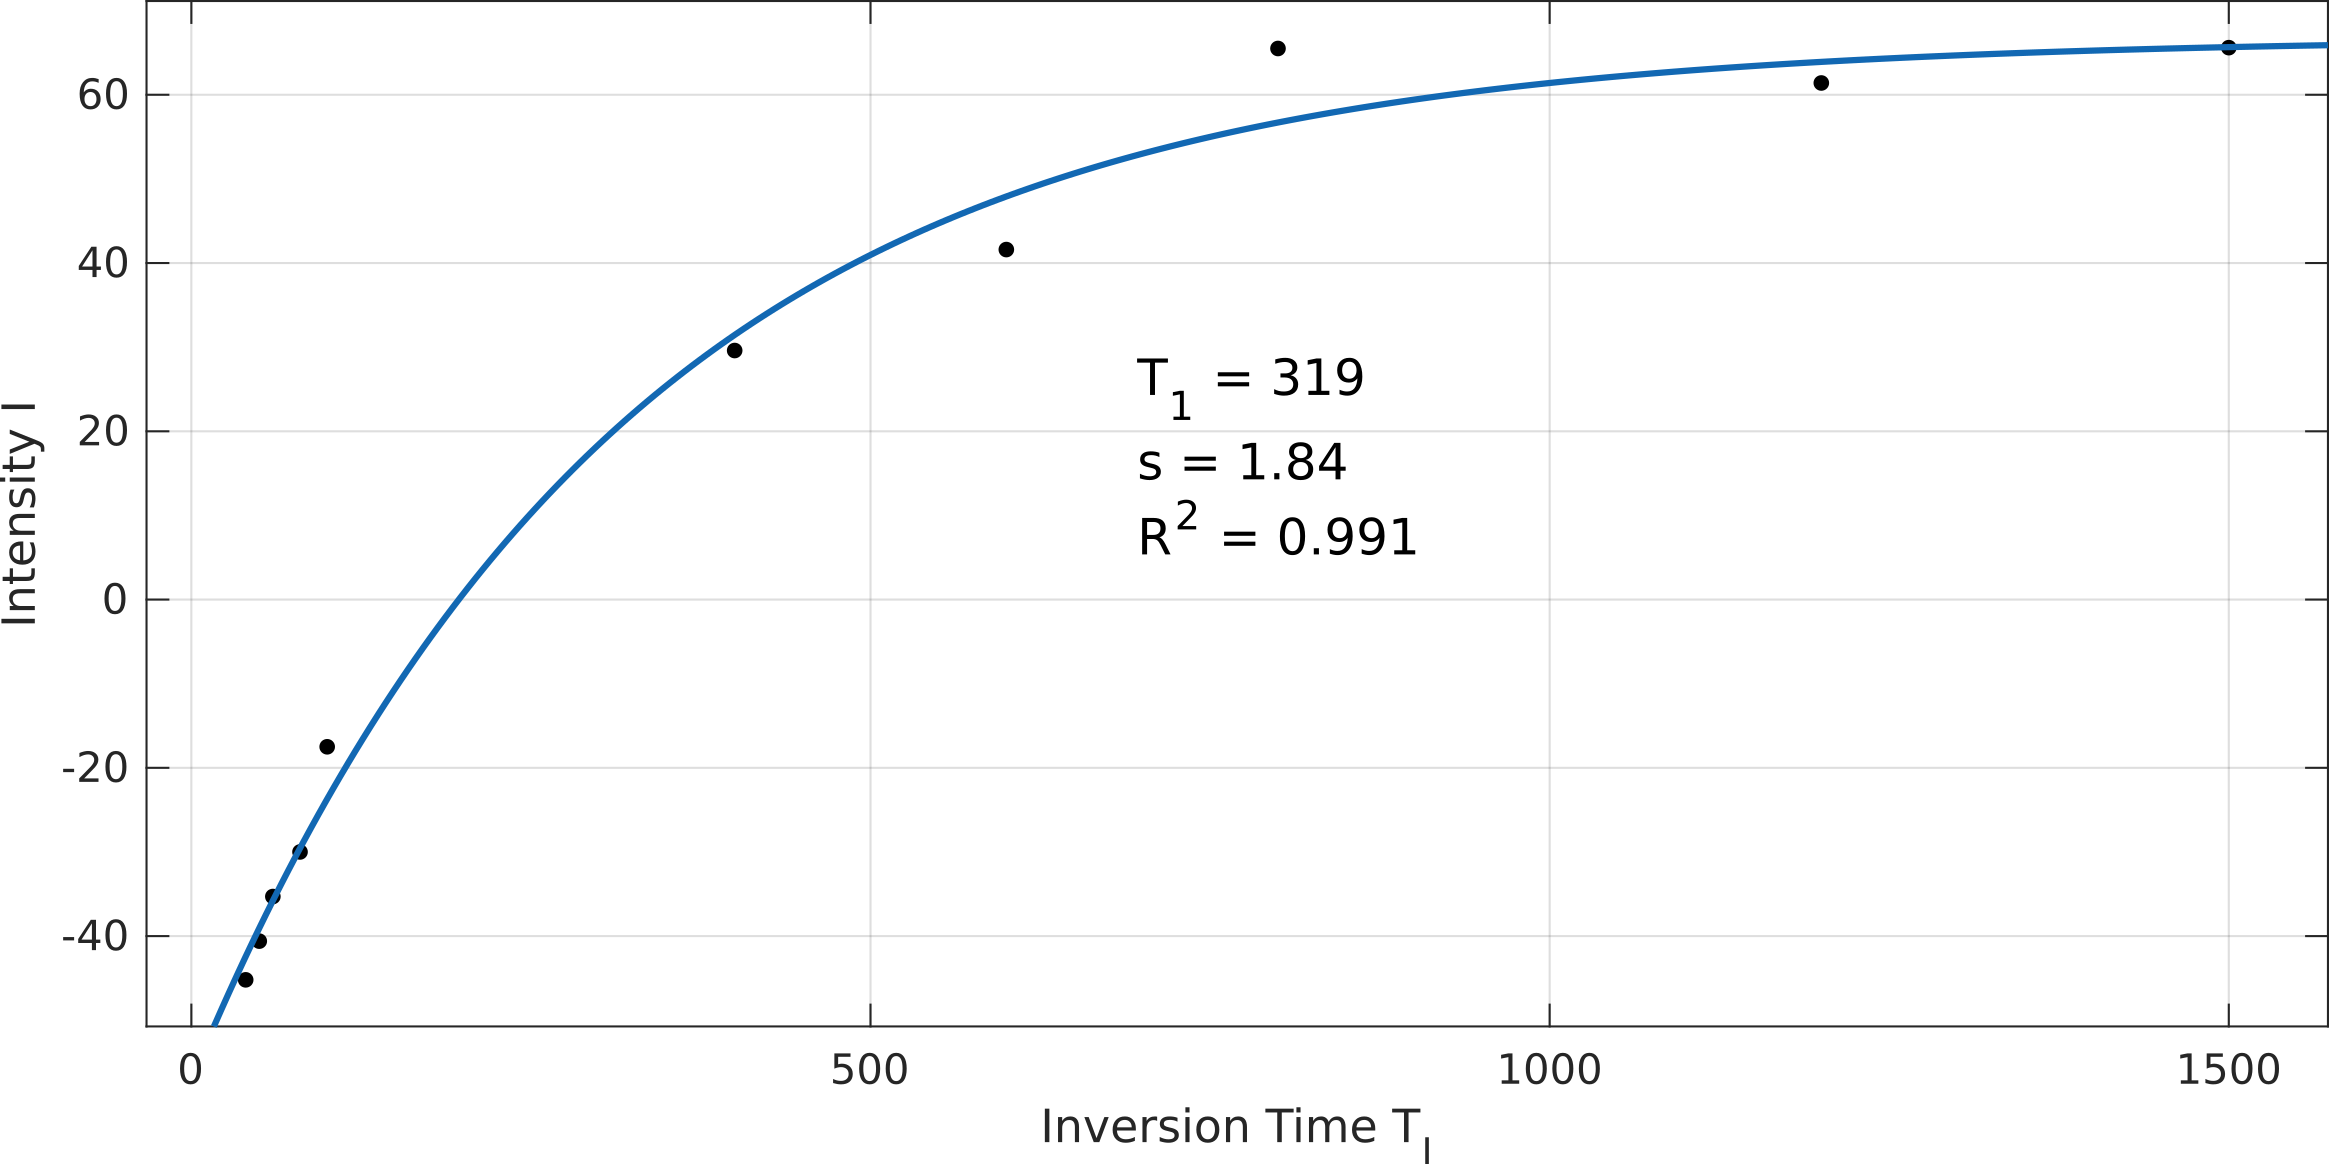
Figure 3:
Fitting of the IR curve

Figure 4:
A:
Simulation of two neighboring signals with equal amplitude but
different phase (+10% noise). The 0ppm peak has 20° phase offset
resulting in more signal contamination originating from the further
downfield peak. B:
IR curve fitting with long TR
of
6000ms.
Note the overshot and decay from 1000ms on.