2872
Optimized PRESS Echo Time for Quantifying Relative ω-3 Fat Content at 9.4T In Vivo1Department of Oncology, University of Alberta, Edmonton, AB, Canada, 2Department of Medical Physics, Cross Cancer Institute, Edmonton, AB, Canada, 3Department of Agricultural, Food, and Nutritional Science, University of Alberta, Edmonton, AB, Canada
Synopsis
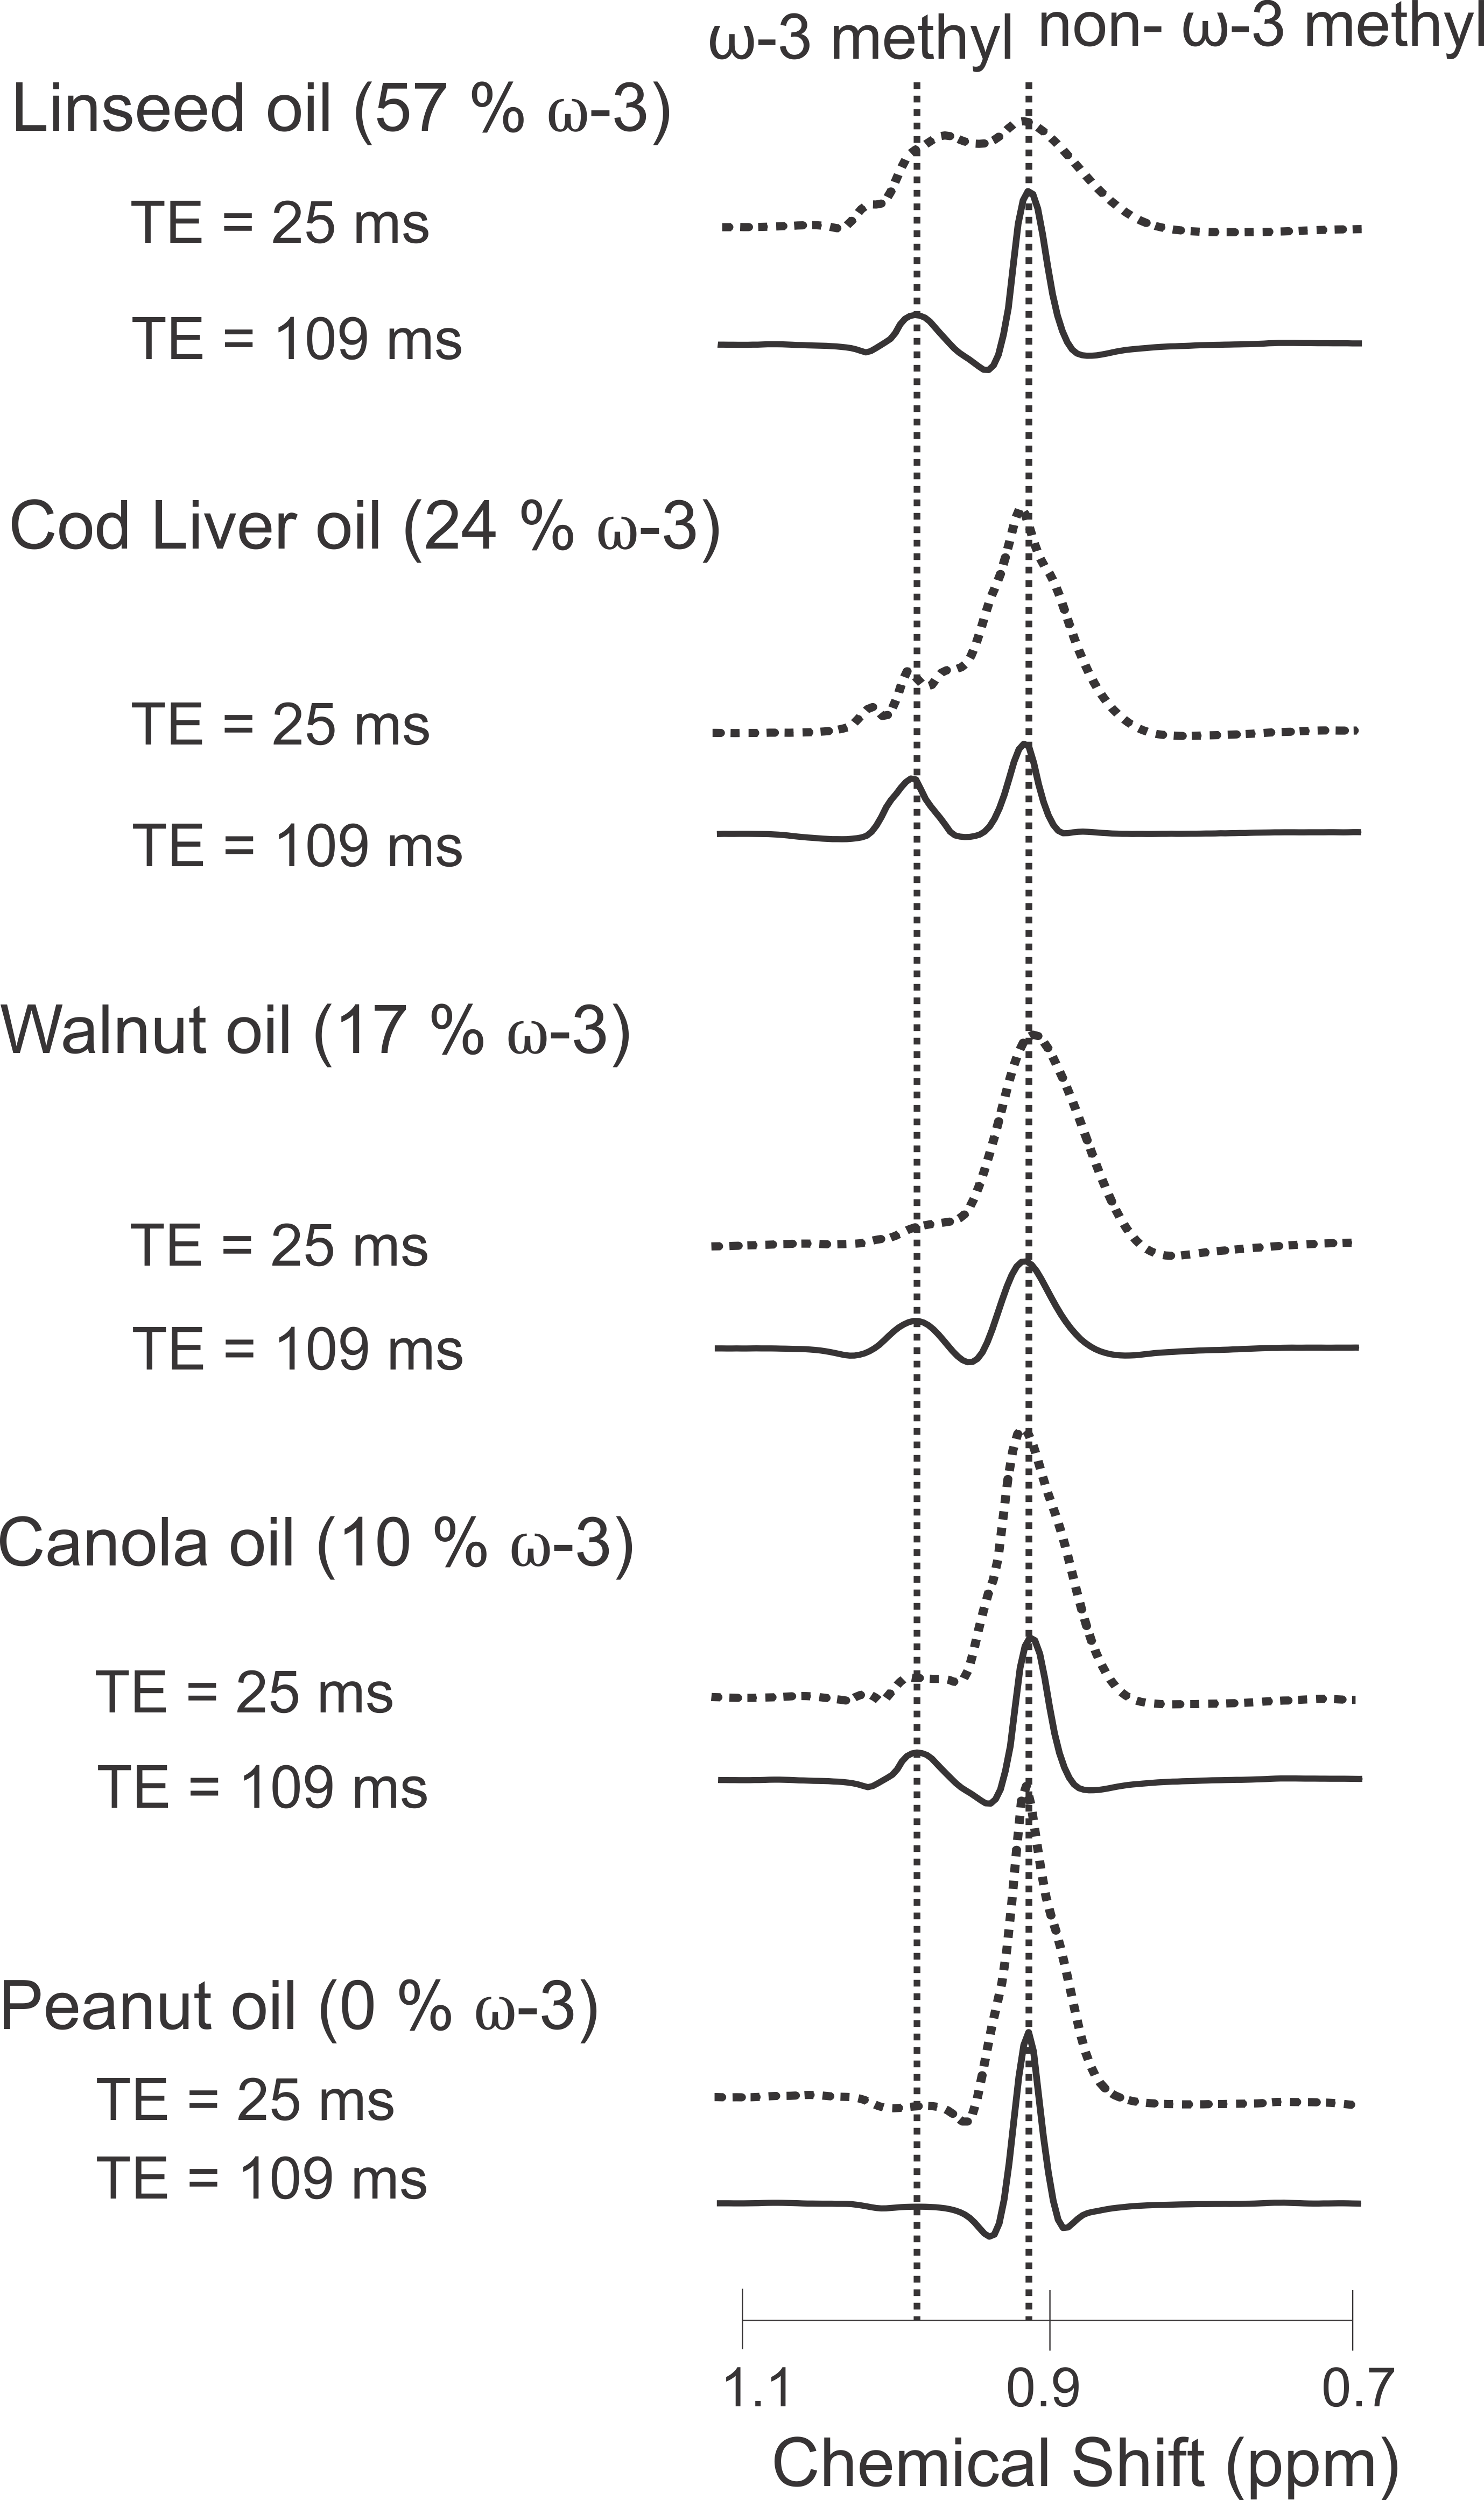
Omega-3 (ω-3) fat content in adipose tissue is relevant to the study of disease. It is challenging to quantify with Magnetic Resonance Spectroscopy (MRS) due to its low concentration in vivo. In addition, its resonance is difficult to resolve from that of the non-ω-3 protons, even at 9.4T. A PRESS (Point RESolved Spectroscopy) echo time of 109ms was determined to yield resolved ω-3 (≈ 0.98ppm) and non-ω-3 (≈ 0.9ppm) methyl peaks at 9.4T. The efficacy of the sequence was verified on oil phantoms and on rats fed a high ω-3 fat diet.
Introduction
Omega-3 (ω-3) dietary fat intake correlates inversely with disease, including obesity 1, bone disease 2,3, and breast cancer 4, and is reflected in adipose tissue fat composition 5-8. Magnetic Resonance Spectroscopy (MRS) can assess fat composition in vivo 9-16; however, ω-3 fat quantification is challenging due to low abundance of ω-3 fats (≈ 1%) in adipose tissue 17. Omega-3 fats have their first carbon-to-carbon double bond on the third carbon from the end-chain fatty acid methyl. Consequently, the ω-3 methyl protons (≈ 0.98ppm) have a higher chemical shift than the non-ω-3 methyl protons (≈ 0.9ppm) and neighbor the allylic (≈ 2.1ppm) protons, whereas the non-ω-3 methyl protons neighbor the methylene (1.3ppm) protons 18,19. Figure 1 illustrates the distinction between ω-3 and non-ω-3 fats. At field strengths of 1.5T and 3T, MRS methods based on a long echo time (TE) 19, J-difference editing 20 and the methyl linewidth 21 have been investigated for quantifying ω-3. Higher magnetic field strengths are commonly employed to study animal models. The better spectral resolution enables separately quantifying saturated, mono-unsaturated and di-unsaturated fatty acids 22,23. Negligible levels of ω-3 fatty acids 22,23 are often assumed because of the low concentration of ω-3 fats 17 and because the ω-3 methyl resonance overlaps the non-ω-3 resonance with standard short-TE techniques. Studies show that ω-3 levels are altered in disease 24,25, correlate with bone health 26, and change with diet 5-8; therefore, enabling ω-3 measurement at higher fields is valuable. Recently, a study at 7T utilized PRESS with an ultra-long TE (1000ms) to resolve the ω-3 methyl peak from the non ω-3 methyl and the methylene resonances 27. The objective of this work is to determine an optimal PRESS echo time (<< 1000ms to reduce T2 losses) to quantify relative ω-3 fat content at 9.4T, another commonly employed high field strength for animal studies.Methods
The response of the methyl resonances to a spin echo sequence was calculated using product operator formalism 20,28. The ω-3 and non-ω-3 methyl protons were modeled as A2X systems, with X as one of three methyl protons and A1 and A2 as the neighboring allylic protons (for ω-3 fats) or methylene protons (for non-ω-3 fats) 20. The term leading to methyl proton observable magnetization is $$X_{x}[\frac{1}{2}+\frac{cos(2\pi JTE)}{2}]$$ where J denotes the coupling constant between the methyl and methylene protons. The methyl protons form a triplet signal, with a constant central peak $$$[\frac{X_{x}}{2}]$$$ and sinusoidal side multiplets $$$[\frac{X_{x}cos(2\pi JTE)}{2}]$$$. Timings where the side multiplets of the ω-3 and non-ω-3 methyl triplets are 0 minimize overlap between the two peaks and occur for TE values of $$$[\frac{2n+1}{4J}]$$$, where n is an integer. Assuming a coupling constant of 6.9Hz 29 yields a TE of 109ms when n = 1. All experiments were conducted with a 21cm diameter 9.4T animal magnet. PRESS spectra were acquired from 5x5x5mm3 voxels from five spherical oil phantoms with varying ω-3 fat content (0% to 57%, determined using 16.5T NMR), using a volume coil. Spectra were acquired with TE values of 25ms (TE1 = 15ms, TE2 = 10ms) and 109ms (TE1 = 15ms, TE2 = 94ms). The sequence efficacy was verified in vivo on a rat fed a high ω-3 fat diet for 12 weeks. The diet consisted of 20% weight/weight fat. The fat portion was 16% ω-3, comprising of 20% flax oil, 30% lard, 40% olive oil, and 10% DHA (docosahexanoic acid). Gated PRESS spectra were obtained from the rat with short and long TE from a 5x5x5mm3 voxel in the visceral fat of the rat abdomen using a rat volume coil (Doty Scientific). The ω-3 to non-ω-3 peak area ratio was calculated for the oils and the rat.Results
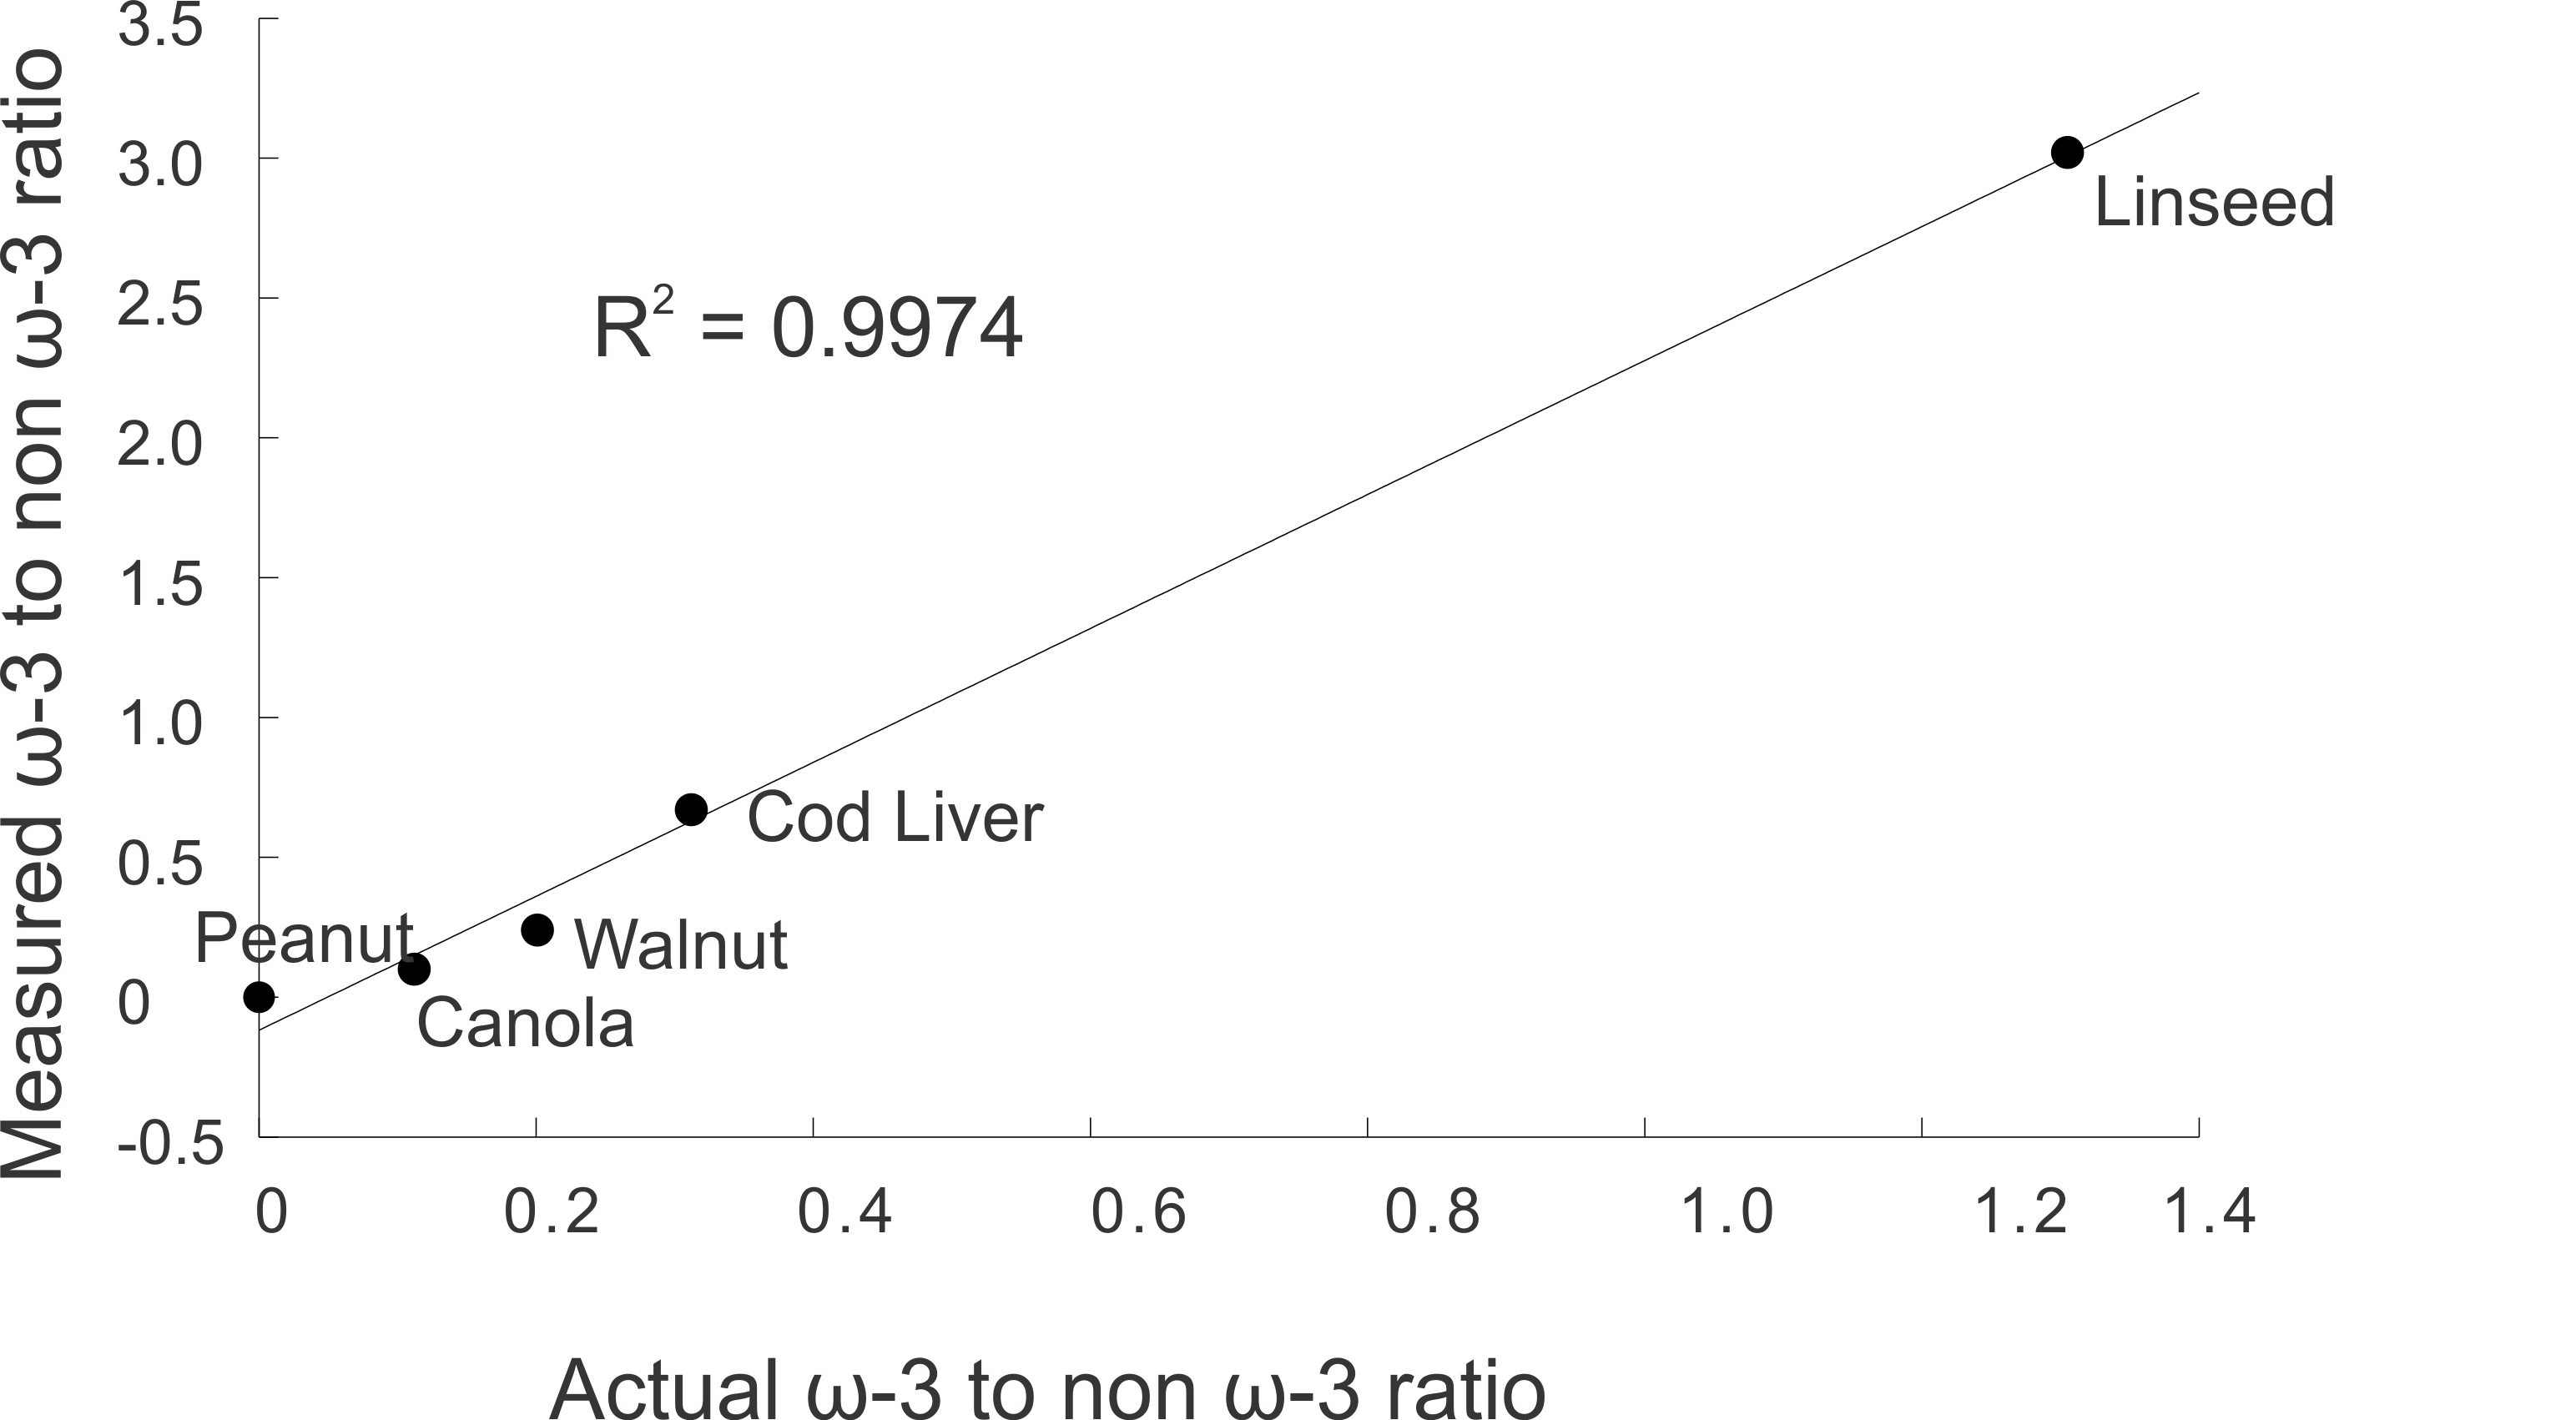
Figure 2 displays spectra obtained from the oils at 9.4T using the short and optimized long TEs. Figure 3 indicates the linear correlation (R2 = 0.9974) between the actual ω-3 to non-ω-3 fat ratio of the oils (determined from 16.5T NMR) and the relative peak area ratio measured using PRESS (TE = 109ms) at 9.4T. Figure 4 displays spectra acquired from the rat using short and long TE values from the voxel shown. The ratio of ω-3 methyl to non ω-3 methyl peak areas in the rat was 0.13 using PRESS with TE of 109ms and the ω-3 methyl peak SNR was 65.Discussion
PRESS with a total TE of 109ms resolves the ω-3 methyl resonance from that of non-ω-3 at 9.4T in phantoms and in rat adipose tissue in vivo. The improved spectral resolution at 9.4T enabled using a shorter TE value than 1000ms, which was employed at 7T 27 to minimize contamination from methylene protons, reducing T2 losses. The optimal TE provides a coefficient of determination of 0.9974 for relative measures of ω-3 to non- ω-3 content; T2 and J-coupling losses prevent absolute quantification. The TE of 109ms was calculated to obtain 0 signal for the side multiplets for methyl resonances. In the experimental spectra some multiplet signal is visible, likely due to evolution of anti-phase coherences during signal detection 28.Conclusion
PRESS with TE of 109ms resolves the ω-3 methyl peak from the non ω-3 methyl peak at 9.4T in vivo.Acknowledgements
Grant and student funding from the Natural Sciences and Engineering Research Council of Canada is gratefully acknowledged.
References
1. Buckley JD, Howe PRC. Long-chain omega-3 polyunsaturated fatty acids may be beneficial for reducing obesity—A review. Nutrients 2010;2:1212-1230.
2. Ahmed MA, Samad AAAE. Benefits of omega-3 fatty acid against bone changes in salt-loaded rats: possible role of kidney. Physiol Rep 2013;1:e00106.
3. Lavado-García J, Roncero-Martin R, Moran JM, et al. Long-chain omega-3 polyunsaturated fatty acid dietary intake is positively associated with bone mineral density in normal and osteopenic Spanish women. PLOS ONE 2018;13:e0190539.
4. Fabian CJ, Kimler BF, Hursting SD. Omega-3 fatty acids for breast cancer prevention and survivorship. Breast Cancer Res 2015;17:1-11.
5. Tou JC, Altman SN, Gigliotti JC, Benedito VA, Cordonier EL. Different sources of omega-3 polyunsaturated fatty acids affects apparent digestibility, tissue deposition, and tissue oxidative stability in growing female rats. Lipids Health Dis 2011;10:179-193.
6. Lau B, Fajardo V, McMeekin L, et al. Influence of high-fat diet from differential dietary sources on bone mineral density, bone strength, and bone fatty acid composition in rats. Appl Physiol Nutr Metab 2010;35:598-606.
7. Jurešić GČ, Percan K, Broznić D. Effect of dietary fatty acid variation on mice adipose tissue lipid content and phospholipid composition. Croat J Food Tech Biotech Nutr 2016;11:128-137.
8. Cunnane SC, McAdoo KR, Horrobin DF. n-3 Essential fatty acids decrease weight gain in genetically obese mice. Br J Nutr 1986;56:87-95.
9. Lundbom J, Hakkarainen A, Söderlund S, Westerbacka J, Lundbom N, Taskinen M-R. Long-TE 1H MRS suggests that liver fat is more saturated than subcutaneous and visceral fat. NMR Biomed 2011;24(3):238-245.
10. Mosconi E, Fontanella M, Sima DM, et al. Investigation of adipose tissues in Zucker rats using in vivo and ex vivo magnetic resonance spectroscopy. J Lipid Res 2011;52(2):330-336.
11. Yeung DKW, Griffith JF, Antonio GE, Lee FKH, Woo J, Leung PC. Osteoporosis is associated with increased marrow fat content and decreased marrow fat unsaturation: A proton MR spectroscopy study. J Magn Reson Imaging 2005;22(2):279-285.
12. Machann J, Stefan N, Schabel C, et al. Fraction of unsaturated fatty acids in visceral adipose tissue (VAT) is lower in subjects with high total VAT volume - a combined 1H MRS and volumetric MRI study in male subjects. NMR Biomed 2013;26(2):232-236.
13. Pollesello P, Eriksson O, Hӧckerstedt K. Analysis of total lipid extracts from human liver by 13C and 1H Nuclear Magnetic Resonance Spectroscopy. Anal Biochem 1996;236:41-48.
14. He Q, Shkarin P, Hooley RJ, Lannin DR, Weinreb JC, Bossuyt VIJ. In vivo MR spectroscopic imaging of polyunsaturated fatty acids (PUFA) in healthy and cancerous breast tissues by selective multiple-quantum coherence transfer (Sel-MQC): A preliminary study. Magn Reson Med 2007;58(6):1079-1085.
15. Patsch JM, Li X, Baum T, et al. Bone marrow fat composition as a novel imaging biomarker in postmenopausal women with prevalent fragility fractures. J Bone Miner Res 2013;28:1721-1728.
16. Korteweg MA, Veldhuis WB, Mali WPTM, et al. Investigation of lipid composition of dissected sentinel lymph nodes of breast cancer patients by 7 T proton MR spectroscopy. J Magn Reson Imaging 2012;35(2):387-392.
17. Hodson L, Skeaff CM, Fielding BA. Fatty acid composition of adipose tissue and blood in humans and its use as a biomarker of dietary intake. Prog Lipid Res 2008;47:348-380.
18. Guillén MD, Ruiz A. High resolution 1H nuclear magnetic resonance in the study of edible oils and fats. Trends Food Sci Technol 2001;12:328-338.
19. Lundbom J, Heikkinen S, Fielding B, Hakkarainen A, Taskinen M-R, Lundbom N. PRESS echo time behavior of triglyceride resonances at 1.5 T: Detecting ω-3 fatty acids in adipose tissue in vivo. J Magn Reson 2009;201:39-47.
20. Škoch A, Tošner Z, Hájek M. The in vivo J-difference editing MEGA-PRESS technique for the detection of n-3 fatty acids. NMR Biomed 2014;27:1293-1299.
21. Fallone CJ, McKay RT, Yahya A. Long TE STEAM and PRESS for estimating fat olefinic/methyl ratios and relative ω-3 fat content at 3T. J Magn Reson Imaging 2018;48:169-177.
22. Yahya A, Tessier AG, Fallone BG. Effect of J-coupling on lipid composition determination with localized proton magnetic resonance spectroscopy at 9.4T. Journal of Magnetic Resonance Imaging 2011;34:1388-1396.
23. Strobel K, van den Hoff J, Pietzsch J. Localized proton magnetic resonance spectroscopy of lipids in adipose tissue at high spatial resolution in mice in vivo. J Lipid Res 2008;49:473-480.
24. Baracos V, Mazurak V, Ma D. n-3 Polyunsaturated fatty acids throughout the cancer trajectory: influence on disease incidence, progression, response to therapy and cancer-associated cachexia. Nutrition Research Reviews 2004;17:177-192.
25. Bougnoux P, Koscielny S, Chajès V, Descamps P, Couet C, Calais G. α- Linolenic acid content of adipose breast tissue: a host determinant of the risk of early metastasis in breast cancer. Br J Cancer 1994;70:330-334.
26. Li Y, Seifert MF, Lim SY, Salem NJ, Watkins BA. Bone mineral content is positively correlated to n-3 fatty acids in the femur of growing rats. Br J Nutr 2010;104(674-685).
27. Gajdošík M, Hingerl L, Škoch A, et al. Ultralong TE in vivo 1H NMR spectroscopy of omega-3 fatty acids in subcutaneous adipose tissue at 7 T. J Magn Reson Imaging 2019;50:71-82.
28. Sørensen OW, Eich GW, Levitt MH, Bodenhausen G, Ernst RR. Product operator formalism for the description of NMR pulse experiments. Prog Nucl Mag Res Spectrosc 1983;16:163-192.
29. Oostendorp M, Engelke U, Willemsen M, Wevers R. Diagnosing inborn errors of lipid metabolism with proton nuclear magnetic resonance spectroscopy. Clin Chem 2006;52:1395-1405.
Figures